Moving Averages & Bollinger Bands3 Moving Averages and Bollinger Bands in 1 Indicator
SMA or EMA
Exponential Bollinger Bands available
Turn bands on or off
Customize period length and standard deviations
在腳本中搜尋"布林线boll指标使用详细讲解"
Calendar's Bollinger BandsHI guys, I'm Calendar
I made my 2nd indicator for my followers.
This indicator made by merging 2 Bollinger Bands.(SDV =1, 2)

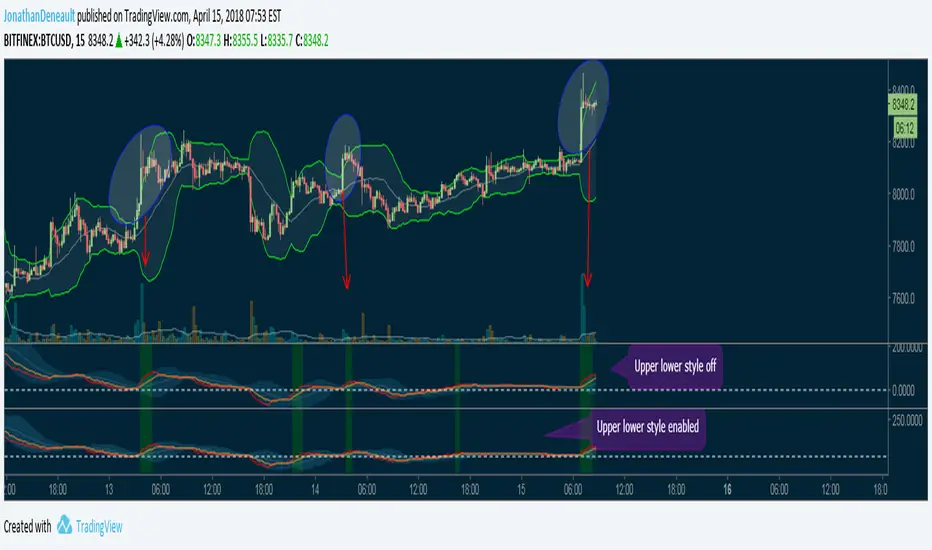
MacD + Bollinger BandsI made this simple script to use the MacD's EMA tapes with bollinger bands to leave the board free to better visualize the marked features, can be noticed that when the candlesticks come out of the bollinger bands, the EMA strips of the MAcD are also coming out, so it's still useful and they are indicated by the green breaches. I also advise to disable the Upper / Lower in the style tab, this gives a crushing effect. You can turn off the breach too !
VWMA Bollinger BandsHey there fellow bollinger band fans!
The main point of this script is to give bollinger bands with a vwma basis rather than a sma basis. It is important to note that the default setting is to average the opening price rather than closing price of previous candles (just my personal preference). Also by default this script shows bands based on one, two and three standard deviations from the vwma basis. Play with the settings and change them to what you like.

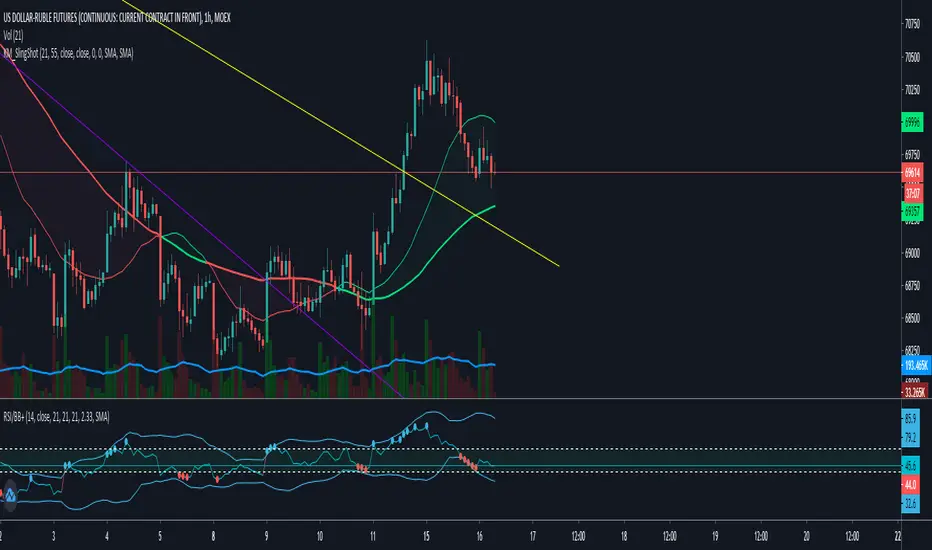
RSI+ with Bollinger BandsRelative Strenght Index + SMA on RSI + Bollinger Bands on it - very good solution to see reversals and see lows and highs.
Use different timeframe.
StdDev is 2.17 by default to get 97% probability.
RSI + SMA с наложенными Bollinger Bands - прекрасное решение для поиска разворотных точек и аномального поведения цены.
Используйте разные таймфреймы одновременно.
StdDev = 2.17 по умолчанию для обеспечения попадания в диапазон в 97% случаев.
DEnvelope [Better Bollinger Bands]*** ***
Bollinger Bands (BB) usually expand quickly after a volatility increase but contract more slowly as volatility declines. This extended time it takes for BB to contract after a volatility drop can make trading some instruments using BB alone difficult or less profitable.
In the October 1998 issue of "Futures" there is an article written by Dennis McNicholl called "Better Bollinger Bands", in which the author recommends improving BB by modifying:
- the center line formula &
- different equations for calculating the bands.
These bands, called "DEnvelope", follow price more closely and respond faster to changes in volatility with these modifications.
Fore more indicators, check out my "Master Index of indicators" (Also check my published charts page for new ones I haven't added to that list):
More scripts related to DEnvelope:
------------------------------------------------
- DEnvelope Bandwidth: pastebin.com
- DEnvelope %B : pastebin.com
Sample chart with above indicators: www.tradingview.com

RSI/Stochastic with overlays a moving average + Bollinger BandsCompact oscillator panel that lets you switch the base between RSI and Stochastic %K, then overlays a moving average + Bollinger Bands on the oscillator values (not on price) to read momentum strength and squeeze/expansion.
What’s added
Selectable base: RSI ↔ Stochastic %K (plots %D when Stoch is chosen).
MA + BB on oscillator to gauge momentum trend (MA) and volatility (bands).
Adjustable bands 70/50/30 with optional fill, plus optional regular divergence and alerts.
How to read
Bull bias: %K above osc-MA and pushing/closing near Upper BB; confirm with %K > %D.
Bear bias: %K below osc-MA and near Lower BB; confirm with %K < %D.
Squeeze: BB on oscillator tightens → expect momentum breakout.
Overextension: repeated touches of Upper/Lower BB in 70/30 zones → strong trend; watch for %K–%D recross.
Quick settings (start here)
Stoch: 14 / 3 / 3; Bands: 70/50/30.
Osc-MA: EMA 14.
BB on oscillator: StdDev 2.0 (tune 1.5–2.5).
Note
Analysis tool, not financial advice. Backtest across timeframes and use risk management.

Multi-Length Quad Bollinger BandsHere is a Pine Script code for TradingView that plots four separate Bollinger Bands on your chart. The lengths are preset to 14, 50, 100, and 200, but every aspect—including lengths, standard deviations, colors, and the source price—is fully customizable through the script's settings menu.
The 14 and 50-period bands are enabled by default, while the 100 and 200-period bands are disabled to keep the chart clean initially. You can easily toggle any of them on or off.

Pino Trend Pack (SMA/EMA + Bollinger)🔹 Pino Trend Pack is a compact trend-following and volatility indicator that includes:
📈 Moving Averages:
- SMA 10, SMA 30
- EMA 21, EMA 55, EMA 89
(All configured for short-term to mid-term trend analysis by default, but fully adjustable for user preference.)
📊 Bollinger Bands:
- Period: 20
- Standard Deviation: 2.0
- Includes Upper Band, Lower Band, and Basis (SMA 20)
This pack is designed for traders who want a clean visual of price dynamics across multiple short-term trend layers, combined with volatility tracking. It helps you identify compression, expansion, and trend shifts at a glance.
🧠 Ideal for swing trading, short- to mid-term setups, or as a supporting tool in any confluence-based strategy.

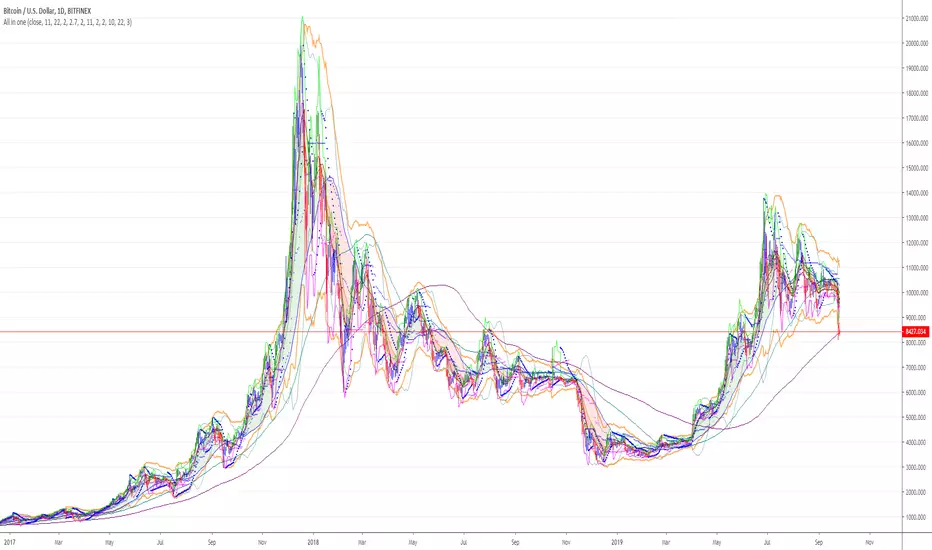
Logarithmic Bollinger Bands [MisterMoTA]The script plot the normal top and bottom Bollinger Bands and from them and SMA 20 it finds fibonacci logarithmic levels where price can find temporary support/resistance.
To get the best results need to change the standard deviation to your simbol value, like current for BTC the Standards Deviation is 2.61, current Standard Deviation for ETH is 2.55.. etc.. find the right current standard deviation of your simbol with a search online.
The lines ploted by indicators are:
Main line is a 20 SMA
2 retracement Logarithmic Fibonacci 0.382 levels above and bellow 20 sma
2 retracement Logarithmic Fibonacci 0.618 levels above and bellow 20 sma
Top and Bottom Bollindger bands (ticker than the rest of the lines)
2 expansion Logarithmic Fibonacci 0.382 levels above Top BB and bellow Bottom BB
2 expansion Logarithmic Fibonacci 0.618 levels above Top BB and bellow Bottom BB
2 expansion Logarithmic Fibonacci level 1 above Top BB and bellow Bottom BB
2 expansion Logarithmic Fibonacci 1.618 levels above Top BB and bellow Bottom BB
Let me know If you find the indicator useful or PM if you need any custom changes to it.

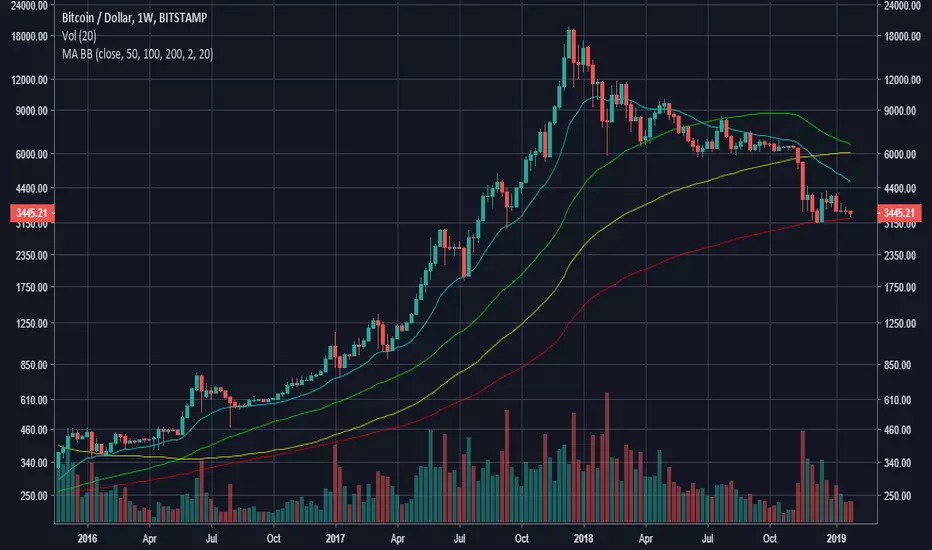
Steven Primo's bollinger bands strategyHi, this strategy is taken from a video made by Steven Primo. You can look it up on YouTube if you want to know about it.
It is a mean-reversion strategy based on the Bollinger Bands, in which we wait for 5 consecutive closes above the upper band, and for a short-term top. Once it happens, we place an entry order on this top, with a stop at the nearest bottom before the movement started, and use the difference from the stop and entry point to determine the target. For shorting, it's the same process, but for the downside. From my testing, only long orders were profitable, but you can configure whichever you want.
It works well for directional markets with a low level of noise, as you can see with the BTCUSD chart. One of its caveats is the short number of occurrences, and the long stop loss and target. You can enable a trailing stop, but from my testings, it just made the results worse.
I made some modifications, like removing the MA requirement, since the entry point was above it almost all the time, and I forced the BB to use a log version of the prices, so that discrepancies are eliminated. You'll also notice that you can't select an extension that is lower than 100, and that is intentional, since you're not supposed to enter a trade in which you can lose more than what you can earn.
I chose not to implement any kind of risk management, but I might do that in the future. You can leave your suggestions in the comments.

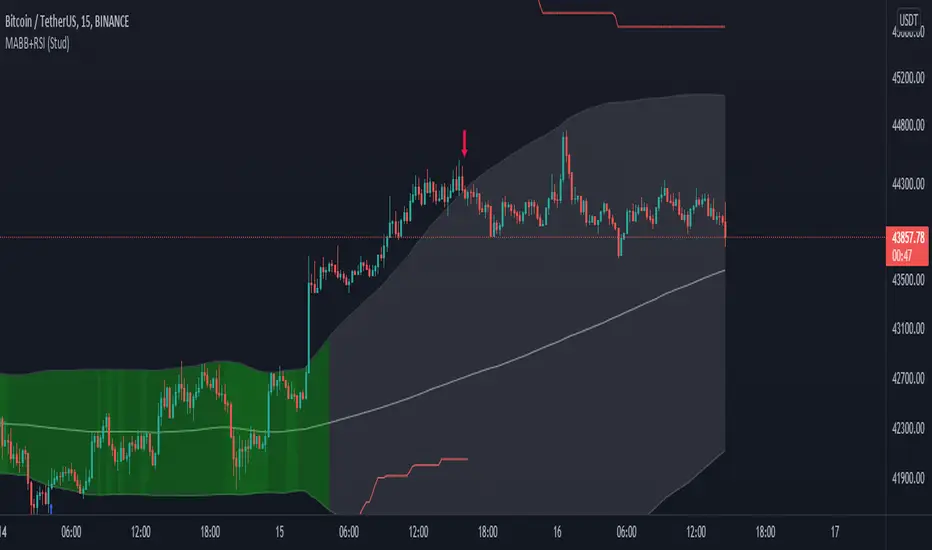
MA Bollinger Bands + RSI (Study)This study/indicator script is meant to allow users to set alerts based on my MA Bollinger Bands + RSI (Strategy).
Both Study and Strategy scripts reflect the exact same user inputs, parameters and trading signals.
6 different alerts available:
- MABB+RSI Long (or Short) Signal (all): activates for every single Long (or Short) signals
- MABB+RSI Long (or Short) Signal: activates when trade direction changes from Short to Long (or from Long to Short)
- MABB+RSI Long (or Short) Re-Entry Signal: after a stop loss was hit, activates upon same trade direction if new signal
(“Enable SL” & “Allow re-entry” must be switched on)
Chart legend:
- Red arrow = Short Signal
- Blue arrow = Long Signal
- Red square = Stop loss (when trade entry)
- Purple square = Stop loss (when hit)
NB1: Be sure to set both Study and Strategy script settings to the same values if you want to achieve similar results in both scripts.
NB2: When setting up your alerts, preferably use option “Once per bar close” to get proper confirmations.
Enjoy!
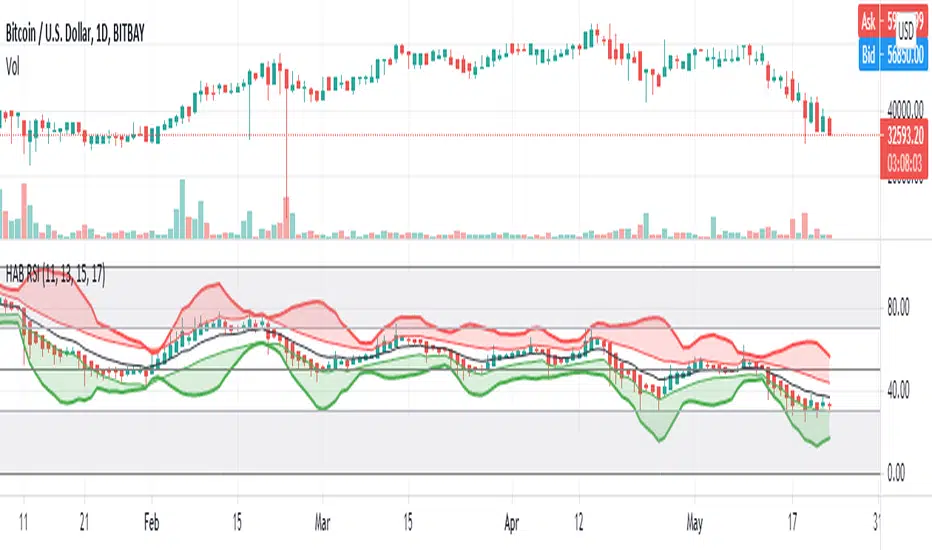
HARSI - HeikinAshi RSI (with Bollinger Bands)This is my first published script. I hope it might be useful!
This is a modified RSI that attempts to give smoother values. It takes 4 different input lengths and plots them in a similar way as Heikin-Ashi candles does.
It can be used in the same way as a regular RSI.
It also includes Bollinger Bands that might help identify overbought/oversold situations.
The script uses a slightly modified Allanster's 'Heikin Ashi source function' (many thanks for that very useful script!).
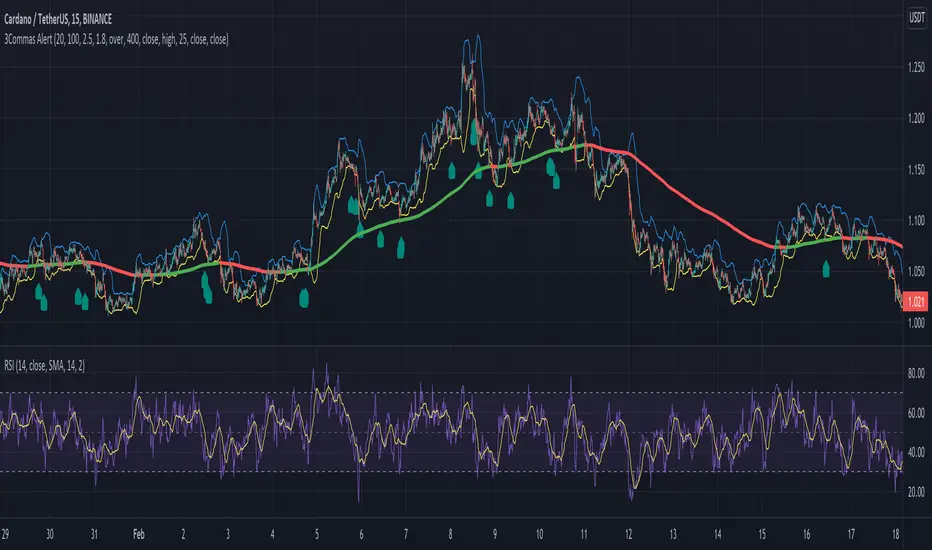
Alert for 3Commas Bollinger StrategyThis is just an alert for the 3Commas Bollinger Strategy written by tedwardd
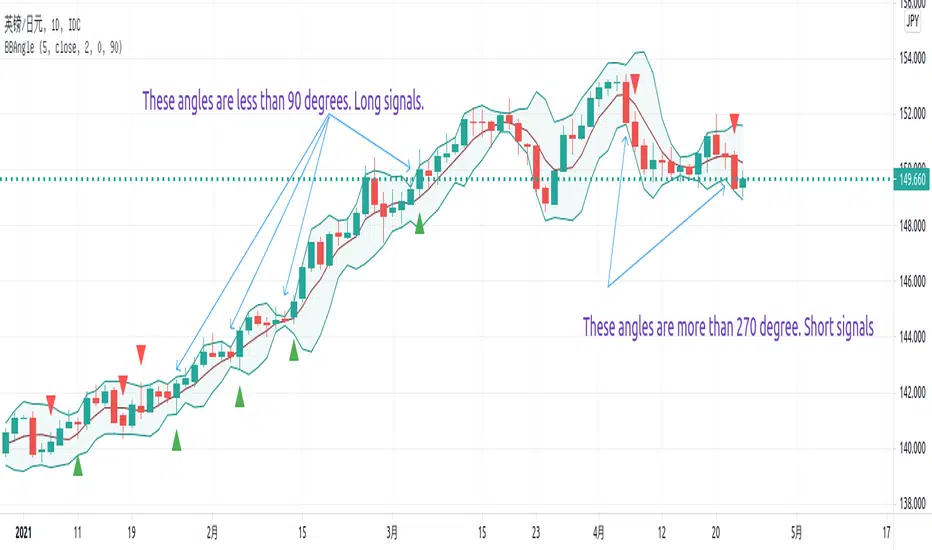
Angle of Bollinger Bands AlertThis script is used to calculate angle of Bollinger Bands and also setup alerts.
The angle is based on the rules:
- if the previous 2 is 1.1, previous 1 is 1, and the current is 1.1, then the angle should be 90 degrees.
- if the previous 2 is 0.9, previous 1 is 1, and the current is 0.9, then the angle should be 270 degrees
If upper angle is below 90 degrees and close is above the average, it is long signal.
If lower angle is above 270 degrees and close is below the average, it is short signal.
- It is good for catch trend trading.
- Not good for swing trading as the BB changes are very tiny but angles for upper may hit below 90 degrees or angle of lower may be above 270 degrees.
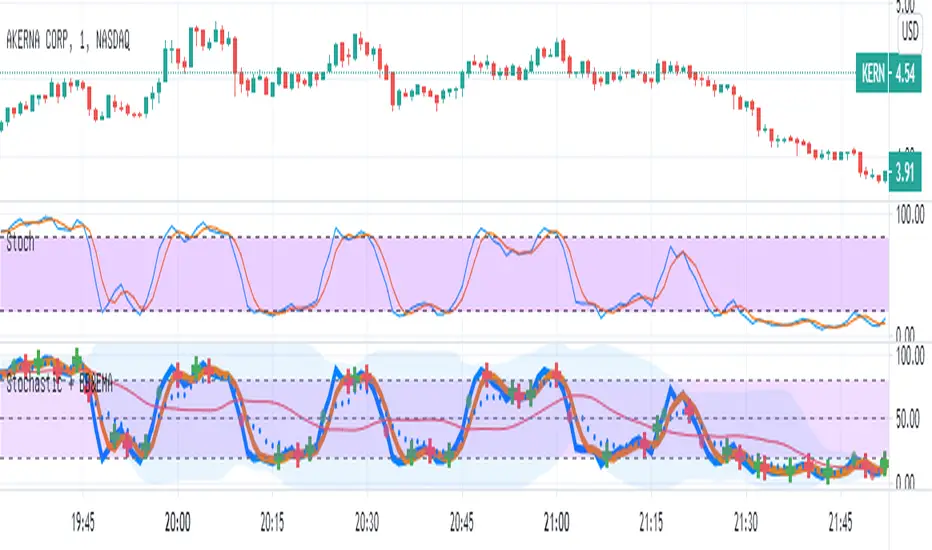
Stochastic with Bollinger & EMAIn this script
I combined the various of the oscillator
Stochastic (STOCH) with BB (Bollinger Bands).
Each cut of K and D creates a mark (+) Red / green - accordingly.
As the Stochastic (K) crosses the BB base, a green / red point is formed accordingly.
As a sign it is possible to continue up / down.
I added EMA8 to K (style circles)
When the oscillator is above the EMA - it is possible that this is a clear sign of an increase.
Band 50 was also added to facilitate the calculations.
MFI & EMA & Bollinger BandsIn this script
I combined the various of the oscillator
MFI ( Money Flow Index ) with BB ( Bollinger Bands ).
As the MFI crosses the BB base, a green / red point is formed accordingly.
As a sign it is possible to continue up / down.
I added EMA8 to MFI (style circles)
When the oscillator is above the EMA - it is possible that this is a clear sign of an increase.
Band 50 was also added to facilitate the calculations.

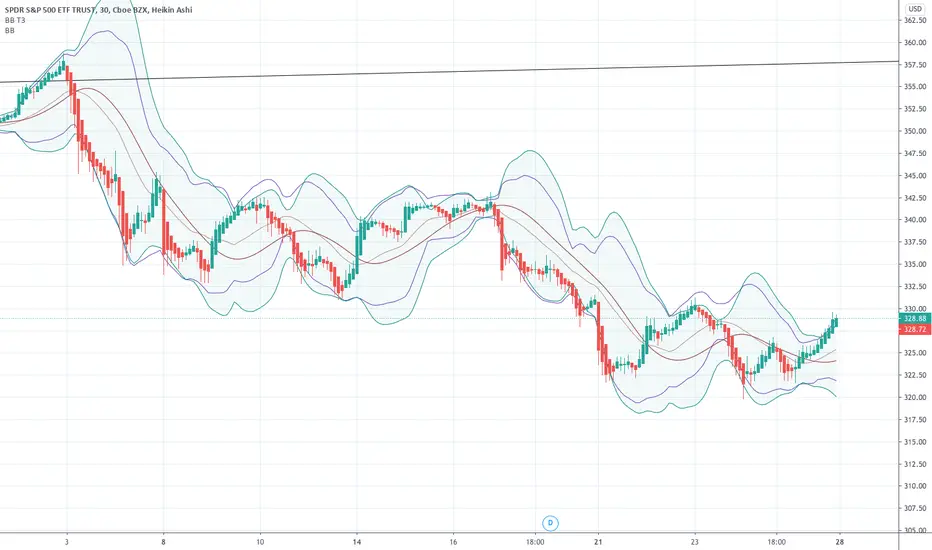
Moving Average, T3 and Bollinger StrategyThis strategy uses a SMA much like an the faster EMA in many oscillators and the T3 average of the same period as the intermediate trend. Exits are defined by encounters with the Bollinger Band. The long term trend is defined by T3 moving averages of an even longer period.

A smoother Bollinger BandThe Bollinger Band is a popular indicator due to it's ability to accurately predict future ranges based on prior volatility. However the bands can fluctuate wildly as a result of acute changes to the price. This results in a channel that is sensitive though replete with sharp angles. Replacing the simple moving average basis line with a Tillson T3 moving average results in a smoother albeit slower basis line. Deriving the bands from partially smoothed data results in more continuous bands than those of the original equation.
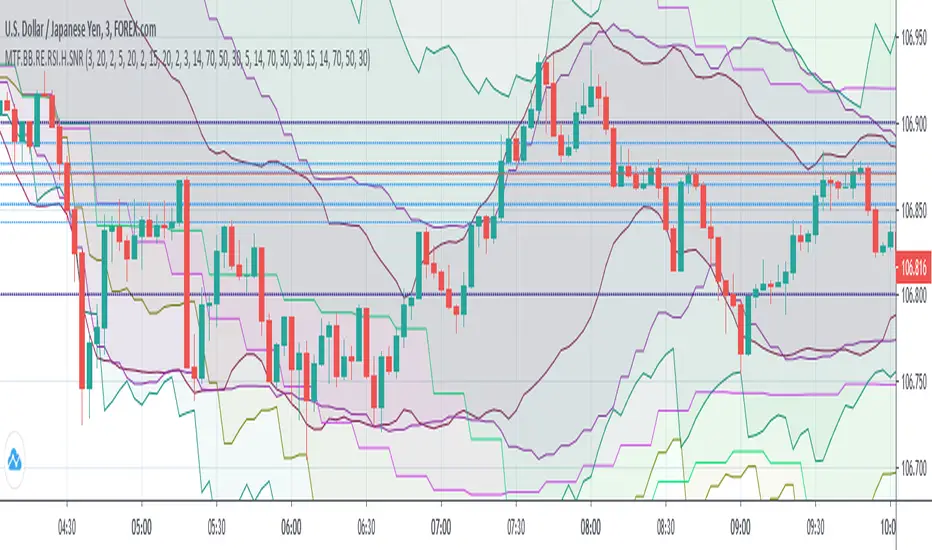
(MTF) Bollinger Bands + RE RSIs + Hidden Supports & ResistancesI merged some of my previous written indicators, because a combination of multi-timeframe Bollinger Bands, RE RSI and Resistance/Support levels could help a lot.
Don't forget to add my other useful indicator (Classical SnR) to the chart to maximize your profit!
Rsi, Ema , Ma and Bollinger Bands for 1 min BtcusdtThis is for 1 min Btcusdt pair.
I am tring to find a way to catch %1 ups and downs.
Basicly it buys when rsi low and minute candle closes under ema,ma and lower bollinger band,
it sells when candle goes over upper bb,low ma, when rsi high.
It sells when rsi high ,candle closes over upper bb,over low ma and does the opposite when buying.
I know it's crowded but still tring to learn what to do ^^
I welcome any suggestions to improve.
It works better with shorts for now.
Don't buy with this !! You might lose big !

ENVELOPE BOLLINGER KELTN IMPULSE EMA SMA SAFEZONE SAR CHANDELIERALL THIS ALL IN ONE!
there are many options to check or uncheck to show only the tool that you need at that particular moment.
ENJOY!
ENVELOPE BOLLINGER KELTNER IMPULSE EMA SMA SAFEZONE SAR CHANDELIER
Multi EMA/SMA with Bollinger Bands Combo 1.0This script provides:
5 regular EMAs
5 regular SMAs
3 multiple time frame EMAs
3 multiple time frame SMAs
Bollinger Bands
All features can be turned on/off and customized regarding color, lines, etc.
Excellent for TradingView users with limited or free accounts.
