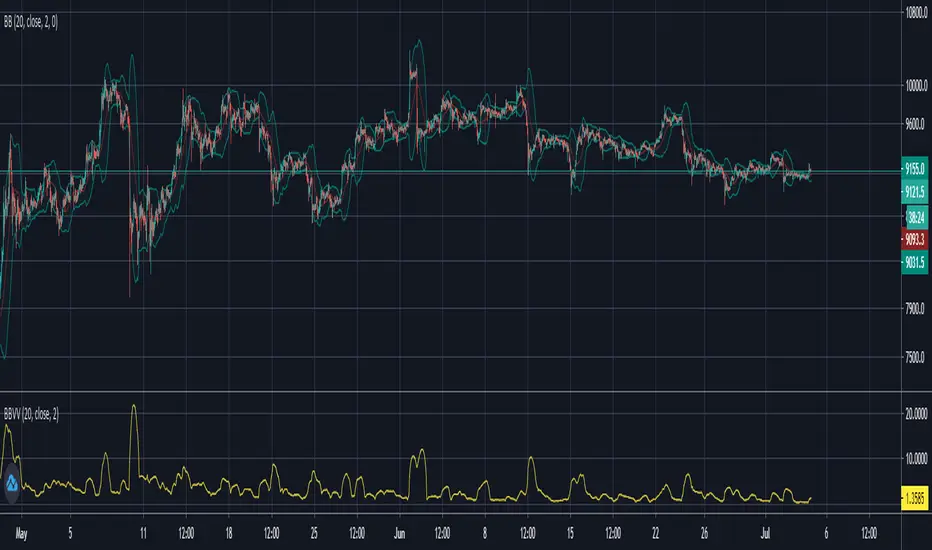
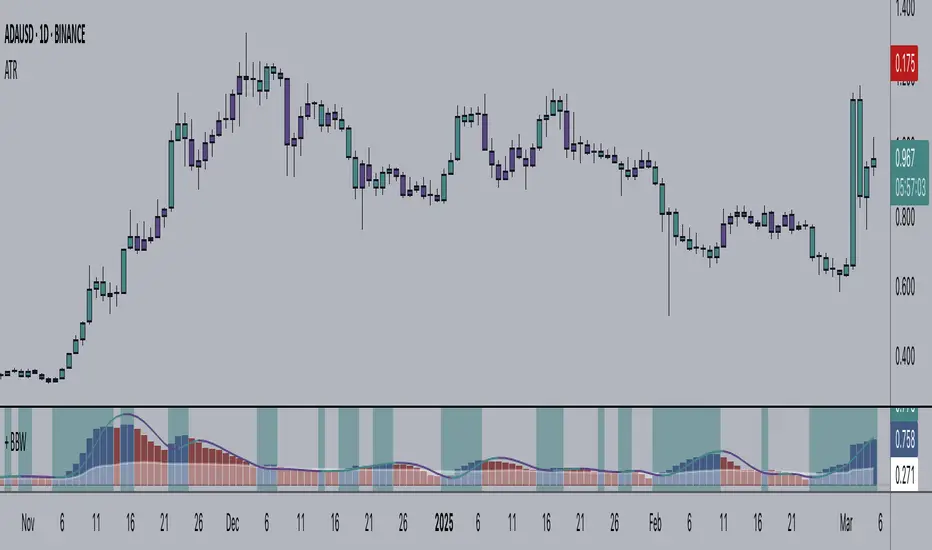
Bollinger Bands Width %bAs the bottom reading of BBW changes dynamically with bull market progression, a relative bottom is preferred than absolute, hence normalization of BB Width via bollinger bands and %b, i.e. distance of datapoints from stdev band.
在腳本中搜尋"弘历投教boll指标代码分析"

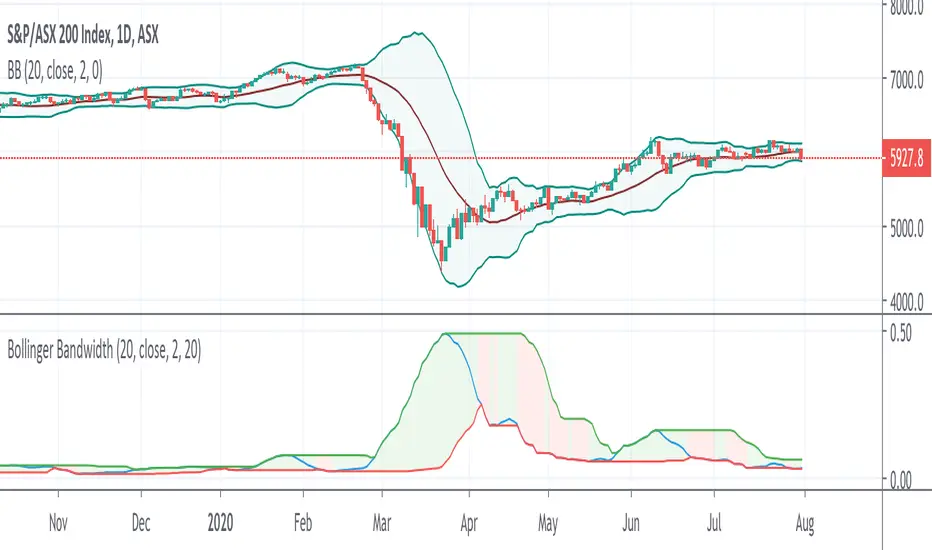
Bollinger Bandwidth - Bulge and squeezeThis is Bollinger bandwidth indicator:
Bandwidth = high-low/main
I have added lowest and highest of N periods to programmatically identify bulge and squeeze. When bandwidth at N periods low, it is in squeeze. If bandwidth at N periods high, it is in bulge.
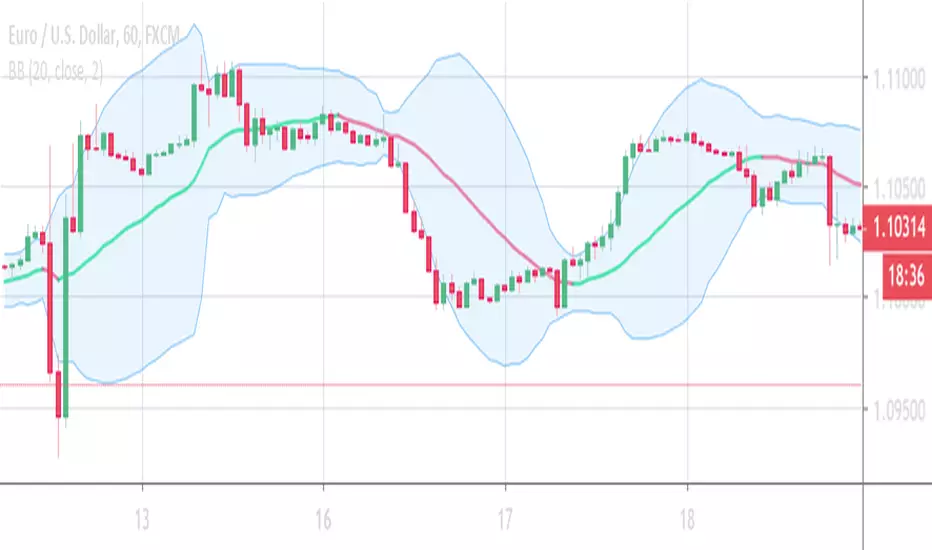
Bollinger Bands Changing ColorOriginal Bollinger Bands but the basis line changes color when the slope is positive or negative
If slope is positive the color is green (or lime)
If slope is negative the color is red
If slope is flat the color is black
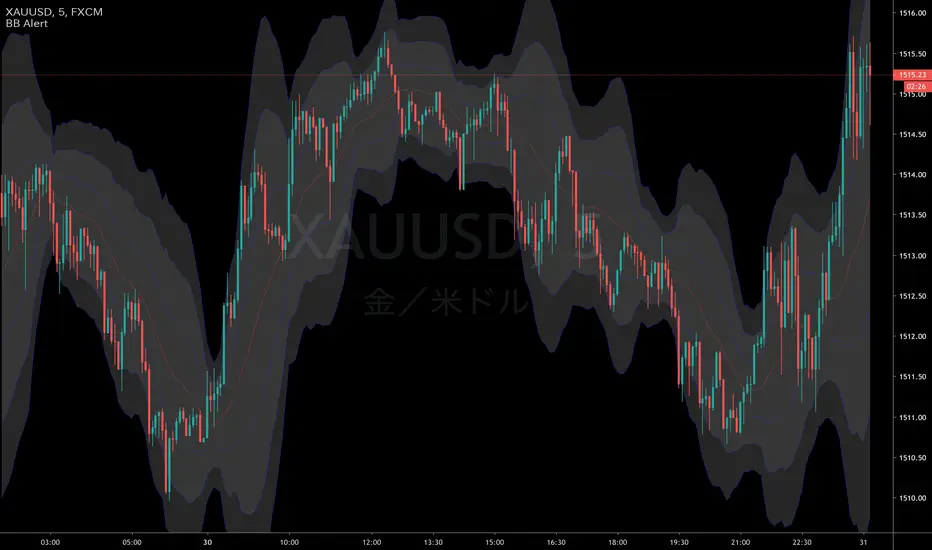
Bollinger Bands with AlertTriple Bollinger Bands with Alert
select BB 1-3
select source outside/inside

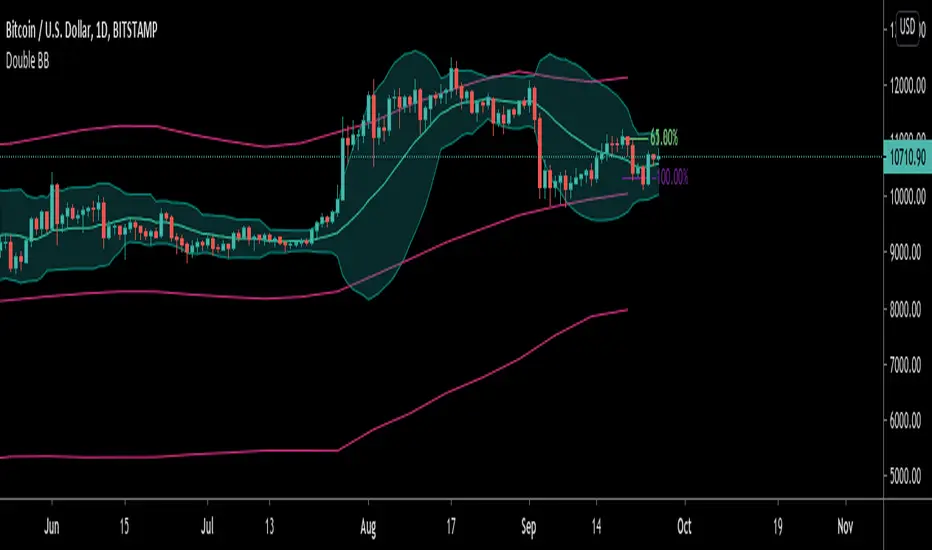
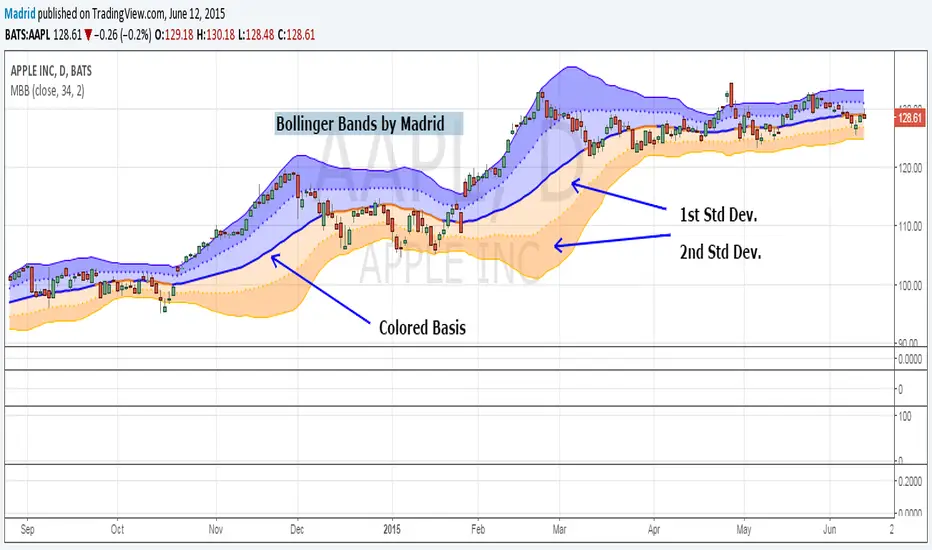
Bollinger BandsThis displays the traditional Bollinger Bands, the difference is that the 1st and 2nd StdDev are outlined with two colors and two different levels, one for each Standard Deviation.
The basis line is colored depending on the direction of the moving average.
Bollinger Bands MTF & Kalman Filter | Flux Charts📈 Multi-Timeframe Kalman Filtered Bollinger Bands Indicator
Introducing our MTF Kalman Filtered Bollinger Bands – a powerful multi-timeframe Bollinger Bands (BB) indicator enhanced with Kalman filtering for superior smoothing and trend analysis. This indicator dynamically adapts Bollinger Bands across multiple timeframes while incorporating volume-based gradient transparency to highlight significant price movements. This indicator is better optimized for lower timeframes.
❓ How to Interpret the Bands & Volume Gradient:
Our indicator combines Lower Timeframe (LTF) and Higher Timeframe (HTF) Bollinger Bands to provide a comprehensive trend analysis. It applies Kalman filtering to the LTF bands, ensuring smoother, noise-reduced signals. The color gradient and relative volume-based transparency offer deeper insights into price strength.
🔹 LTF Bollinger Bands: Shorter-period bands filtered with a Kalman smoothing algorithm, reducing lag and noise.
🔹 HTF Bollinger Bands: Traditional Bollinger Bands plotted on a higher timeframe, offering macro trend analysis.
🔹 Volume Gradient Transparency: The bands adjust their opacity based on relative buy/sell volume, allowing traders to assess momentum strength.
📌 How Does It Work?
1️⃣ Multi-Timeframe Bollinger Bands Calculation
The LTF BB uses Kalman filtering for a smoother price representation, helping to reduce false signals.
The HTF BB is EMA-smoothed for improved trend clarity.
2️⃣ Adaptive Gradient Transparency
The opacity of the fill color between the bands is determined by relative buy/sell volume.
Higher buy volume = stronger bullish signal (greener bands).
Higher sell volume = stronger bearish signal (redder bands).
3️⃣ Dynamic Trend Signals & Breakouts
Buy Signal: When price breaks below the HTF lower band and LTF bands start rising.
Sell Signal: When price breaks above the HTF upper band and LTF bands start falling.
⚙️ Settings & Customization:
🛠 LTF and HTF Bollinger Bands Settings:
Multiplier: The multiplier applied to the BB to determine the upper and lower bands
Length: Define the number of bars determines the BB calculations.
Custom Timeframe Selection: Choose from predefined options (e.g., 5m, 15m, 1H, 4H, etc).
🎨 Gradient & Transparency Settings:
Bullish/Bearish Color Options: Customize colors for uptrend and downtrend conditions.
Max & Min Opacity: Adjust the transparency levels based on volume intensity.
Solid vs. Gradient Mode: Choose between a gradient fill or a solid color mode for clarity.
📌 Recommended Settings for Optimal Use:
1️⃣ Timeframe Selection (LTF -> HTF):
1 min -> 5 min
2 min -> 5 min
3 min -> 15 min
5 min -> 15 min
15 min -> 1 hr
1 hr -> 4 hr
4 hr -> 1 day
2️⃣ Multiplier: Use 2.0 for LTF and 2.25 for HTF
3️⃣Length: Use a length of 20 - 30 bars
🚀 Why Use This Indicator?
✅ Multi-Timeframe Bollinger Bands with Kalman Filtering – Ideal for traders looking for reduced lag and clearer trend signals.
✅ Volume-Based Transparency – See momentum shifts instantly with adaptive opacity.
✅ Dynamic Buy & Sell Signals – Alerts based on price action + volume trends.
✅ Customizable for Any Strategy – Adjust colors, timeframes, and filtering options for personalized trading.

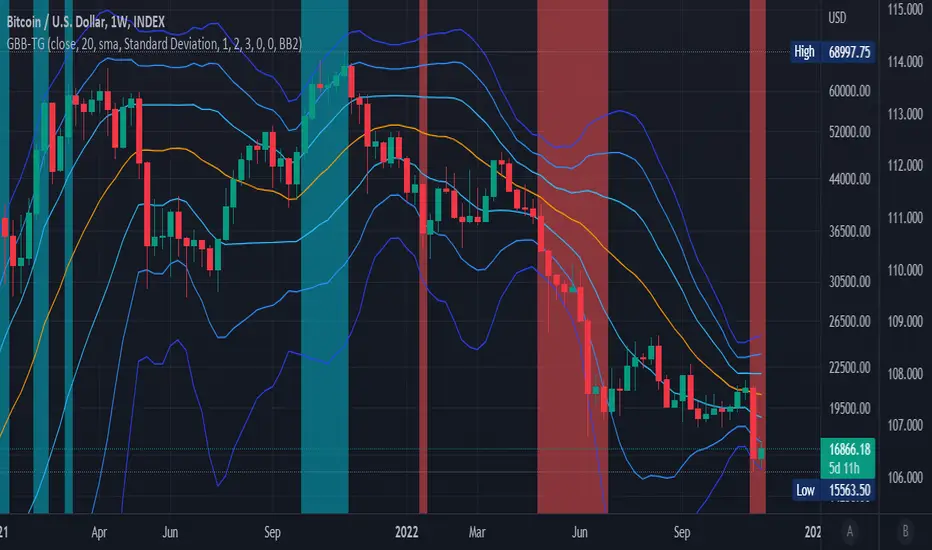
Generalized Bollinger Bands (Tartigradia)Bollinger Band is simply a representation of the rolling average of price and its standard deviation around the average (called the "basis").
This indicator generalizes the Bollinger Band by implementing many different equations to calculate the Bollinger Bands beyond the standard deviation and sma.
Whereas other Bollinger Bands indicators often just change the basis but not the stdev calculation, the correct way to change the basis is to also change it inside the stdev calculation.
Advanced features such as temporal discounting (ie, newer bars can have more weights), median absolute deviation and multiple sigma bands (eg, 3-sigma) are available.
Up to 3 different Bollinger Bands can be displayed, and the background can be highlighted when price is overbought/oversold (beyond the Bollinger Band of choice).
Tip: BB3, which is the bollinger band with standard deviation of 3, which represents 99% of observed values in the lookback period, is a good choice to highlight overbought/oversold conditions.
Usage:
Use it as usual Bollinger Bands, as a measure of volatility, and to setup stop losses.
Use the bandwidth as a measure of volatility: higher is more volatile, lower is less.
When overbought, it can be a good time to sell/short. Use a higher Bollinger Band Multiplier such as 3 or more to reduce false positives.
When oversold, it can be a good time to buy/long. Use a higher Bollinger Band Multiplier such as 3 or more to reduce false positives.
Consider setting a much tighter lookback period of 4 as recommended in backtested works (en.wikipedia.org), use zlma instead of sma, and finally set a higher timeframe for the Bollinger Bands than the one you are currently studying. Then, the Bollinger Bands can help in detecting overbought and oversold regions (price going "out of bands").
Note that I tried to automate the setting of a higher timeframe, but for some reason the output is different when I manually do it using request.security() than when it's in indicator(timeframe=""). If someone has any suggestion as to why it happens, please let me know! (You can try it for yourself by uncommenting the auto_timeframe parameter line).
If you want to plot the indicator in a separate pane, and to also plot %B and bandwidth, I made another indicator "Generalized Bollinger Bands %B and Bandwidth by Tartigradia" that does that.
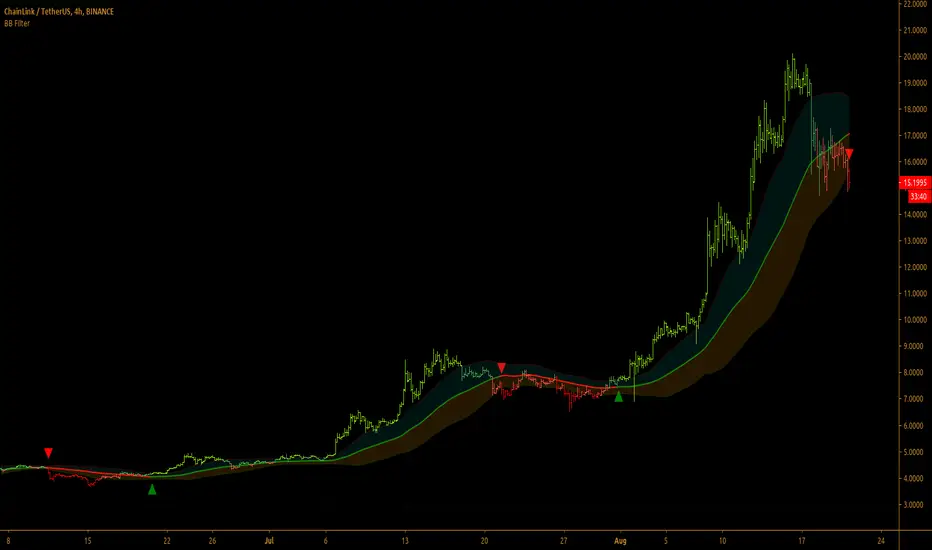
Bollinger Bands Filter
Bollinger Bands is a classic indicator that uses a simple moving average of 20 periods, along with plots of upper and lower bands that are 2 standard deviations away from the basis line. These bands help visualize price volatility and trend based on where the price is, in relation to the bands.
Bollinger Bands filter plots a long signal when price closes above the upper band and plots a short signal when price closes below the lower band. It doesn't take into account any other parameters such as Volume/RSI/ Fundamentals etc, so user must use discretion based on confirmations from another indicator or based on fundamentals.
The filter works great when the price closes above/below upper/lower bands with continuation on next bar. It is definitely useful to have this filter along with other indicators to get early glimpse of breach/fail of bands on candle close during BB squeeze or based on volatility.
This can be used on Heikin Ashi candles for spotting trends, but HA candles are not recommended for trade entries as they don't reflect true price of the asset.
This filter's default is 55 SMA and 1 standard deviation, but these can be changed from settings.
It is definitely worth reading the 22 rules of Bollinger Bands written by John Bollinger.
==================================================================
Note:
1. Alerts can be created for long and short signals using "Once per bar close".
2. The indicator doesn't repaint.
==================================================================
Bollinger Band Volatility Spread VisualizerThis indicator was created to see the total dollar (or whatever currency pair) amount spread between the upper and lower Bollinger Bands. This knowledge of knowing this spread can be used to indicate upcoming periods of high volatility in a market. The fundamental idea behind predicting periods of high volatility is backed up by the idea that periods of low volatility are followed by periods of high volatility and vice versa.
Based on this knowledge, the numerical spread of the Bollinger Bands, as shown in the indicator, we can deduce that when the value is super low, we can expect a period of high volatility AKA: big move incoming.
This indicator is not fully finished because this was my first time coding in Pinescript and I wanted to post the basic indicator first.
My future plans for improving this indicator include:
Adding customization as an option to choose your personal BBands settings that this indicator is based off of
Potentially converting this indicator as a TradingView Strategy where a signal would go off when the spread reaches a certain threshold
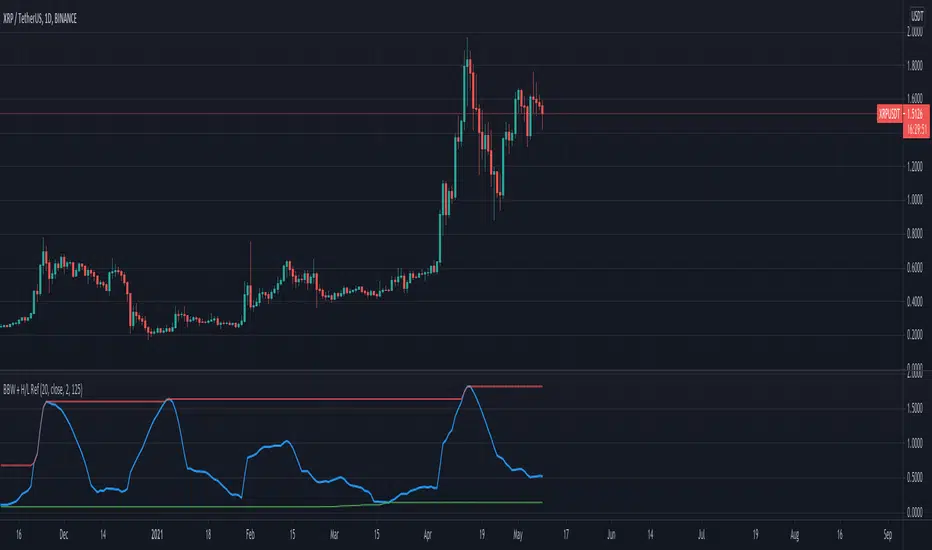
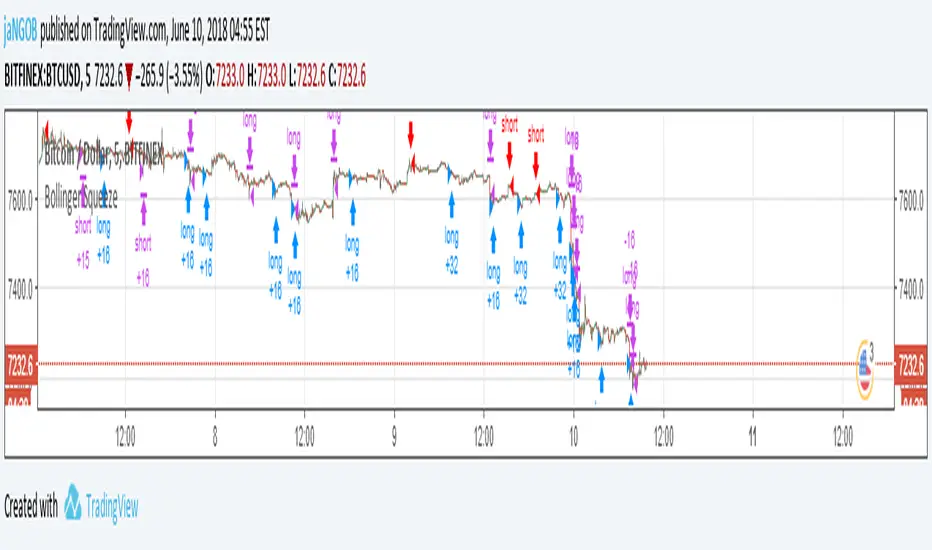
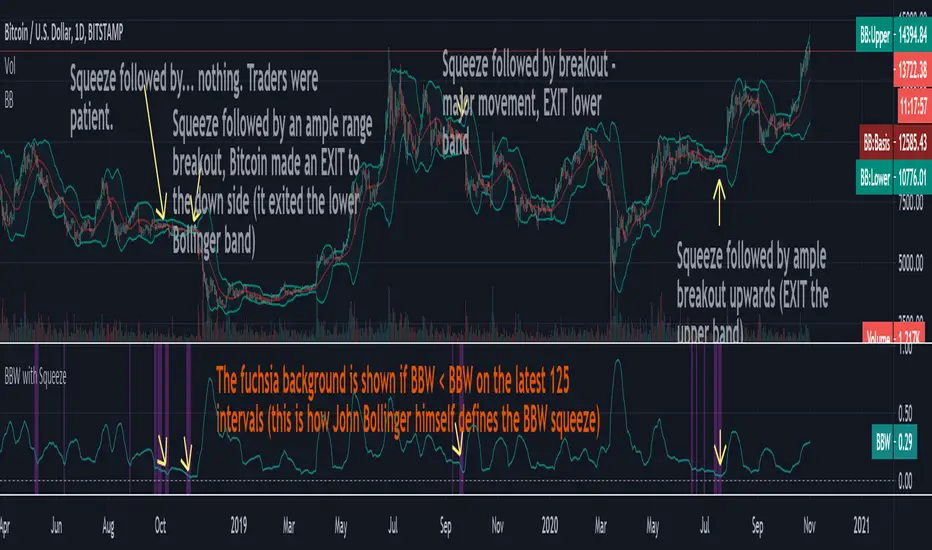
Bollinger Bands Width with Squeeze AlertThis is the standard Bollinger Bands Width (BBW) indicator with the added capability of detecting the "Bollinger Bands Squeeze" as defined by John Bollinger:
The BBW squeeze happens when BBW < all BBWs of the past 125 intervals.
Whenever a BBW squeeze occurs, this means there is low volatility.
A low volatility period is almost always followed by high volatility: a large breakout (with price performing ample movement and exiting the BBW bands) may suddenly occur.
The breakout may be preceded by a fakeout, during which price moves in the opposite direction.

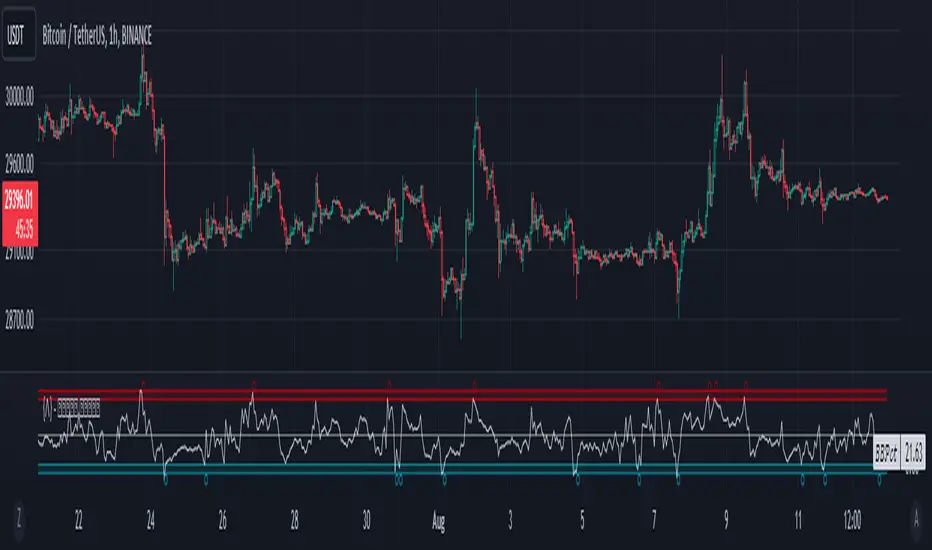
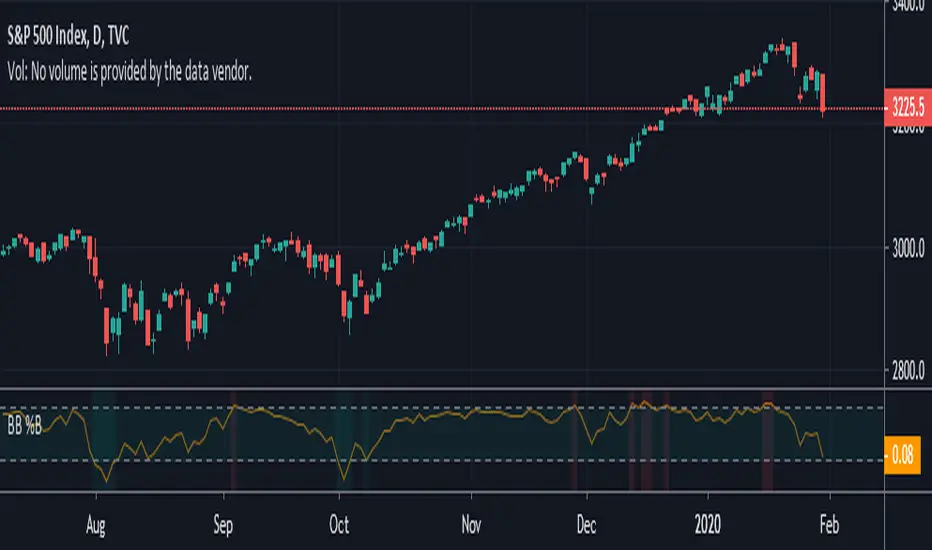
Bollinger Band Percentile SuiteThe Bollinger Band Percentile Suite (𝐵𝐵𝒫𝒸𝓉 𝒮𝓊𝒾𝓉𝑒) is a comprehensive and customizable toolkit built upon the foundation of the %B indicator. The methodology behind this toolkit remains consistent with the original %B indicator, while introducing a host of powerful features to enhance its functionality and adaptability.
Key Features and Customization:
The 𝐵𝐵𝒫𝒸𝓉 offers a wide array of customizable options to suit your trading preferences and strategies. It includes a variety of 14 moving average types that can be chosen as the basis for the Bollinger Band calculation. Additionally, traders have the flexibility to set their upper and lower boundaries for mean reversion detection, allowing for analysis tailored to the user's preference.
Deviation Calculation:
The toolkit provides an option to choose between standard and weighted deviation calculation methods. This added customization ensures that the indicator's behavior aligns with your unique trading style and preferences.
Signals and Reversals:
The 𝐵𝐵𝒫𝒸𝓉 excels in identifying potential overbought and oversold market conditions. It highlights these levels on the chart and marks potential reversal signals with small circles positioned either at the top or bottom of the indicator pane, providing traders with actionable insights.
Trend and Color Coding:
Incorporating a color-coded approach, the BBpct Suite enhances your understanding of market dynamics. It offers bar coloring options based on trend, allowing traders to identify bullish or bearish market conditions as the percentile goes above or below the midline.
Extremities and Reversions:
Recognizing extreme market conditions is crucial for traders. The 𝐵𝐵𝒫𝒸𝓉 includes color-coded indicators for extremities, indicating when the percentile ventures above or below the predefined thresholds. Moreover, it promptly identifies reversions by marking the moment the percentile crosses under the upper threshold (overbought) or over the lower threshold (oversold).
The Bollinger Band Percentile Suite equips traders with a versatile toolkit to gain valuable insights into market overbought and oversold conditions, and potential reversal signals. Its extensive customization options and array of features empower traders to make well-informed decisions based on their unique trading strategies and risk tolerance.
Please note that while the BBpct Suite provides robust analysis, it is advisable to combine its insights with other technical indicators and tools for a comprehensive trading approach.
Example Chart:
+ Bollinger Bands WidthHere is my rendition of Bollinger Bands Width. If you are unfamiliar, Bollinger Bands Width is a measure of the distance between the top and bottom bands of Bollinger Bands. Bollinger Bands themselves being a measure of market volatility, BB Width is a simpler, cleaner way of determining the amount of volatility in the market. Myself, I found the original, basic version of BB Width a bit too basic, and I thought that by adding to it it might make for an improvement for traders over the original.
Simple things that I've done are adding a signal line; adding a 'baseline' using Donchian Channels (such as that which is in my Average Candle Bodies Range indicator); adding bar and background coloring; and adding alerts for increasing volatility, and baseline and signal line crosses. It really ends up making for a much improved version of the basic indicator.
A note on how I created the baseline:
First, what do I mean by 'baseline?' I think of it as an area of the indicator where if the BB Width is below you will not want to enter into any trades, and if the BB Width is above then you are free to enter trades based on your system. It's basically a volatility measure of the volatility indicator. Waddah Attar Explosion is a popular indicator that implements something similar. The baseline is calculated thus: make a Donchian Channel of the BB Width, and then use the basis as the baseline while not plotting the actual highs and lows of the Donchian Channel. Now, the basis of a Donchian Channel is the average of the highs and the lows. If we did that here we would have a baseline much too high, however, by making the basis adjustable with a divisor input it no longer must be plotted in the center of the channel, but may be moved much lower (unless you set the divisor to 2, but you wouldn't do that). This divisor is essentially a sensitivity adjustment for the indicator. Of course you don't have to use the baseline. You could ignore it and only use the signal line, or just use the rising and falling of the BB Width by itself as your volatility measure.
I should make note: the main image above at default settings is an 8 period lookback (so, yes, that is quite fast), and the signal line is a Hull MA set to 13. The background and bar coloring are simply set to the rising and falling of the BB Width. Images below will show some different settings, but definitely play with it yourself to determine if it might be a good fit for your system.
Above, settings are background and bar coloring tuned to BB Width being above the baseline, and also requiring that the BB Width be rising. Background coloring only highlights increasing volatility or volatility above a certain threshold. Grey candles are because the BB Width is above the baseline but falling. We'll see an example without the requirement of BB Width rising, below.
Here, we see that background highlights and aqua candles are more prevalent because I've checked off the requirement that BB Width be rising. The idea is that BB Width is above the baseline therefor there is sufficient volatility to enter trades if our indicators give us the go-ahead.
This here is set to BB Width being above the signal line and also requiring a rising BB Width. Keep in mind the signal line is a Hull MA.
And this fourth and final image uses a volume-weighted MA as the signal line. Bar coloring is turned off, and instead the checkboxes for volatility advancing and declining are turned on under the signal line options. BB Width crosses up the signal line is advancing volatility, while falling below it is declining volatility. Background highlights are set to baseline and not requiring a rising BB Width. This way, with a quick glance you can see if the rising volatility is legitimate, i.e., is the cross up of the signal line coupled with it being above the baseline.
Please enjoy.
Bollinger Bands Strategy with Intraday Intensity IndexFor Educational Purposes. Results can differ on different markets and can fail at any time. Profit is not guaranteed.
This only works in a few markets and in certain situations. Changing the settings can give better or worse results for other markets.
This is a mean reversion strategy based on Bollinger Bands and the Intraday Intensity Index (a volume indicator). John Bollinger mentions that the Intraday Intensity Index can be used with Bollinger Bands and is one of the top indicators he recommends in his book. It seems he prefers it over the other volume indicators that he compares to for some reason. III looks a lot like Chaikin Money Flow but without the denominator in that calculation. On the default settings of the BBs, the III helps give off better entry signals. John Bollinger however is vague on how to use the BBs and it's hard to say if one should enter when it is below/above the bands or when the price crosses them. I find that with many indicators and strategies it's best to wait for a confirmation of some sort, in this case by waiting for some crossover of a band. Like most mean reversion strategies, the exit is very loose if using BBs alone. Usually the plan to exit is when the price finally reverts back to the mean or in this case the middle band. This can potentially lead to huge drawdowns and/or losses. Mean reversion strategies can have high win/loss ratios but can still end up unprofitable because of the huge losses that can occur. These drawdowns/losses that mean reversion strategies suffer from can potentially eat away at a large chunk of all that was previously made or perhaps up to all of it in the worst cases, can occur weeks or perhaps up to months after being profitable trading such a strategy, and will take a while and several trades to make it all back or keep a profitable track record. It is important to have a stop loss, trailing stop, or some sort of stop plan with these types of strategies. For this one, in addition to exiting the trade when price reverts to the middle band, I included a time-based stop plan that exits with a gain or with a loss to avoid potentially large losses, and to exit after only a few periods after taking the trade if in profit instead of waiting for the price to revert back to the mean.

Bollinger Band Breakout Positional Strategy- BN -15M This strategy consists of following criteria:
Buy:
1. Candle should have RSI is above 60 and Close above Bollinger band upper limit
2. Exit When candle is closed below 20MA
Sell:
1. Candle should have RSI is above 40 and Close below Bollinger band lower limit
2. Exit When candle is closed above 20MA
Checkout results.

Bollinger Bands %B with HighlightsThis script highlights the indicator background when the Bollinger Bands are breached making it easier to spot them.
Good for strategies that rely on Bollinger Band breaches
Note: Clean version
Bollinger bands/Lagging span crossHello my dear ambitious traders
I'm working hard this week to publish some great indicators this week and open sourced. Hope you'll enjoy, learn and use them.
This will be my greatest reward but comments showing appreciation are also very welcomed (actually likes too) :)
For today, I'll share a simple indicator but it's coming along with some insightful knowledge ^^
Anyway, I'm not here to ask you to this but to share a very cool indicator I made a few months ago and wanted to share for FREE with the community today
The indicator is related to this educational post : What-a-Bollinger-Bands-Lagging-span-cross-can-tell-us/
This trading technique was invented by Robbytrade, a famous french trader twitter.com
I wanted to have those visual signals on the chart so I coded it.
The advantage of being a developer is that you can litteraly code what you miss and get your life better in the process. The one that will find a way to code a new form of money will be rich... wait.... that guy is called Satoshi Nakamoto...
That's all for me today my friends
PS
Trying to update the Trade Manager shared yesterday with some cool features. More to come in the upcoming days
Enjoy
Dave

Bollinger BarsA partial implementation of Bollinger Bars, as developed by John Bollinger.
This seems to be as close as one can get to true Bollinger Bars with TradingView's current implementation of the Pine language.
It may be possible to complete one day.

Bollinger Bands Strategy - CohenIndicator based on the “Prince of NY” strategy developed by Rodrigo Cohen .
It consists in the use of Bollinger Bands, combined with a coloring rule to indicate places of purchase and sale.
An entry signal is given when a candle close outside the band, where, if the next one closes inside, there is the entrance, looking for the MA or the other band.
Red candle - indicates a sell signal.
Green candle - indicates a buy signal.

Bollinger BandWidth With High/Low ReferencesThis indicator ads option to compare BandWidth accross time. John Bollinger says he uses 125 period.