Dual Stochastic Enhanced (with Presets giua64)Script Title: Dual Stochastic Enhanced (with Presets giua64)
Overview:
This indicator enhances the traditional Dual Stochastic strategy, aiming to provide more filtered and potentially reliable trading signals. By integrating dynamic overbought/oversold levels via Bollinger Bands on the slow stochastic, a trend filter based on a moving average, momentum confirmation via RSI, and user-friendly selectable presets, "Dual Stochastic Enhanced" seeks to offer a more robust approach to identifying potential entry points.
Key Features:
Dual Stochastics: Utilizes a slow stochastic (configurable, e.g., 14 periods) as a context filter and a fast stochastic (configurable, e.g., 5 periods) as a signal trigger.
Bollinger Bands on Slow Stochastic: Instead of fixed overbought/oversold levels (80/20), Bollinger Bands are applied to the %K line of the slow stochastic. This creates dynamic zones that adapt to the stochastic's own volatility.
Trend Filter: A moving average (configurable type and length, e.g., EMA 100 as seen in the example chart for general context) on the price helps filter signals, allowing only trades aligned with the prevailing trend.
RSI Confirmation: An RSI oscillator (configurable length, e.g., 14 periods) is used to confirm momentum. Signals require the RSI to cross certain thresholds to validate the strength of the move.
User Presets: Includes presets for "Scalping," "Intraday," and "Swing trading," which quickly set all key parameters to suit different styles and timeframes. A "Custom" option is also available for full manual configuration.
Clear Visual Signals: Long (green) and Short (red) arrows appear on the chart when all entry conditions are met.
Active Zone Highlighting: The background of the indicator panel changes color (green or red) when "active zone" conditions (a combination of stochastics, trend, and RSI) are favorable.
Information Panel: A table in the top-right corner of the indicator panel displays the current status of the selected preset, trend filter, RSI value, and stochastic levels.
Signal Logic:
A LONG signal is generated when:
The fast stochastic %K crosses above its %D line.
The slow stochastic %K line is below its lower Bollinger Band (dynamic oversold condition).
The fast stochastic %K line is also in a low area (e.g., <25) to confirm the trigger is not premature.
The closing price is above the trend moving average (uptrend).
The RSI is above its long confirmation level (e.g., >40), indicating sufficient bullish momentum.
A SHORT signal is generated when:
The fast stochastic %K crosses below its %D line.
The slow stochastic %K line is above its upper Bollinger Band (dynamic overbought condition).
The fast stochastic %K line is also in a high area (e.g., >75).
The closing price is below the trend moving average (downtrend).
The RSI is below its short confirmation level (e.g., <60), indicating sufficient bearish momentum.
How to Use:
Select a Preset suitable for your trading style and the timeframe you are analyzing (e.g., Scalping for M1-M15, Intraday for M5-H1, Swing for H4-D1).
Alternatively, choose "Custom" and manually adjust all parameters (stochastic lengths, smoothing, Bollinger Bands, Moving Average, RSI, confirmation thresholds).
Observe the Information Panel for a quick understanding of the current conditions.
Evaluate the arrow signals, always considering the broader market context, price action, and any other confluences (supports/resistances, chart patterns).
The background highlighting can help quickly identify periods where conditions are aligned for potential trades.
Disclaimer:
This script is provided for educational and informational purposes only. Trading involves significant risk, and past performance is not indicative of future results. Always thoroughly test any strategy or indicator on historical data and on a demo account before risking real capital. The author assumes no responsibility for any losses incurred from the use of this script.
Author: giua64
在腳本中搜尋"弘历投教boll指标代码分析"

Reversal Trading Bot Strategy[BullByte]Overview :
The indicator Reversal Trading Bot Strategy is crafted to capture potential market reversal points by combining momentum, volatility, and trend alignment filters. It uses a blend of technical indicators to identify both bullish and bearish reversal setups, ensuring that multiple market conditions are met before entering a trade.
Core Components :
Technical Indicators Used :
RSI (Relative Strength Index) :
Purpose : Detects divergence conditions by comparing recent lows/highs in price with the RSI.
Parameter : Length of 8.
Bollinger Bands (BB) :
Purpose : Measures volatility and identifies price levels that are statistically extreme.
Parameter : Length of 20 and a 2-standard deviation multiplier.
ADX (Average Directional Index) & DMI (Directional Movement Index) :
Purpose : Quantifies the strength of the trend. The ADX threshold is set at 20, and additional filters check for the alignment of the directional indicators (DI+ and DI–).
ATR (Average True Range) :
Purpose : Provides a volatility measure used to set stop levels and determine risk through trailing stops.
Volume SMA (Simple Moving Average of Volume ):
Purpose : Helps confirm strength by comparing the current volume against a 20-period average, with an optional filter to ensure volume is at least twice the SMA.
User-Defined Toggle Filters :
Volume Filter : Confirms that the volume is above average (or twice the SMA) before taking trades.
ADX Trend Alignment Filter : Checks that the ADX’s directional indicators support the trade direction.
BB Close Confirmation : Optionally refines the entry by requiring price to be beyond the upper or lower Bollinger Band rather than just above or below.
RSI Divergence Exit : Allows the script to close positions if RSI divergence is detected.
BB Mean Reversion Exit : Closes positions if the price reverts to the Bollinger Bands’ middle line.
Risk/Reward Filter : Ensures that the potential reward is at least twice the risk by comparing the distance to the Bollinger Band with the ATR.
Candle Movement Filter : Optional filter to require a minimum percentage move in the candle to confirm momentum.
ADX Trend Exit : Closes positions if the ADX falls below the threshold and the directional indicators reverse.
Entry Conditions :
Bullish Entry :
RSI Divergence : Checks if the current close is lower than a previous low while the RSI is above the previous low, suggesting bullish divergence.
Bollinger Confirmation : Requires that the price is above the lower (or upper if confirmation is toggled) Bollinger Band.
Volume & Trend Filters : Combines volume condition, ADX strength, and an optional candle momentum condition.
Risk/Reward Check : Validates that the trade meets a favorable risk-to-reward ratio.
Bearish Entry :
Uses a mirror logic of the bullish entry by checking for bearish divergence, ensuring the price is below the appropriate Bollinger level, and confirming volume, trend strength, candle pattern, and risk/reward criteria.
Trade Execution and Exit Strateg y:
Trade Execution :
Upon meeting the entry conditions, the strategy initiates a long or short position.
Stop Loss & Trailing Stops :
A stop-loss is dynamically set using the ATR value, and trailing stops are implemented as a percentage of the close price.
Exit Conditions :
Additional exit filters can trigger early closures based on RSI divergence, mean reversion (via the middle Bollinger Band), or a weakening trend as signaled by ADX falling below its threshold.
This multi-layered exit strategy is designed to lock in gains or minimize losses if the market begins to reverse unexpectedly.
How the Strategy Works in Different Market Conditions :
Trending Markets :
The ADX filter ensures that trades are only taken when the trend is strong. When the market is trending, the directional movement indicators help confirm the momentum, making the reversal signal more reliable.
Ranging Markets :
In choppy markets, the Bollinger Bands expand and contract, while the RSI divergence can highlight potential turning points. The optional filters can be adjusted to avoid false signals in low-volume or low-volatility conditions.
Volatility Management :
With ATR-based stop-losses and a risk/reward filter, the strategy adapts to current market volatility, ensuring that risk is managed consistently.
Recommendation on using this Strategy with a Trading Bot :
This strategy is well-suited for high-frequency trading (HFT) due to its ability to quickly identify reversal setups and execute trades dynamically with automated stop-loss and trailing exits. By integrating this script with a TradingView webhook-based bot or an API-driven execution system, traders can automate trade entries and exits in real-time, reducing manual execution delays and capitalizing on fast market movements.
Disclaimer :
This script is provided for educational and informational purposes only. It is not intended as investment advice. Trading involves significant risk, and you should always conduct your own research and analysis before making any trading decisions. The author is not responsible for any losses incurred while using this script.

Multi-indicator Signal Builder [Skyrexio]Overview
Multi-Indicator Signal Builder is a versatile, all-in-one script designed to streamline your trading workflow by combining multiple popular technical indicators under a single roof. It features a single-entry, single-exit logic, intrabar stop-loss/take-profit handling, an optional time filter, a visually accessible condition table, and a built-in statistics label. Traders can choose any combination of 12+ indicators (RSI, Ultimate Oscillator, Bollinger %B, Moving Averages, ADX, Stochastic, MACD, PSAR, MFI, CCI, Heikin Ashi, and a “TV Screener” placeholder) to form entry or exit conditions. This script aims to simplify strategy creation and analysis, making it a powerful toolkit for technical traders.
Indicators Overview
1. RSI (Relative Strength Index)
Measures recent price changes to evaluate overbought or oversold conditions on a 0–100 scale.
2. Ultimate Oscillator (UO)
Uses weighted averages of three different timeframes, aiming to confirm price momentum while avoiding false divergences.
3. Bollinger %B
Expresses price relative to Bollinger Bands, indicating whether price is near the upper band (overbought) or lower band (oversold).
4. Moving Average (MA)
Smooths price data over a specified period. The script supports both SMA and EMA to help identify trend direction and potential crossovers.
5. ADX (Average Directional Index)
Gauges the strength of a trend (0–100). Higher ADX signals stronger momentum, while lower ADX indicates a weaker trend.
6. Stochastic
Compares a closing price to a price range over a given period to identify momentum shifts and potential reversals.
7. MACD (Moving Average Convergence/Divergence)
Tracks the difference between two EMAs plus a signal line, commonly used to spot momentum flips through crossovers.
8. PSAR (Parabolic SAR)
Plots a trailing stop-and-reverse dot that moves with the trend. Often used to signal potential reversals when price crosses PSAR.
9. MFI (Money Flow Index)
Similar to RSI but incorporates volume data. A reading above 80 can suggest overbought conditions, while below 20 may indicate oversold.
10. CCI (Commodity Channel Index)
Identifies cyclical trends or overbought/oversold levels by comparing current price to an average price over a set timeframe.
11. Heikin Ashi
A type of candlestick charting that filters out market noise. The script uses a streak-based approach (multiple consecutive bullish or bearish bars) to gauge mini-trends.
12. TV Screener
A placeholder condition designed to integrate external buy/sell logic (like a TradingView “Buy” or “Sell” rating). Users can override or reference external signals if desired.
Unique Features
1. Multi-Indicator Entry and Exit
You can selectively enable any subset of 12+ classic indicators, each with customizable parameters and conditions. A position opens only if all enabled entry conditions are met, and it closes only when all enabled exit conditions are satisfied, helping reduce false triggers.
2. Single-Entry / Single-Exit with Intrabar SL/TP
The script supports a single position at a time. Once a position is open, it monitors intrabar to see if the price hits your stop-loss or take-profit levels before the bar closes, making results more realistic for fast-moving markets.
3. Time Window Filter
Users may specify a start/end date range during which trades are allowed, making it convenient to focus on specific market cycles for backtesting or live trading.
4. Condition Table and Statistics
A table at the bottom of the chart lists all active entry/exit indicators. Upon each closed trade, an integrated statistics label displays net profit, total trades, win/loss count, average and median PnL, etc.
5. Seamless Alerts and Automation
Configure alerts in TradingView using “Any alert() function call.”
The script sends JSON alert messages you can route to your own webhook.
The indicator can be integrated with Skyrexio alert bots to automate execution on major cryptocurrency exchanges
6. Optional MA/PSAR Plots
For added visual clarity, optionally plot the chosen moving averages or PSAR on the chart to confirm signals without stacking multiple indicators.
Methodology
1. Multi-Indicator Entry Logic
When multiple entry indicators are enabled (e.g., RSI + Stochastic + MACD), the script requires all signals to align before generating an entry. Each indicator can be set for crossovers, crossunders, thresholds (above/below), etc. This “AND” logic aims to filter out low-confidence triggers.
2. Single-Entry Intrabar SL/TP
One Position At a Time: Once an entry signal triggers, a trade opens at the bar’s close.
Intrabar Checks: Stop-loss and take-profit levels (if enabled) are monitored on every tick. If either is reached, the position closes immediately, without waiting for the bar to end.
3. Exit Logic
All Conditions Must Agree: If the trade is still open (SL/TP not triggered), then all enabled exit indicators must confirm a closure before the script exits on the bar’s close.
4. Time Filter
Optional Trading Window: You can activate a date/time range to constrain entries and exits strictly to that interval.
Justification of Methodology
Indicator Confluence: Combining multiple tools (RSI, MACD, etc.) can reduce noise and false signals.
Intrabar SL/TP: Capturing real-time spikes or dips provides a more precise reflection of typical live trading scenarios.
Single-Entry Model: Straightforward for both manual and automated tracking (especially important in bridging to bots).
Custom Date Range: Helps refine backtesting for specific market conditions or to avoid known irregular data periods.
How to Use
1. Add the Script to Your Chart
In TradingView, open Indicators , search for “Multi-indicator Signal Builder”.
Click to add it to your chart.
2. Configure Inputs
Time Filter: Set a start and end date for trades.
Alerts Messages: Input any JSON or text payload needed by your external service or bot.
Entry Conditions: Enable and configure any indicators (e.g., RSI, MACD) for a confluence-based entry.
Close Conditions: Enable exit indicators, along with optional SL (negative %) and TP (positive %) levels.
3. Set Up Alerts
In TradingView, select “Create Alert” → Condition = “Any alert() function call” → choose this script.
Entry Alert: Triggers on the script’s entry signal.
Close Alert: Triggers on the script’s close signal (or if SL/TP is hit).
Skyrexio Alert Bots: You can route these alerts via webhook to Skyrexio alert bots to automate order execution on major crypto exchanges (or any other supported broker).
4. Visual Reference
A condition table at the bottom summarizes active signals.
Statistics Label updates automatically as trades are closed, showing PnL stats and distribution metrics.
Backtesting Guidelines
Symbol/Timeframe: Works on multiple assets and timeframes; always do thorough testing.
Realistic Costs: Adjust commissions and potential slippage to match typical exchange conditions.
Risk Management: If using the built-in stop-loss/take-profit, set percentages that reflect your personal risk tolerance.
Longer Test Horizons: Verify performance across diverse market cycles to gauge reliability.
Example of statistic calculation
Test Period: 2023-01-01 to 2025-12-31
Initial Capital: $1,000
Commission: 0.1%, Slippage ~5 ticks
Trade Count: 468 (varies by strategy conditions)
Win rate: 76% (varies by strategy conditions)
Net Profit: +96.17% (varies by strategy conditions)
Disclaimer
This indicator is provided strictly for informational and educational purposes .
It does not constitute financial or trading advice.
Past performance never guarantees future results.
Always test thoroughly in demo environments before using real capital.
Enjoy exploring the Multi-Indicator Signal Builder! Experiment with different indicator combinations and adjust parameters to align with your trading preferences, whether you trade manually or link your alerts to external automation services. Happy trading and stay safe!

Forex Pair Yield Momentum This Pine Script strategy leverages yield differentials between the 2-year government bond yields of two countries to trade Forex pairs. Yield spreads are widely regarded as a fundamental driver of currency movements, as highlighted by international finance theories like the Interest Rate Parity (IRP), which suggests that currencies with higher yields tend to appreciate due to increased capital flows:
1. Dynamic Yield Spread Calculation:
• The strategy dynamically calculates the yield spread (yield_a - yield_b) for the chosen Forex pair.
• Example: For GBP/USD, the spread equals US 2Y Yield - UK 2Y Yield.
2. Momentum Analysis via Bollinger Bands:
• Yield momentum is computed as the difference between the current spread and its moving
Bollinger Bands are applied to identify extreme deviations:
• Long Entry: When momentum crosses below the lower band.
• Short Entry: When momentum crosses above the upper band.
3. Reversal Logic:
• An optional checkbox reverses the trading logic, allowing long trades at the upper band and short trades at the lower band, accommodating different market conditions.
4. Trade Management:
• Positions are held for a predefined number of bars (hold_periods), and each trade uses a fixed contract size of 100 with a starting capital of $20,000.
Theoretical Basis:
1. Yield Differentials and Currency Movements:
• Empirical studies, such as Clarida et al. (2009), confirm that interest rate differentials significantly impact exchange rate dynamics, especially in carry trade strategies .
• Higher-yields tend to appreciate against lower-yielding currencies due to speculative flows and demand for higher returns.
2. Bollinger Bands for Momentum:
• Bollinger Bands effectively capture deviations in yield momentum, identifying opportunities where price returns to equilibrium (mean reversion) or extends in trend-following scenarios (momentum breakout).
• As Bollinger (2001) emphasized, this tool adapts to market volatility by dynamically adjusting thresholds .
References:
1. Dornbusch, R. (1976). Expectations and Exchange Rate Dynamics. Journal of Political Economy.
2. Obstfeld, M., & Rogoff, K. (1996). Foundations of International Macroeconomics.
3. Clarida, R., Davis, J., & Pedersen, N. (2009). Currency Carry Trade Regimes. NBER.
4. Bollinger, J. (2001). Bollinger on Bollinger Bands.
5. Mendelsohn, L. B. (2006). Forex Trading Using Intermarket Analysis.

Williams BBDiv Signal [trade_lexx]📈 Williams BBDiv Signal — Improve your trading strategy with accurate signals!
Introducing Williams BBDiv Signal , an advanced trading indicator designed for a comprehensive analysis of market conditions. This indicator combines Williams%R with Bollinger Bands, providing traders with a powerful tool for generating buy and sell signals, as well as detecting divergences. It is ideal for traders who need an advantage in detecting changing trends and market conditions.
🔍 How signals work
— A buy signal is generated when the Williams %R line crosses the lower Bollinger Bands band from bottom to top. This indicates that the market may be oversold and ready for a rebound. They are displayed as green triangles located under the Williams %R graph. On the main chart, buy signals are displayed as green triangles labeled "Buy" under candlesticks.
— A sell signal is generated when the Williams %R line crosses the upper Bollinger Bands band from top to bottom. This indicates that the market may be overbought and ready for a correction. They are displayed as red triangles located above the Williams %R chart. On the main chart, the sell signals are displayed as red triangles with the word "Sell" above the candlesticks.
— Minimum Bars Between Signals
The user can adjust the minimum number of bars between the signals to avoid false signals. This helps to filter out noise and improve signal quality.
— Mode "Wait for Opposite Signal"
In this mode, buy and sell signals are generated only after receiving the opposite signal. This adds an additional level of filtering and helps to avoid false alarms.
— Mode "Overbought and Oversold Zones"
A buy signal is generated only when Williams %R is below the -80 level (Lower Band). A sell signal is generated only when Williams %R is above -20 (Upper Band).
📊 Divergences
— Bullish divergence occurs when Williams%R shows a higher low while price shows a lower low. This indicates a possible upward reversal. They are displayed as green lines and labels labeled "Bull" on the Williams %R chart. On the main chart, bullish divergences are displayed as green triangles labeled "Bull" under candlesticks.
— A bearish divergence occurs when Williams %R shows a lower high, while the price shows a higher high. This indicates a possible downward reversal. They are displayed as red lines and labels labeled "Bear" on the Williams %R chart. On the main chart, bearish divergences are displayed as red triangles with the word "Bear" above the candlesticks.
— 🔌Connector Signal🔌 and 🔌Connector Divergence🔌
It allows you to connect the indicator to trading strategies and test signals throughout the trading history. This makes the indicator an even more powerful tool for traders who want to test the effectiveness of their strategies on historical data.
🔔 Alerts
The indicator provides the ability to set up alerts for buy and sell signals, as well as for divergences. This allows traders to keep abreast of important market developments without having to constantly monitor the chart.
🎨 Customizable Appearance
Customize the appearance of Williams BBDiv Signal according to your preferences to make the analysis more convenient and visually pleasing. In the indicator settings section, you can change the colors of the buy and sell signals, as well as divergences, so that they stand out on the chart and are easily visible.
🔧 How it works
— The indicator starts by calculating the Williams %R and Bollinger Bands values for a certain period to assess market conditions. Initial assumptions are introduced for overbought and oversold levels, as well as for the standard deviation of the Bollinger Bands. The indicator then analyzes these values to generate buy and sell signals. This classification helps to determine the appropriate level of volatility for signal calculation. As the market evolves, the indicator dynamically adjusts, providing information about the trend and volatility in real time.
Quick Guide to Using Williams BBDiv Signal
— Add the indicator to your favorites by clicking on the star icon. Adjust the parameters, such as the period length for Williams %R, the type of moving average and the standard deviation for Bollinger Bands, according to your trading style. Or leave all the default settings.
— Adjust the signal filters to improve the quality of the signals and avoid false alarms, adjust the filters in the "Signal Settings" section.
— Turn on alerts so that you don't miss important trading opportunities and don't constantly sit at the chart, set up alerts for buy and sell signals, as well as for divergences. This will allow you to keep abreast of all key market developments and respond to them in a timely manner, without being distracted from other business.
— Use signals. They will help you determine the optimal entry and exit points for your positions. Also, pay attention to bullish and bearish divergences, which may indicate possible market reversals and provide additional trading opportunities.
— Use the 🔌Connector🔌 for deeper analysis and verification of the effectiveness of signals, connect it to your trading strategies. This will allow you to test signals throughout the trading history and evaluate their accuracy based on historical data. Include the indicator in your trading strategy and run testing to see how buy and sell signals have worked in the past. Analyze the test results to determine how reliable the signals are and how they can improve your trading strategy. This will help you make better informed decisions and increase your trading efficiency.

VIDYA ProTrend Multi-Tier ProfitHello! This time is about a trend-following system.
VIDYA is quite an interesting indicator that adjusts dynamically to market volatility, making it more responsive to price changes compared to traditional moving averages. Balancing adaptability and precision, especially with the more aggressive short trade settings, challenged me to fine-tune the strategy for a variety of market conditions.
█ Introduction and How it is Different
The "VIDYA ProTrend Multi-Tier Profit" strategy is a trend-following system that combines the VIDYA (Variable Index Dynamic Average) indicator with Bollinger Bands and a multi-step take-profit mechanism.
Unlike traditional trend strategies, this system allows for more adaptive profit-taking, adjusting for long and short positions through distinct ATR-based and percentage-based targets. The innovation lies in its dynamic multi-tier approach to profit-taking, especially for short trades, where more aggressive percentages are applied using a multiplier. This flexibility helps adapt to various market conditions by optimizing trade management and profit allocation based on market volatility and trend strength.
BTCUSD 6hr performance
█ Strategy, How it Works: Detailed Explanation
The core of the "VIDYA ProTrend Multi-Tier Profit" strategy lies in the dual VIDYA indicators (fast and slow) that analyze price trends while accounting for market volatility. These indicators work alongside Bollinger Bands to filter trade entries and exits.
🔶 VIDYA Calculation
The VIDYA indicator is calculated using the following formula:
Smoothing factor (𝛼):
alpha = 2 / (Length + 1)
VIDYA formula:
VIDYA(t) = alpha * k * Price(t) + (1 - alpha * k) * VIDYA(t-1)
Where:
k = |Chande Momentum Oscillator (MO)| / 100
🔶 Bollinger Bands as a Volatility Filter
Bollinger Bands are calculated using a rolling mean and standard deviation of price over a specified period:
Upper Band:
BB_upper = MA + (K * stddev)
Lower Band:
BB_lower = MA - (K * stddev)
Where:
MA is the moving average,
K is the multiplier (typically 2), and
stddev is the standard deviation of price over the Bollinger Bands length.
These bands serve as volatility filters to identify potential overbought or oversold conditions, aiding in the entry and exit logic.
🔶 Slope Calculation for VIDYA
The slopes of both fast and slow VIDYAs are computed to assess the momentum and direction of the trend. The slope for a given VIDYA over its length is:
Slope = (VIDYA(t) - VIDYA(t-n)) / n
Where:
n is the length of the lookback period. Positive slope indicates bullish momentum, while negative slope signals bearish momentum.
LOCAL picture
🔶 Entry and Exit Conditions
- Long Entry: Occurs when the price moves above the slow VIDYA and the fast VIDYA is trending upward. Bollinger Bands confirm the signal when the price crosses the upper band, indicating bullish strength.
- Short Entry: Happens when the price drops below the slow VIDYA and the fast VIDYA trends downward. The signal is confirmed when the price crosses the lower Bollinger Band, showing bearish momentum.
- Exit: Based on VIDYA slopes flattening or reversing, or when the price hits specific ATR or percentage-based profit targets.
🔶 Multi-Step Take Profit Mechanism
The strategy incorporates three levels of take profit for both long and short trades:
- ATR-based Take Profit: Each step applies a multiple of the ATR (Average True Range) to the entry price to define the exit point.
The first level of take profit (long):
TP_ATR1_long = Entry Price + (2.618 * ATR)
etc.
█ Trade Direction
The strategy offers flexibility in defining the trading direction:
- Long: Only long trades are considered based on the criteria for upward trends.
- Short: Only short trades are initiated in bearish trends.
- Both: The strategy can take both long and short trades depending on the market conditions.
█ Usage
To use the strategy effectively:
- Adjust the VIDYA lengths (fast and slow) based on your preference for trend sensitivity.
- Use Bollinger Bands as a filter for identifying potential breakout or reversal scenarios.
- Enable the multi-step take profit feature to manage positions dynamically, allowing for partial exits as the price reaches specified ATR or percentage levels.
- Leverage the short trade multiplier for more aggressive take profit levels in bearish markets.
This strategy can be applied to different asset classes, including equities, forex, and cryptocurrencies. Adjust the input parameters to suit the volatility and characteristics of the asset being traded.
█ Default Settings
The default settings for this strategy have been designed for moderate to trending markets:
- Fast VIDYA Length (10): A shorter length for quick responsiveness to price changes. Increasing this length will reduce noise but may delay signals.
- Slow VIDYA Length (30): The slow VIDYA is set longer to capture broader market trends. Shortening this value will make the system more reactive to smaller price swings.
- Minimum Slope Threshold (0.05): This threshold helps filter out weak trends. Lowering the threshold will result in more trades, while raising it will restrict trades to stronger trends.
Multi-Step Take Profit Settings
- ATR Multipliers (2.618, 5.0, 10.0): These values define how far the price should move before taking profit. Larger multipliers widen the profit-taking levels, aiming for larger trend moves. In higher volatility markets, these values might be adjusted downwards.
- Percentage Levels (3%, 8%, 17%): These percentage levels define how much the price must move before taking profit. Increasing the percentages will capture larger moves, while smaller percentages offer quicker exits.
- Short TP Multiplier (1.5): This multiplier applies more aggressive take profit levels for short trades. Adjust this value based on the aggressiveness of your short trade management.
Each of these settings directly impacts the performance and risk profile of the strategy. Shorter VIDYA lengths and lower slope thresholds will generate more trades but may result in more whipsaws. Higher ATR multipliers or percentage levels can delay profit-taking, aiming for larger trends but risking partial gains if the trend reverses too early.

Multi-timeframe 24 moving averages + BB+SAR+Supertrend+VWAP █ OVERVIEW
The script allows to display up to 24 moving averages ("MA"'s) across 5 timeframes plus two bands (Bollinger Bands or Supertrend or Parabolic SAR or VWAP bands) each from its own timeframe.
The main difference of this script from many similar ones is the flexibility of its settings:
- Bulk enable/disable and/or change properties of several MAs at once.
- Save 3 of your frequently used templates as presets using CSV text configurations.
█ HOW TO USE
Some use examples:
In order to "show 31, 50, 200 EMAs and 20, 100, 200 SMAs for each of 1H, 4H, D, W, M timeframes using blue for short MA, yellow for mid MA and red for long MA" use the settings as shown on a screenshot below.
In order to "Show a band of chart timeframe MA's of lengths 5, 8, 13, 21, 34, 55, 100 and 200 plus some 1H, 4H, D and W MAs. Be able to quickly switch off the band of chart tf's MAs. For chart timeframe MA's only show labels for 21, 100 and 200 EMAs". You can set TF1 and TF2 to chart's TF and set you fib MAs there and configure fixed higher timeframe MAs using TF3, TF4 and TF5 (e.g. using 1H, D and W timeframes and using 1H 800 in place of 4H 200 MA). However, quicker way may be using CSV - the syntax is very simple and intuitive, see Preset 2 as it comes in the script. You can easily switch chart tf's band of MAs by toggling on/off your chart timeframe TF's (in our example, TF1 and TF2).
The settings are either obvious or explained in tooltips.
Note 1: When using group settings and CSV presets do not forget that individual setting affected will no have any effect. So, if some setting does not work, check whether it is overridden with some group setting or a CSV preset.
Note 2: Sometimes you can notice parts of MA's hanging in the air, not lasting up to the last bar. This is not a bug as explained on this screenshot:
█ FOR DEVELOPERS
The script is a use case of my CSVParser library, which in turn uses Autotable library, both of which I hope will be quite helpful. Autotable is so powerful and comprehensive that you will hardly ever wish to use normal table functions again for complex tables.
The indicator was inspired by Pablo Limonetti's url=https://www.tradingview.com/script/nFs56VUZ/]Multi Timeframe Moving Averages and Raging @RagingRocketBull's # Multi SMA EMA WMA HMA BB (5x8 MAs Bollinger Bands) MAX MTF - RRB

Uptrick: Market MoodsThe "Uptrick: Market Moods" indicator is an advanced technical analysis tool designed for the TradingView platform. It combines three powerful indicators—Relative Strength Index (RSI), Average True Range (ATR), and Bollinger Bands—into one cohesive framework, aimed at helping traders better understand and interpret market sentiment. By capturing shifts in the emotional climate of the market, it provides a holistic view of market conditions, which can range from calm to stressed or even highly excited. This multi-dimensional analysis tool stands apart from traditional single-indicator approaches by offering a more complete picture of market dynamics, making it a valuable resource for traders looking to anticipate and react to changes in market behavior.
The RSI in the "Uptrick: Market Moods" indicator is used to measure momentum. RSI is an essential component of many technical analysis strategies, and in this tool, it is used to identify potential market extremes. When RSI values are high, they indicate an overbought condition, meaning the market may be approaching a peak. Conversely, low RSI values suggest an oversold condition, signaling that the market could be nearing a bottom. These extremes provide crucial clues about shifts in market sentiment, helping traders gauge whether the current emotional state of the market is likely to result in a reversal. This understanding is pivotal in predicting whether the market is transitioning from calm to stressed or from excited to overbought.
The Average True Range adds another layer to this analysis by offering insights into market volatility. Volatility is a key factor in understanding the mood of the market, as periods of high volatility often reflect high levels of excitement or stress, while low volatility typically indicates a calm, steady market. ATR is calculated based on the range of price movements over a given period, and the higher the value, the more volatile the market is. The "Uptrick: Market Moods" indicator uses ATR to dynamically gauge volatility levels, helping traders understand whether the market is currently moving in a way that aligns with its emotional mood. For example, an increase in ATR accompanied by an RSI value that indicates overbought conditions could suggest that the market is in a highly excited state, with the potential for either strong momentum continuation or a sharp reversal.
Bollinger Bands complement these tools by providing visual cues about price volatility and the range within which the market is likely to move. Bollinger Bands plot two standard deviations away from a simple moving average of the price. This banding technique helps traders visualize how far the price is likely to deviate from its average over a certain period. The "Uptrick: Market Moods" indicator uses Bollinger Bands to establish price boundaries and identify breakout conditions. When prices break above the upper band or below the lower band, it often signals that the market is either highly stressed or excited. This breakout condition serves as a visual representation of the market mood, alerting traders to moments when prices are moving beyond typical ranges and when significant emotional shifts are occurring in the market.
Technically, the "Uptrick: Market Moods" indicator has been developed using TradingView’s Pine Script language, a highly efficient language for building custom indicators. It employs functions like ta.rsi, ta.atr, and ta.sma to perform the necessary calculations. The use of these built-in functions ensures that the calculations are both accurate and efficient, allowing the indicator to operate in real-time without lagging, even in volatile market conditions. The ta.rsi function is used to compute the Relative Strength Index, while ta.atr calculates the Average True Range, and ta.sma is used to smooth out price data for the Bollinger Bands. These functions are applied dynamically within the script, allowing the "Uptrick: Market Moods" indicator to respond to changes in market conditions in real time.
The user interface of the "Uptrick: Market Moods" indicator is designed to provide a visually intuitive experience. The market mood is color-coded on the chart, making it easy for traders to identify whether the market is calm, stressed, or excited at a glance. This feature is especially useful for traders who need to make quick decisions in fast-moving markets. Additionally, the indicator includes an interactive table that updates in real-time, showing the most recent mood state and its frequency. This provides valuable statistical insights into market behavior over specific time frames, helping traders track the dominant emotional state of the market. Whether the market is in a prolonged calm state or rapidly transitioning through moods, this real-time feedback offers actionable data that can help traders adjust their strategies accordingly.
The RSI component of the "Uptrick: Market Moods" indicator helps detect the speed and direction of price movements, offering insight into whether the market is approaching extreme conditions. By providing signals based on overbought and oversold levels, the RSI helps traders decide whether to enter or exit positions. The ATR element acts as a volatility gauge, dynamically adjusting traders’ expectations in response to changes in market volatility. Meanwhile, the Bollinger Bands help identify trends and potential breakout conditions, serving as an additional confirmation tool that highlights when the price has moved beyond normal boundaries, indicating heightened market excitement or stress.
Despite the robust capabilities of the "Uptrick: Market Moods" indicator, it does have limitations. In markets affected by sudden shifts, such as those driven by major news events or external economic factors, the indicator’s performance may not always be reliable. These external factors can cause rapid mood swings that are difficult for any technical analysis tool to fully anticipate. Additionally, the indicator’s complexity may pose a learning curve for novice traders, particularly those who are unfamiliar with the concepts of RSI, ATR, and Bollinger Bands. However, with practice, traders can become proficient in using the tool to its full potential, leveraging the insights it provides to better navigate market shifts.
For traders seeking a deeper understanding of market sentiment, the "Uptrick: Market Moods" indicator is an invaluable resource. It is recommended for those dealing with medium to high volatility instruments, where understanding emotional shifts can offer a strategic advantage. While it can be used on its own, integrating it with other forms of analysis, such as fundamental analysis and additional technical indicators, can enhance its effectiveness. By confirming signals with other tools, traders can reduce the likelihood of false signals and improve their overall trading strategy.
To further enhance the accuracy of the "Uptrick: Market Moods" indicator, it can be integrated with volume-based tools like Volume Profile or On-Balance Volume (OBV). This combination allows traders to confirm the moods identified by the indicator with volume data, providing additional confirmation of market sentiment. For example, when the market is in an excited mood, an increase in trading volume could reinforce the reliability of that signal. Conversely, if the market is stressed but volume remains low, traders may want to proceed with caution. Using multiple indicators together creates a more comprehensive trading approach, helping traders better manage risk and make informed decisions based on multiple data points.
In conclusion, the "Uptrick: Market Moods" indicator is a powerful and unique addition to the suite of technical analysis tools available on TradingView. It provides traders with a multi-dimensional view of market sentiment by combining the analytical strengths of RSI, ATR, and Bollinger Bands into a single tool. Its ability to capture and interpret the emotional mood of the market makes it an essential tool for traders seeking to gain an edge in understanding market behavior. While the indicator has certain limitations, particularly in rapidly shifting markets, its ability to provide real-time insights into market sentiment is a valuable asset for traders of all experience levels. Used in conjunction with other tools and sound trading practices, the "Uptrick: Market Moods" indicator offers a comprehensive solution for navigating the complexities of financial markets.

Supertrend + BB + Consecutive Candles + QQE + EMA [Pineify]Overview
This indicator, developed by Pineify, is a comprehensive tool designed to assist traders in making informed decisions by combining multiple technical analysis methods. It integrates Supertrend, Bollinger Bands (BB), Consecutive Candles, Quantitative Qualitative Estimation (QQE), and Exponential Moving Averages (EMA) into a single, cohesive script. This multi-faceted approach allows traders to analyze market trends, volatility, and potential buy/sell signals with greater accuracy.
Key Features
1. Supertrend: Utilizes the Supertrend indicator to identify the prevailing market trend. It provides clear buy and sell signals based on the direction of the trend.
2. Bollinger Bands (BB): Measures market volatility and identifies overbought or oversold conditions. The script calculates the middle, upper, and lower bands, along with the Bollinger Band Width (BBW) and Bollinger Band %B (BBR).
3. Consecutive Candles: Detects sequences of consecutive bullish or bearish candles, providing signals when a specified number of consecutive candles are detected.
4. Quantitative Qualitative Estimation (QQE): Combines the Relative Strength Index (RSI) with a smoothing factor to generate buy and sell signals based on the QQE methodology.
5. Exponential Moving Averages (EMA): Includes both fast and slow EMAs to identify potential crossovers, which are used as buy and sell signals.
How It Works
- Supertrend: The Supertrend indicator is calculated using a factor and ATR length. It plots the trend direction and generates buy/sell signals when the trend changes.
- Bollinger Bands: The BB indicator calculates the middle band as a Simple Moving Average (SMA) of the closing prices. The upper and lower bands are derived by adding and subtracting a multiple of the standard deviation from the middle band.
- Consecutive Candles: This feature counts the number of consecutive candles that close higher or lower than the previous candle. When the count reaches a specified threshold, it generates a buy or sell signal.
- QQE: The QQE indicator smooths the RSI values and calculates the QQE Fast and QQE Slow lines. Buy and sell signals are generated based on the crossover of these lines.
- EMA: The script calculates fast and slow EMAs and generates buy/sell signals based on their crossovers.
How to Use
1. Inputs: Customize the indicator settings through the input parameters:
- Supertrend Factor and ATR Length
- BB Length
- Consecutive Candles Counting
- QQE RSI Length
- Fast and Slow EMA Lengths
- Enable/Disable Alerts for various signals
2. Alerts: Set up alerts for Supertrend, Consecutive Candles, and EMA crossovers. Alerts can be enabled or disabled based on user preference.
3. Visualization: The indicator plots the Supertrend, Bollinger Bands, and EMA lines on the chart. It also marks buy and sell signals with arrows and labels for easy identification.
Concepts Underlying Calculations
- Supertrend: Based on the Average True Range (ATR) to determine the trend direction and potential reversal points.
- Bollinger Bands: Utilizes standard deviation to measure market volatility and identify overbought/oversold conditions.
- Consecutive Candles: A method to detect momentum by counting consecutive bullish or bearish candles.
- QQE: Enhances the traditional RSI by smoothing it and using a dynamic threshold to generate signals.
- EMA: A widely used moving average that gives more weight to recent prices, making it responsive to market changes.
This indicator is a powerful tool for traders looking to combine multiple technical analysis methods into a single, easy-to-use script. By integrating these diverse techniques, it provides a comprehensive view of market conditions and potential trading opportunities.

Enhanced Reversal DetectionScript Description:
The "Enhanced Reversal Detection" indicator is a powerful tool designed to identify potential market reversals across various financial instruments. It incorporates a sophisticated algorithm that analyzes price action along with key technical indicators such as the Relative Strength Index (RSI), Bollinger Bands, and Moving Average (MA).
How to Use:
Adjustable Parameters: The indicator offers a range of adjustable parameters to cater to different trading preferences and market conditions.
RSI Length: Adjusts the length of the RSI calculation to fine-tune sensitivity.
Overbought Level: Sets the threshold for identifying overbought conditions on the RSI scale.
Oversold Level: Sets the threshold for identifying oversold conditions on the RSI scale.
Bollinger Bands Length: Determines the length of the Bollinger Bands calculation.
Bollinger Bands Multiplier: Adjusts the standard deviation multiplier for the Bollinger Bands, influencing band width.
Moving Average Length: Defines the length of the Moving Average calculation to capture trend direction.
Min Bars Between Signals: Sets the minimum number of bars required between consecutive reversal signals.
ADX Length: Adjusts the length of the Average Directional Index (ADX) calculation.
ADX Threshold: Defines the threshold value for ADX, serving as a filter for reversal signals.
Signal Generation: The indicator generates signals for both bullish and bearish reversals based on predefined criteria. A bullish reversal signal is triggered when the closing price exceeds the lower Bollinger Band and RSI falls below the oversold threshold. Conversely, a bearish reversal signal occurs when the closing price falls below the upper Bollinger Band and RSI surpasses the overbought threshold.
Alerts: Traders can opt to receive alerts for bullish and bearish reversal signals, enabling them to stay informed of potential trading opportunities even when away from the platform.
Publication Readiness:
To ensure readiness for publication in the TradingView public library, the script has been meticulously crafted and documented:
The code is extensively commented to provide clear explanations of parameters, calculations, and signal generation logic.
Best coding practices have been followed to enhance readability and maintainability.
Rigorous testing has been conducted to validate the accuracy and reliability of signal generation across various market conditions.
The script adheres to TradingView's guidelines and policies for script publication, ensuring compliance with platform standards and user expectations.
With its comprehensive features and user-friendly design, the "Enhanced Reversal Detection" indicator is poised to become a valuable asset for traders seeking to identify high-probability reversal opportunities in the financial markets.

TrendVista Swing IndicatorOverview
The swing indicator is designed to offer traders a comprehensive analysis of market trends and volatility by integrating Bollinger Bands and the Average True Range (ATR). It aids in the visualization of price movements and volatility across multiple time frames, thereby providing insights into potential buy and sell opportunities.
Key Features
- Multitimeframe Analysis : By default, the indicator examines the market across the following time frames: 1 Day (1D), 4 Hours (4H), 1 Hour (1H), and 15 Minutes (15min). Users have the flexibility to modify these time frames to suit their trading strategy by adjusting the indicator's settings.
- Buy and Sell Timings : The indicator identifies optimal buy signals when the price drops below the lower Bollinger Band and subsequently re-enters the band's range. Additionally, a buy signal is generated during high volatility periods—signified by the ATR exceeding its 10-day average—helping traders spot potential liquidation points. Sell signals are tailored for traders looking to exit long positions rather than for initiating short positions.
- Bollinger Bands Phases : The indicator categorizes the market condition into three phases based on Bollinger Bands movement:
- Neutral Phase : When the closing price is within the Bollinger Bands' upper and lower limits.
- Bullish Phase : Signaled by the price closing above the upper Bollinger Band, suggesting an upward trend until the price closes below the middle band.
- Bearish Phase : Initiated when the price closes below the lower Bollinger Band, indicating a downtrend until the price closes above the middle band.
Users can opt to exclude the neutral phase from the analysis through the indicator's settings for a more focused view on bullish or bearish trends.
Indicator Customization
The swing indicator is versatile, allowing users to customize the time frames and phase visibility according to their preferences. This feature ensures that traders can tailor the indicator to match their specific analysis needs and trading strategies.
Considerations
- The signals provided by the swing indicator are not symmetrically designed for both buy and sell actions. The indicator primarily optimizes for identifying long positions, particularly in bull markets. The sell signals are intended for exiting existing long positions rather than for short selling.

Fiboborsa+BistTitle: "Fiboborsa+Bist Indicator for TradingView"
Description: The "Fiboborsa+Bist" indicator is a powerful tool designed for TradingView users. This indicator offers a comprehensive set of technical indicators to assist you in your technical analysis and trading decisions.
Features:
Simple Moving Averages (SMA): You can enable or disable SMA with different periods (20, 50, 100, 200) to observe different timeframes and trends.
SMA Strategy: Use SMA crossovers to determine trends. Watch for the 20-period SMA crossing above the 50-period SMA for a bullish signal. For a bearish signal, observe the 50-period SMA crossing below the 100-period SMA.
Exponential Moving Averages (EMA): Similar to SMA, you can enable or disable EMA with different periods (5, 8, 14, 21, 34, 55, 89, 144, 233) for more precise trend analysis.
EMA Strategy: Use EMA crossovers and crossunders for short-term trend changes. A buy signal may occur when the 5-period EMA crosses above the 14-period EMA, while a crossunder suggests a selling opportunity.
Weighted Moving Averages (WMA): Customize WMA settings with various periods (5, 13, 21, 34, 89, 144, 233, 377, 610, 987) to suit your trading style.
WMA Strategy: Use WMA crossovers to verify trends. When the 13-period WMA crosses above the 34-period WMA, it may indicate an uptrend.
Buy and Sell Signals: The indicator provides buy and sell signals based on EMA crossovers and crossunders. Strong signals are also highlighted.
EMA Buy and Sell Strategy: Make informed trading decisions using buy and sell signals generated by EMA crossovers and crossunders.
Ichimoku Cloud: You can enable the Ichimoku Cloud for a clear visual representation of support and resistance levels.
Ichimoku Strategy: Use the Ichimoku Cloud to determine trend direction. Entering long positions is common when the price is above the cloud and considering short positions when it's below the cloud. Verify the trend with the Chikou Span.
Bollinger Bands: Easily visualize price volatility by enabling the Bollinger Bands feature.
Bollinger Bands Strategy: Bollinger Bands help you visualize price volatility. Look for potential reversal points when the price touches or crosses the upper or lower bands.
Use the "Fiboborsa+Bist" indicator to enhance your trading strategies and make informed decisions in the dynamic world of financial markets.
Additional Information:
Bollinger Bands: Bollinger Bands are a technical analysis tool used to monitor price volatility and determine overbought or oversold conditions. This indicator consists of three components:
Middle Moving Average (SMA): Typically, a 20-day SMA is used.
Upper Band: Calculated by adding two times the standard deviation to the SMA.
Lower Band: Calculated by subtracting two times the standard deviation from the SMA.
As the price moves between these two bands, it becomes possible to identify potential buying or selling points by comparing its height or low with these bands.
Ichimoku Cloud: The Ichimoku Cloud is a comprehensive indicator used for trend identification, defining support and resistance levels, and measuring trend strength. The Ichimoku Cloud comprises five key components:
Tenkan Sen (Conversion Line): Used to identify short-term trends.
Kijun Sen (Base Line): Used to identify medium-term trends.
Senkou Span A (Leading Span A): Calculated as (Tenkan Sen + Kijun Sen) / 2 and shows future support and resistance levels.
Senkou Span B (Leading Span B): Calculated as (highest high + lowest low) / 2 and indicates future support and resistance levels.
Chikou Span (Lagging Line): Enables tracking the price backward.
The Ichimoku Cloud interprets a price above the cloud as an uptrend and below the cloud as a downtrend. The Chikou Span assists in verifying the current trend.
ADDITIONAL STRATEGY WITH RSI AND MACD INDICATORS
**Strategy: Two-Stage Trading Strategy Using RSI, MACD, and Fiboborsa+Bist Indicators**
**Stage 1: Determining the Trend and Selecting the Trading Direction**
1. **Trend Identification with Fiboborsa+Bist Indicator:**
- Analyze the simple moving averages (SMA), exponential moving averages (EMA), and weighted moving averages (WMA) used with the Fiboborsa+Bist indicator. These indicators will provide information about the direction of the market trend.
2. **Identifying Overbought and Oversold Conditions with RSI:**
- Use the RSI indicator to identify overbought (70 and above) and oversold (30 and below) conditions. This helps in measuring the strength of the trend. If RSI enters the overbought zone, a downward correction is likely. If RSI enters the oversold zone, an upward correction is probable.
3. **Evaluating Momentum with MACD:**
- Examine price momentum using the MACD indicator. When the MACD line crosses above the signal line, it may indicate an increasing upward momentum. Conversely, a downward cross can suggest an increasing downward momentum.
**Stage 2: Generating Buy and Sell Signals**
4. **Combining RSI, MACD, and Fiboborsa+Bist Indicators:**
- To generate a buy signal, wait for RSI to move out of the oversold region into an uptrend and for the MACD line to cross above the signal line.
- To generate a sell signal, wait for RSI to move out of the overbought region into a downtrend and for the MACD line to cross below the signal line.
5. **Confirmation with Fiboborsa+Bist Indicator:**
- When you receive a buy or sell signal, use the Fiboborsa+Bist indicator to confirm the market trend. Confirming the trend can strengthen your trade signals.
6. **Setting Stop-Loss and Take-Profit Levels:**
- Remember to manage risk when opening buy or sell positions. Set stop-loss and take-profit levels to limit your risk.
7. **Monitor and Adjust Your Trades:**
- Continuously monitor your trade positions and adjust your strategy as per market conditions.
This two-stage trading strategy offers the ability to determine trends and generate trade signals using different indicators. However, every trading strategy involves risks, so risk management and practical application are essential. Also, it's recommended to test this strategy in a demo account before using it in a real trading account.

Better RSIThis script is an enhancement of the original RSI (Relative Strength Index) indicator for TradingView. While the core RSI functionality remains intact, several powerful features have been added to make it a "Better RSI" tool for traders and investors.
Key Features:
1. Divergence Detection: The script now includes both Bullish and Hidden Divergence detection. Bullish Divergence helps identify potential trend reversals when the price makes lower lows, but the RSI makes higher lows. Conversely, Hidden Divergence highlights instances where the RSI and price move in opposite directions, signaling potential trend continuation or reversal.
2. Bollinger Band Breakout Highlight: Users have the option to select "Bollinger Bands" as the Moving Average (MA) type in the settings. When enabled, this feature highlights RSI-Bollinger Band breakouts. It's a valuable tool for traders looking to capitalize on RSI movements in conjunction with Bollinger Bands.
3. Customizable Settings: The script provides a range of customizable settings, allowing you to adjust parameters like RSI length, MA type, Bollinger Bands standard deviation, and more to suit your trading strategy.
4. Clear Visuals: The script offers clear visual cues, with colored backgrounds indicating RSI overbought and oversold levels, as well as extreme breakouts. Bullish and bearish divergence points are also marked with distinct crosses, making it easy to spot potential trading opportunities.
Whether you're a seasoned trader or just starting, the "Better RSI" script empowers you with advanced tools to make more informed trading decisions. Use it to identify potential trend reversals, continuation patterns, and RSI-Bollinger Band breakouts in the market.
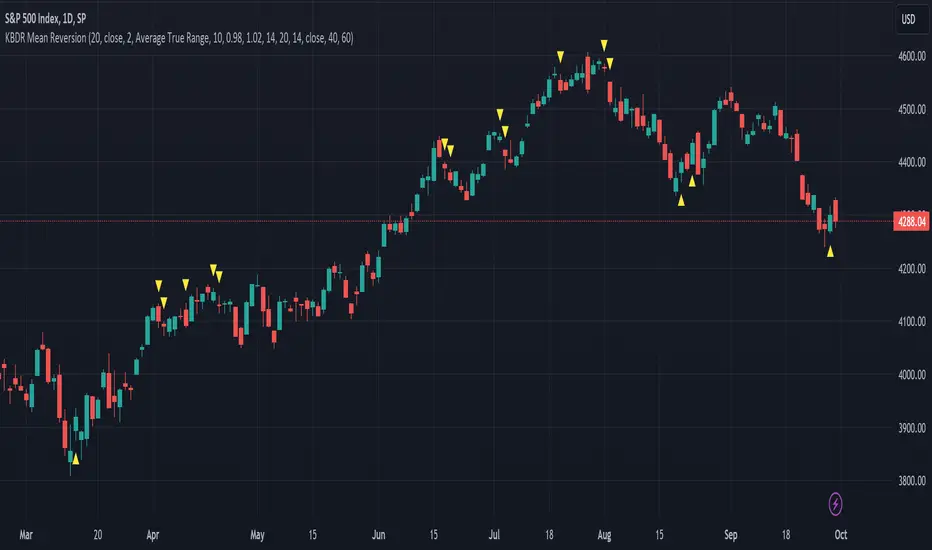
[dharmatech] KBDR Mean ReversionBased on the criteria described in the book "Mean Revision Trading" by Nishant Pant.
Bullish signal criteria:
Bollinger Bands must be outside Keltner Channel
Price near bottom bband
DI+ increasing
DI- decreasing
RSI near bottom and increasing
Bearish signal criteria:
Bollinger Bands must be outside Keltner Channel
Price near upper bband
DI+ decreasing
DI- increasing
RSI near upper and decreasing
A single triangle indicates that all 4 criteria are met.
If letters appear with the triangle, this indicates that there was a partial criteria match.
K : bbands outside Keltner
B : bbands criteria met
D : DI criteria met
R : RSI criteria met
You can use the settings to turn off partial signals. For example:
"Partial 3" means show signals where 3 of the criteria are met.
If you want more insight into the underlying criteria, load these indicators as well:
Bollinger Bands (built-in to TradingView)
Keltner Channels (built-in to TradingView)
RSI (built-in to TradingView)
ADX and DI
Warning:
Not meant to be used as a stand-alone buy/sell signal.
It regularly provides signals which would not be profitable.
It's meant to be used in conjunction with other analysis.
Think of this as a time-saving tool. Instead of manually checking RSI, DI+/DI-, bbands, distance, etc. this does all of that for you on the fly.
IV Squeeze - Sunil Bhave This script calculates both Bollinger Bands and Keltner Channels on a 5-minute chart. It identifies IV squeeze conditions when the lower Bollinger Band is above the lower Keltner Channel and the upper Bollinger Band is below the upper Keltner Channel. When a squeeze is detected, it plots a red triangle below the chart bars and alerts you with a message.
Please note that this script is for educational purposes only.

VCC SmtmWorks better for Cryptos (1W and greater than) timeframes.
This strategy incorporates multiple indicators to make informed trading signals. It leverages the Stochastic indicator to assess price momentum, utilizes the Bollinger Band to identify potential oversold and overbought conditions, and closely monitors Moving Averages to gauge the trend's bullish or bearish nature.
A long signal will be displayed if the following conditions are met:
The Stochastic D and Stochastic K both indicate an oversold condition, with Stochastic K being lower than Stochastic D.
The current Price Low is below the Bollinger Lower Band.
The Price Close is currently below all Moving Averages.
A Death Cross pattern has formed among the Moving Averages.
A short signal will be displayed if the opposite of the long conditions are true:
The Stochastic D and Stochastic K both indicate an overbought condition, with Stochastic K being higher than Stochastic D.
The current Price High is above the Bollinger Upper Band.
The Price Close is currently above all Moving Averages.
A Golden Cross pattern has formed among the Moving Averages.

Ahsan Tufail Precise MA Crossover Filter for Reliable SignalsIntroduction:
In the ever-evolving world of Forex trading, strategies that provide a competitive edge are highly sought after. The Moving Average (MA) crossover technique is a popular long-term approach, but its vulnerability to false signals can lead to potential losses. To overcome this challenge, we introduce a game-changing MA crossover filter designed to weed out false signals and unlock the full potential of this strategy. In this article, we delve into the mechanics of this filter, providing a comprehensive analysis of its components and how it enhances the accuracy of buy and sell signals.
The Power of the MA Crossover Filter:
The essence of our MA crossover filter lies in the integration of a specialized indicator that operates on a scale of 0 to 100. This ingenious indicator dynamically measures the distance between the middle Bollinger band and either the upper or lower Bollinger band. By analyzing the values of the last 504 candlesticks, it maps the range from 50 to 100 for the largest and smallest distances between the middle and upper Bollinger bands. Similarly, for values ranging from 0 to 50, it measures the distance between the middle and lower Bollinger bands.
Unveiling the Signal Execution Process:
The brilliance of this filter is revealed in its meticulous execution of buy and sell signals, which significantly reduces false crossovers. Let's explore the process step-by-step:
Buy Signal Precision:
To initiate a buy signal, the price must be positioned above the 200-period Simple Moving Average (SMA).
The filter validates the crossover by checking the indicator's value, ensuring it falls below the threshold of 25.
Sell Signal Accuracy:
For a sell signal, the price must be below the 200-period Simple Moving Average (SMA).
The filter confirms the crossover by verifying the indicator's value, which should exceed the threshold of 75.
This selective approach ensures that only high-confidence crossovers are considered, maximizing the potential for profitable trades.
Fine-Tuning the Filter for Optimal Performance:
While the MA crossover filter exhibits its prowess in GBPUSD and EURUSD currency pairs, it may require adjustments for other pairs. Currency pairs possess unique characteristics, and adapting the filter to specific behavior is crucial for its success.
To fine-tune the filter for alternative currency pairs, traders should conduct rigorous backtesting and analyze historical price data. By experimenting with indicator threshold values, traders can calibrate the filter to accurately match the dynamics of the target currency pair. This iterative process allows for customization, ultimately resulting in a finely-tuned filter that aligns with the unique behavior of the selected market.
Conclusion:
The MA crossover filter represents a paradigm shift in long-term Forex trading strategies. By intelligently filtering false signals, this precision tool unleashes the true potential of the MA crossover technique, elevating its profitability and enhancing overall trading performance. While no strategy guarantees absolute success, incorporating this filter empowers traders with a heightened level of confidence in their buy and sell signals. Embracing the power of this innovative filter can be a transformative step towards mastering Forex profits and staying ahead in the dynamic world of currency trading.

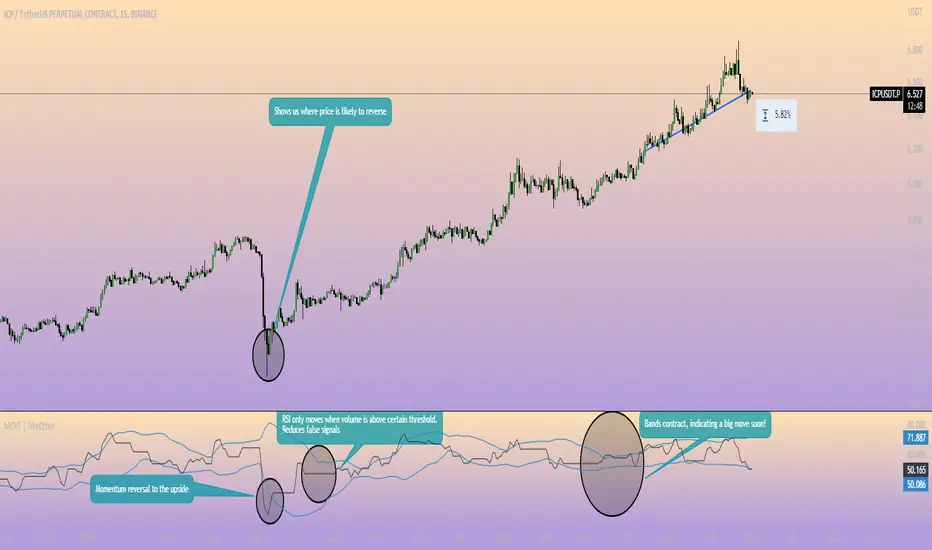
Momentum Channel - [Volume Filter]The indicator incorporates a volume filter to ensure that the RSI only moves when the volume is above the moving average of the volume.
The filtered RSI is then used to calculate the Bollinger Bands and moving averages, providing insights into the market dynamics.
It also gives you insight into the bigger timeframes so you can monitor momentum!
Volume Filter Length: Input parameter for the length of the volume filter moving average.
Overview of code:
rsiPeriod: Input parameter for the RSI period.
bandLength: Input parameter for the length of the Bollinger Bands.
lengthrsipl: Input parameter for the length of the fast moving average (MA) on the RSI.
volumeFilterLength: Input parameter for the length of the volume filter moving average.
volumeAvg: Calculates the moving average of the volume using the ta.sma() function with the specified volume filter length.
filteredRsi: Uses the ta.valuewhen() function to obtain the RSI value only when the volume is greater than or equal to the volume moving average. This creates a filtered RSI based on the volume filter.
offs: Calculates the offset value for the Bollinger Bands. It is derived by multiplying 1.6185 with the standard deviation of the filtered RSI using the ta.stdev() function.
Wavetrend in Dynamic Zones with Kumo Implied VolatilityI was asked to do one of those, so here we go...
As always free and open source as it should be. Do not pay for such indicators!
A WaveTrend Indicator or also widely known as "Market Cipher" is an Indicator that is based on Moving Averages, therefore its an "lagging indicator". Lagging indicators are best used in combination with leading indicators. In this script the "leading indicator" component are Daily, Weekly or Monthly Pivots . These Pivots can be used as dynamic Support and Resistance , Stoploss, Take Profit etc.
This indicator combination is best used in larger timeframes. For lower timeframes you might need to change settings to your liking.
The general Wavetrend settings are the same that are used in Market Cipher, Market Liberator and such popular indicators.
What are these circles?
-These are the WaveTrend Divergences. Red for Regular-Bearish. Orange for Hidden-Bearish. Green for Regular-Bullish. Aqua for Hidden-Bullish.
What are these white, orange and aqua triangles?
-These are the WaveTrend Pivots. A Pivot counter was added. Every time a pivot is lower than the previous one, an orange triangle is printed, every time a pivot is higher than the previous one an aqua triangle is printed. That mimics a very common way Wavetrend is being used for trading when using those other paid Wavetrend indicators.
What are these Orange and Aqua Zones?
-These are Dynamic Zones based on the indicator itself, they offer more information than static zones. Of course static lines are also included and can be adjusted.
What are the lines between the waves?
-This is a Kumo Cloud Implied Volatility indicator. It is color coded and can be used to indicate if a major market move/bottom/top happened.
What are those numbers on the right?
-The first number is a Bollinger Band indicator that shows if said Bollinger Band is in a state of Oversold/Overbought, the second number is the actual Bollinger Band Width that indicates if the Bollinger Band squeezes, normally that happens right before the market makes an explosive move.
Please keep in mind that this indicator is a tool and not a strategy, do not blindly trade signals, do your own research first! Use this indicator in conjunction with other indicators to get multiple confirmations.

Actieve Inversiones EMABBOL by EDOHEN
EMABBOL includes these indicators:
- triple emas (9,21,50)
- Bollinger Bands
- Also includes buying or selling signals
The following strategy is based on ema crosses and bollinger ma crosses, the Bollinger band gives us the target we could expect from our trades, using the upper and lower bands.
Trading criteria
Buy : Price crosses over the triple emas and also crosses under the Bollinger band ema. Looking for 3:1 PnL
Sell : Price crosses under the triple emas and also crosses under the Bollinger band ema. Looking for 3:1 PnL
Stop Loss Tips : set the SL above the crosses if Selling, below the crosses if buying
Take Profit Tips : set the TP below the Bollinger's lower Band band if Selling, or above the Bollinger's upper Band band if Buying

Keltner Channel Width Oscillator (KingThies)Definition
The Keltner Channel Width oscillator is a technical analysis indicator derived originally from the same relationship the Bollinger Band Width indicator takes on Bollinger Bands.
Similar to the Bollinger Bands, Kelts measure volatility in relation to price, and factor in various range calculations to create three bands around the price of a given stock or digital asset. The Middle Line is typically a 20 Day Exponential Moving Average while the upper and lower bands highlight price at different range variations around its basis. Keltner Channel Width serve as a way to quantitatively measure the width between the Upper and Lower Bands and identify opportunities for entires and exits, based on the relative range price is experiencing that day.
Calculation
Kelt Channel Width = (Upper Band - Lower Band) / Middle Band
More on Keltner Channels
Keltner channel was first described by a Chicago grain trader called Chester W. Keltner in his 1960 book How to Make Money in Commodities. Though Keltner claimed no ownership of the original idea and simply called it the ten-day moving average trading rule, his name was applied by those who heard of this concept through his books.
Similarly to the Bollinger Bands, Keltner channel is a technical analysis tool based on three parallel lines. In fact, the Keltner indicator consists of a central moving average in addition to channel lines spread above and below it. The central line represents a 10-day simple moving average of what Chester W. Keltner called typical price. The typical price is defined as the average of the high, low and close. The distance between the central line and the upper, or lower line, is equivalent to the simple moving average of the preceding 10 days' trading ranges.
One way to interpret the Keltner Channel would be to consider the price breakouts outside of the channel. A trader would track price movement and consider any close above the upper line as a strong buy signal. Equivalently, any close below the lower line would be considered a strong sell signal. The trader would follow the trend emphasized by the indicator while complementing his analysis with the use of other indicators as well. However, the breakout method only works well when the market moves from a range-bound setting to an established trend. In a trend-less configuration, the Keltner Channel is better used as an overbought/oversold indicator. Thus, as the price breaks out below the lower band, a trader waits for the next close inside the Keltner Channel and considers this price behavior as an oversold situation indicating a potential buy signal. Similarly, as the price breaks out above the upper band, the trader waits for the next close inside the Keltner Channel and considers this price action as an overbought situation indicating a potential sell signal. By waiting for the price to close within the Channel, the trader avoids getting caught in a real upside or downside breakout.
[laoowai]BNB_USDT_3m_3Commas_Bollinger_MACD_RSI_StrategyBNB_USDT _3m
Release Notes:
Time: 3min
Pair: BNB_USDT
Use: {{strategy.order.alert_message}}
What's the difference with 3Commas Bollinger Strategy by tedwardd:
1. Initial capital: 1210 USDT (10$ Base order / 400$*3 Safety order), if you will change, please change JUST safety order volume or number of safety orders 2-3
2. Using just 2(3) safety order (original script 4)
3. More high-performance strategy for BNB_USDT
4. Using MACD to sell order (original script take profit by scale), thanks Drun30 .
5. Using RSI to analyze the market conditions.
Need to change:
bot_id = input(title="3Commas Bot ID", defval=" YOUR DATA ")
email_token = input(title="Bot Email Token", defval=" YOUR DATA ")
---------------------------------------------------------------------------------------------------------------------------------------------------------------------------------------------------
FAQ copy from tedwardd
---------------------------------------------------------------------------------------------------------------------------------------------------------------------------------------------------
This strategy is intended for use as a way of backtesting various parameters available on 3commas.
The primary inputs for the strategy are:
---------------------------------------------------------------------------------------------------------------------------------------------------------------------------------------------------
// USER INPUTS
Short MA Window - The length of the Short moving average
Long MA Window - The length of the Long moving average
Upper Band Offset - The offset to use for the upper bollinger offset
Lower Band Offset - The offset to use for the lower bollinger offset
Long Stop Loss % - The stop loss percentage to test
Long Take Profit % - The Take profit percentage to test
Initial SO Deviation % - The price deviation percentage required to place to first safety order
Safety Order Vol Step % - The volume scale to test
3Commas Bot ID - (self-explanatory)
Bot Email Token - Found in the deal start message for your bot (see link in the previous section for details)
3Commas Bot Trading Pair - The pair to include for composite bot start deals (should match the format of 3commas, not TradingView IE. USDT_BTC not BTCUSDT )
---------------------------------------------------------------------------------------------------------------------------------------------------------------------------------------------------
Start Date, Month, Year and End Date, Month, and Year all apply to the backtesting window. By default, it will use as much data as it can give the current period select (there is less historical data available for periods below 1H) back as far as 2016 (there appears to be no historical data on Trading view much before this). If you would like to test a different period of time, just change these values accordingly.
---------------------------------------------------------------------------------------------------------------------------------------------------------------------------------------------------
Composite bot using a Bollinger band type trading strategy. While its primary intention is to provide users a way of backtesting bot parameters, it can also be used to trigger a deal start by either using the {{strategy.order.alert_message}} field in your alert and providing the bot details in the configuration screen for the strategy or by including the usual deal start message provided by 3commas.
---------------------------------------------------------------------------------------------------------------------------------------------------------------------------------------------------
Original script:
1. 3Commas Bollinger Strategy by tedwardd
2. Momentum Strategy ( BTC /USDT; 1h) - MACD (with source code) by Drun30

Spread Entry StrengthThis is an overlay indicator showing a strong potential for entry into an option spread trade.
2 background shadings will occur:
The background will shade blue if the ticker is prime for a Bullish Call spread.
The background will shade purple if the the ticker is prime for a Bearish Put spread.
In theory, if the SE Strength is at one of the extremes of the Bear or Bull side, then a spread is prime for entry.
To calculate this, 8 conditions receive a 1 or zero dependent on whether the condition is true (1) or false (0), and then all of those are summed. The primary gist of the strength comes from Nishant's book, or my interpretation thereof, with some additives that limits what I need to review (such as condition 8 below.)
The 8 Bull Conditions are:
1) Bollinger Bands are outside of the Keltner Channels
2) ADX is trending up
3) RSI is trending up
4) -DI is trending down
5) RSI is under 30
6) Price is below the lower Keltner Channel
7) Price is between the lower Bollinger Band and the Bollinger basis.
8) Price at one point within the last 5 bars was below the lower Bollinger Band
The 8 Bear Conditions are the inverse conditions (except the first):
1) Bollinger Bands are outside of the Keltner Channels
2) ADX is trending down
3) RSI is trending down
4) +DI is trending up
5) RSI is over 70
6) Price is above the upper Keltner Channel
7) Price is between the upper Bollinger Band and the Bollinger basis.
8) Price at one point within the last 5 bars was above the upper Bollinger Band
There is a "market noise" filter that will filter out shading when another market move is considered, i.e. if you don't want to see the potential trade when QQQ moves more than 1% then do the following in the settings:
Check "Market Filter"
Enter QQQ in the "Market Ticker To Use"
Enter 1 in the "Market Too Hot Level"
Press Ok
Obviously, the same holds true for the "Market Too Cool Filter."
