Bollinger/Donchian ChannelsProvides a blending of Bollinger Bands and Donchian Channels with shading criteria between.
在腳本中搜尋"弘历投教boll指标代码分析"


[JR] Multi Bollinger Heat BandsBollinger Bands, with incremented additional outer bands.
Set as you would normally, but with the addition of an incremental value for the added outer bands.
Defaults with Length 20, base multiplier of 2.0, and an Increment value of 0.5 for additional outer bands at 2.5 and 3.0. Adjust values to suite your needs.
All lines and zones have colour and formatting options available - because why not eh?

Bollinger Band TouchThis script simply colors the background when price hits or exceeds the bollinger bands. Just a nice visual cue.

Bollinger Bands TimeBollinger bands that are fixed to a time interval. The time interval can be set in minutes or days.
Parameters
Daily Interval: If checked then days are used for the interval. If unchecked then minutes will be used.
Interval: The interval to use for the indicator.
Multiple Timeframe Fib Bollinger Bands - can be used for 3commas*** This idea is based on Bollingers Bands Fibonacci ratios by Shizaru ()
** This will look less chaotic if you don't have all four time frames on at once! I left them on for the demo picture just to show them all simultaneously working.
This is the basis for most of my bot ideas - indicators from longer chart time frames laid over short time frame charts. What I mean by this is that I like the responsiveness of a 1m chart but indicators from a 1h or 4h chart. There are obviously downsides to doing this or everyone would do it, but I have consistently gotten top results using this method. This is a study, so not a strategy yet but you can use this with 3commas if you convert it to a strategy using band crossover/under points as buy and sell triggers.
That is super easy; just follow this excellent guide here which should work for this script:
kodify.net
It's not super hard if you know a little Pine but if you need help hit me up and we can figure something out.
This script by default has 15m, 30m, 1h and 4h settings that are configurable via the gear icon. You can enable or disable any time frame, change the color, etc. I will probably add accurate line labels, custom time frames and adjustable transparency soon.
It's advisable to use higher time frame indicator on a lower time frame chart, but not the other way around. I would use these indicators on a 1m chart but not a 1d chart, for example.
Have fun and I hope you get some use out of this! I use it for context more than bots but it is definitely possible to use it with both.

HLC Bollinger BandsThis is just a Bollinger band indicator that uses the highs & lows in addition to the close in the calculation of volatility / deviations from average. These bands will be slightly wider than regular Bollingers as a result.
I've found it useful with very short lookback lengths (3 to 5) for identifying periods when the bands are contracted... usually leads to an expansion of volatilty, so good for scalps.
Enjoy.

SMA&BOLL脚本用来将sma和布林带统一呈现, 方便及时捕捉价格的走势与波动区间. 只要简单地修改SMA的两条线, 布林带的中间线同时作为SMA的第三条长周期参考线也作为布林带的基础计算曲线, 一线双用节省资源.
The script is used to present the sma and Bollinger bands in a unified manner, which is convenient to capture the price trend and fluctuation range in time. Just simply modify the two lines of the SMA, and the middle line of the Bollinger bands serves as the third long-period reference line of the SMA and also serves as the Bollinger bands The basic calculation curve, one-line dual-use saves resources.

DT Bollinger BandsIndicator Overview
Purpose: The script calculates and plots Bollinger Bands, a technical analysis tool that shows price volatility by plotting:
A central moving average (basis line).
Upper and lower bands representing price deviation from the moving average.
Additional bands for a higher deviation threshold (3 standard deviations).
Customization: Users can customize:
The length of the moving average.
The type of moving average (e.g., SMA, EMA).
The price source (e.g., close price).
Standard deviation multipliers for the bands.
Fixed Time Frame: The script can use a fixed time frame (e.g., daily) for calculations, regardless of the chart's time frame.
Key Features
Moving Average Selection:
The user can select the type of moving average for the basis line:
Simple Moving Average (SMA)
Exponential Moving Average (EMA)
Smoothed Moving Average (SMMA/RMA)
Weighted Moving Average (WMA)
Volume Weighted Moving Average (VWMA)
Standard Deviation Multipliers:
Two multipliers are used:
Standard (default = 2.0): For the original Bollinger Bands.
Larger (default = 3.0): For additional bands.
Bands Calculation:
Basis Line: The selected moving average.
Upper Band: Basis + Standard Deviation.
Lower Band: Basis - Standard Deviation.
Additional Bands: Representing ±3 Standard Deviations.
Plots:
Plots the basis, upper, and lower bands.
Fills the area between the bands for visual clarity.
Plots and fills additional bands for ±3 Standard Deviations with lighter colors.
Alerts:
Generates an alert when the price enters the range between the 2nd and 3rd standard deviation bands.
The alert can be used to notify when price volatility increases significantly.
Background Highlighting:
Colors the chart background based on alert conditions:
Green if the price is above the basis line.
Red if the price is below the basis line.
Offset:
Adds an optional horizontal offset to the plots for fine-tuning their alignment.
How It Works
Input Parameters:
The user specifies settings such as moving average type, length, multipliers, and fixed time frame.
Calculations:
The script computes the basis (moving average) and standard deviations on the fixed time frame.
Bands are calculated using the basis and multipliers.
Plotting:
The basis line and upper/lower bands are plotted with distinct colors.
Additional 3 StdDev bands are plotted with lighter colors.
Alerts:
An alert condition is created when the price moves between the 2nd and 3rd standard deviation bands.
Visual Enhancements:
Chart background changes color dynamically based on the price’s position relative to the basis line and alert conditions.
Usage
This script is useful for traders who:
Want a detailed visualization of price volatility.
Use Bollinger Bands to identify breakout or mean-reversion trading opportunities.
Need alerts when the price enters specific volatility thresholds.

[jav] Better Bollinger BandsBetter Bollinger Bands (BBB)
This script is a modification of classic Bollinger Bands (BB).
CHARACTERISTICS
Main improvement over BB:
There is no need to introduce a standard deviation multiplier (usually 2).
Here, only a length is needed (usually 20 bars for BB).
Other features:
The type of moving average can be selected: sma, ema, vwma, wma or rma.
An inner band is plotted as an additional indication of approaching extreme levels.
Classic BB can also be shown on the graph for the sake of comparison.
CALCULATIONS
The calculation of BBB is done by adding three different contributions:
Standard deviation of price
Standard deviation of (price minus moving average)
Average of (high - low) over length.
RESULTS
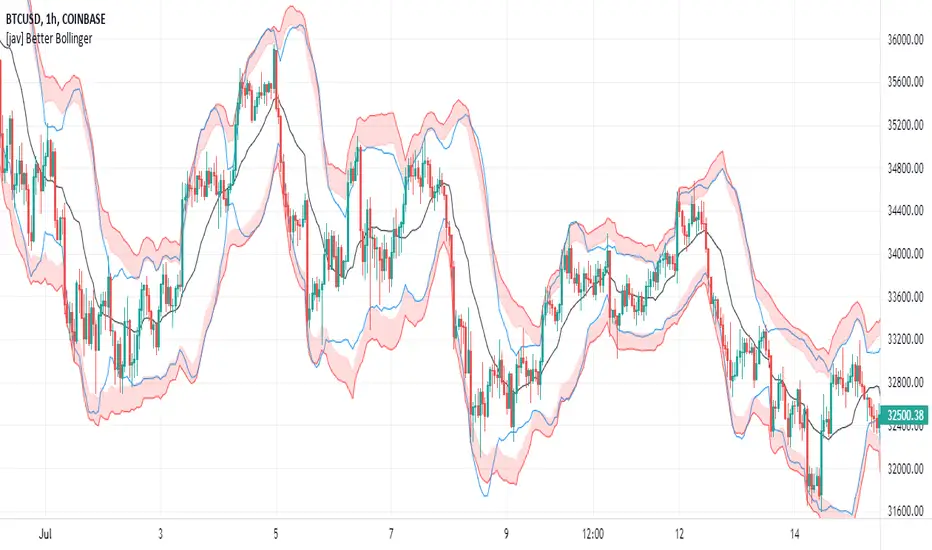
It looks like BBB follows prices more smoothly (without the typical overshoots of BB). Also, it fits extreme values with higher accuracy. Finally, usually it doesn't cross through prices at less relevant, intermediate higher highs or lower lows, which can be advantageous.
See the comparison between red BBB vs blue BB:
Both vwma and ema seem to give decent BBB values using the standard length of 20 bars.
2 Length Bollinger BandsThis indicator is a two length Bollinger Band implementation. It uses the Simple Moving Average, and adjusts to the period you are looking at: e.g. if you are looking at the day chart, periods are in days. If you are looking at the 5 minute chart, periods are within 5 minute increments.
The foregrounded set of bands is based on the 20 length SMA. So, in the case of the day chart, the successive bands from the middle are 1, 2, 2.5, and 3 standard deviations from the midline (which is a dotted orange line). The upper 2.5 and 3 stddev band is orange and red respectively. When the price gets up into these regions it could indicate a potential sell or short opportunity. The lower 2.5 and 3 stddev bands are colored with lime and green,when the price goes into these regions it indicates a potential buy opportunity.
The backgrounded set of bands is based on the 50 length SMA. So, in the case of the day chart, the successive bands from the middle are 1, 2, 2.5, and 3 standard deviations from the midline (which is a dotted purple line). It is intentionally more transparent so as to be seen as a slower background trend, so that the foreground bands (based on the 20 length SMA) can be interpreted within a developing context based on consideration of the slower period.
There are many other things to consider with Bollinger Bands, such as the 'squeeze' when the bands get narrow, which is often followed by a 'squeeze' up or down. It is best to consider BBs alongside other indicators (leading & lagging) and with consideration of volume in order to confirm or invalidate your thesis before making a trade.

Better Bollinger Bands (now open source)General purpose Bollinger band indicator with a number of configuration options and some additional color-coded information. The main advantages of it over standard Bollinger bands are:
1) Better statistics:
* Uses volume weighted moving averages, variance, and standard deviation by default. The volume dependence can be disabled with a checkbox option, but generally makes it more responsive improves its ability to distinguish true outlier events from random variation.
* Lets you pick between different time windows (simple, sawtooth (WMA), exponential) in addition to the volume weighting, with appropriate Bessel corrections to make the estimators unbiased and to get consistent result for different weights.
* Has a checkbox option to use a linear regression in the band calculation if you don't want average momentum to be counted in the volatility. This turns the centerline into a last squares moving average, and the band width at each time step is given by the variance away from the regression line instead of from a moving average. Weights in the least squares regression are changed according to the other options. For tickers with a strong long-term trend this makes the bands track the price action more closely.
2) Geometric
* This does all calculations on log(price) instead of the prices themselves.
* Makes almost no difference in most cases, but gives better results on charts with strongly exponential behaviour that range between several orders of magnitude.
* Properly centered around price action on log plots.
* Will never annoy you by rescaling a log plot due to a negative lower band. The lower band is always positive for positive prices.
3) Some built in oscillators.
* This aims to reduce clutter by building in some other indicators into the band color scheme. You can pick between various momentum & RSI operators to color the center line and the bands, or leave the bands plain.
I've been using these bands myself for a few months & have been gradually adding functionality & polish. Feel free to comment, or to refer to me if you borrow any ideas.

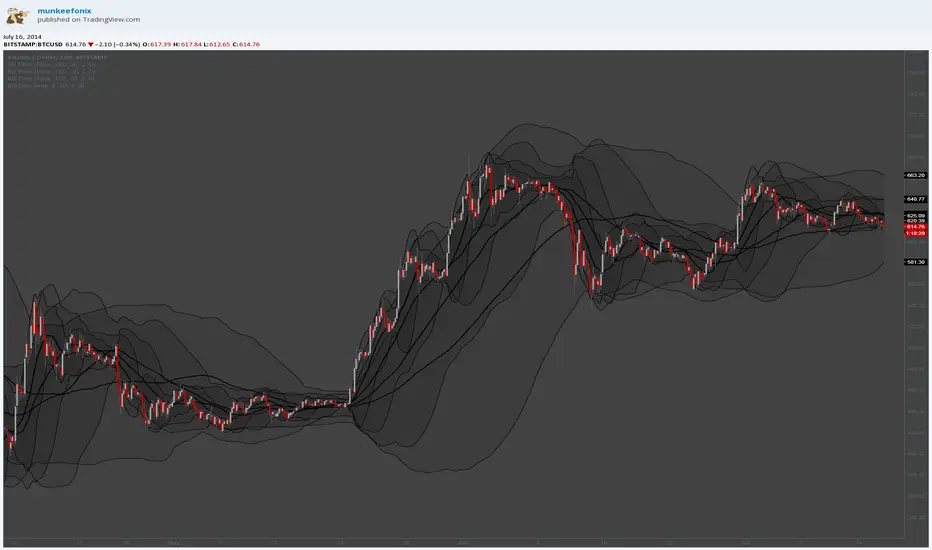
Geometric Bollinger BandsAnalogous to Bollinger bands but performs all computations on the logarithms of the values.
Unlike the regular bollinger bands (or most other variations of them available on tradingview), these won't annoy you by rescaling the chart when you try to look at the Bitcoin weekly chart or any other chart with strongly exponential behaviour, and the moving average is perfectly centered between the two bands on your log chart. The lower band is guarenteed to be positive for positive inputs.

Multi-TimeFrame Bollinger BandsMulti-timeframe bollinger band
This script generates higher timeframe bollinger band in a lower timeframe chart, which can be used to find better reference of entry and exit.

Madrid Bollinger Bands SDThis study tracks where the 5MA is relative to the Bollinger Bands
Bollinger Bands are segmented in four parts, +/- 2 stdDev and +/- 1 stdDev
+/- 1 : first StdDev Band
+/- 4 : Second StdDev Band
+/- 9 : Overbought / Oversold (Beyond 2nd SD Band)
This study is used to reduce the clutter on the screen. Instead of displaying the whole band, it displays a map that shows on which band the price is located. And provides at a glance the strength of the trend.

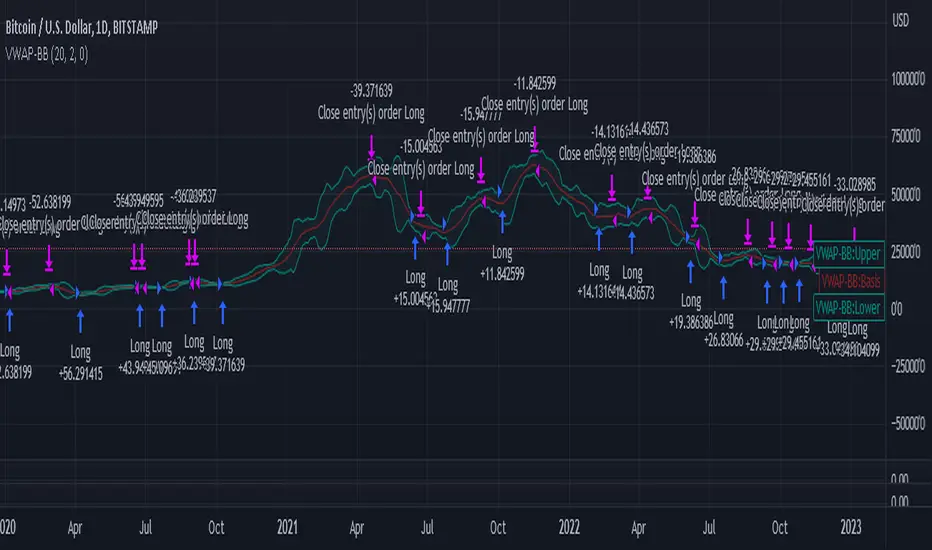
VWAP-Bollinger BandsThis script uses Bollinger bands but with a VWAP as the source, it uses the high crossing the upper band as a buy signal and a low crossing the lower band as a sell signal
Its default settings are for a day chart - Crypto 30 periods, forex 24 periods and stocks 20 periods, which basically line up with a month per asset class
ive seen good results in crypto and stocks, settings used between1% and 10% equity per trade with a 0.1% fee which lines up with Binance fee structure and $25 per trade which lines up with Commsec on the ASX
6 Bollinger Bands (1.5 thru 4)20 period SMA Bollinger Bands with the following standard deviations: 1.5 2 2.5 3 3.5 4

CBMA Bollinger Bands Strategy directed [ChuckBanger]I just did a Bollinger Bands script with my newly CB moving average
While I'm generally against posting strategies because it's very easy to fake performance numbers... This is just to share a cool strategy snippet. My settings are 10 contracts/order with pyramiding set to 10. You can make the profitability a lot higher if you set the order size higher. But that dosent help you getting more out of this script when u make a bot of this script. I set the order size to 10 contracts to get your attention not to showcase the performance.
When the price is going down and outside of the lower side of the band. And when the price comes back into the channel the strategy buys. Usually that means the price is going up. And when the price is going up and outside of the upper band. The strategy sells when it crosses back in to the channel.
It is a very simple strategy but it is effective. I guess you need a proper stop-loss for this script to bee really profitable in a bot environment.

EMA Bollinger BandsThis is a simple Bollinger Bands indicator that uses the exponential moving average instead of the simple moving average.

MG - Bollinger band alerts- Displays the Bollinger Bands for standard deviation coefficients 2 & 3 (can toggle both independently)
- Has four preset alerts
- Price reached upper band (SD = 3)
- Price reached upper band (SD = 2)
- Price reached lower band (SD = 2)
- Price reached lower band (SD = 3)

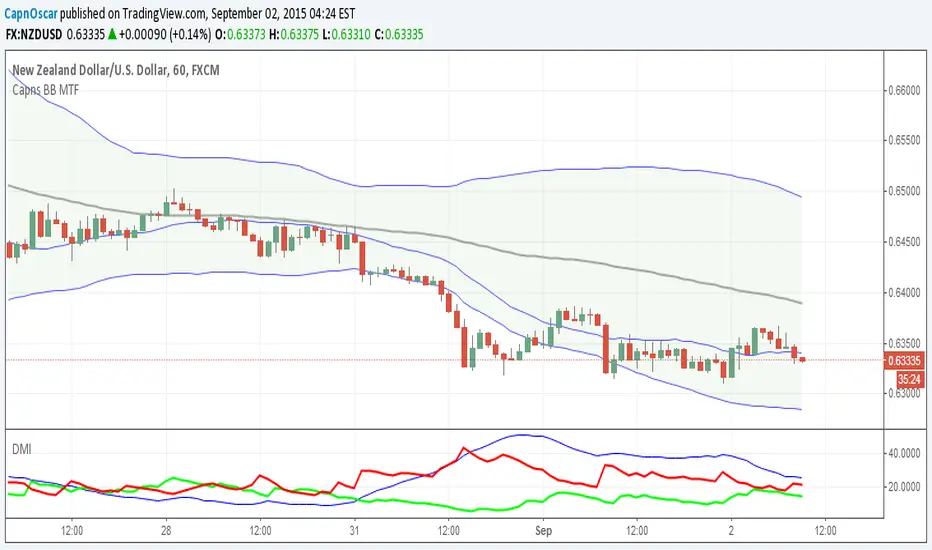
Capns Bollinger Bands MTF This Simple Script display higher time frame Bollinger Band on current resolution . Etc : On 1 Minutes chart BB Band is 5 Minutes Band. I use this code on my pc for scalping...Hope You like the idea