A Multi 10 indicatorREAD NOTE BEFORE APPLYING or you may think indicator doesnt work.
This indicator is a revise of another i made and contains 10 Optional Indicators allowing you to load more then 3 indicators at once if you so choose and dont pay for the platform!
Hopefully someone will find use for this script besides me :) I dont suggest turning all on at once because it
will not look right. Alot will overlap if you wish but i only use the Session and trend bar at once in
conjuction with a Oscillator setting like MacD , RSI , Stoch , Aroon or CCI .
In the chart you see i only have a few indicators active ENJOY!!
---------- NOTE ----------- ( Everything is OFF by default and indicator SHOULD show up BLANK when loaded) ------------ NOTE -------------
(Can turn EVERYTHING on AND change any values in the format tab once indicator loads)
NY session, Aussie session, Asian session, and Europe market sessions.
MacD Split Colored , aroon oscillator
CCI Oscillator , classic aroon
RSI Oscillator , Elliot wave
Stoch RSI Oscillator
Aroon Oscillator
My own Trend bar
---------- NOTE ----------- ( Everything is OFF by default and indicator SHOULD show up BLANK when loaded) ------------ NOTE -------------
(Can turn EVERYTHING on AND change any values in the format tab once indicator loads) CODE probably looks messey but this is something i made for me so i didnt really care lol
在腳本中搜尋"徐家汇MACD、RSI技术指标"

Manadi Buy/Sell Strategy EMA + MACD + RSI + AlertsIt is a strategy / indicator of buy and sell special crypto for 15 min to 1 h time frame.
used with RSI, Macd, and Ema cros 9/21

X1 newbie code trying to create
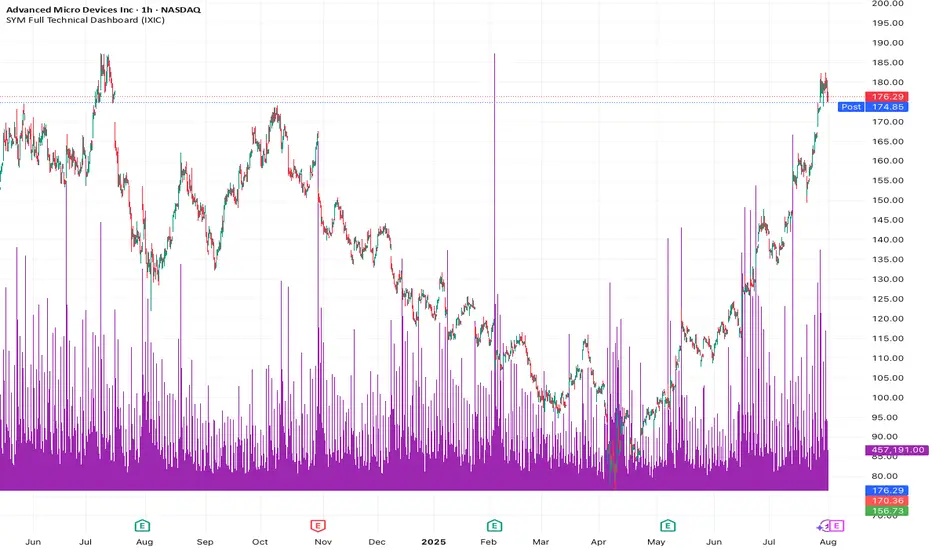
✅ Script Behavior on Other Stocks
• If you’re on a chart for SYM, it calculates indicators using SYM’s data.
• If you switch to NVDA, AVGO, CRDO, etc., it will automatically update to reflect that ticker’s:
• Price
• 50-day moving average
• Volume
• MACD
• RSI
• Index comparison
with 1. 📊 Volume shows in its own pane
2. ✅ MACD and RSI are included in separate panes (as promised)
3. 🎯 Script works cleanly with any ticker

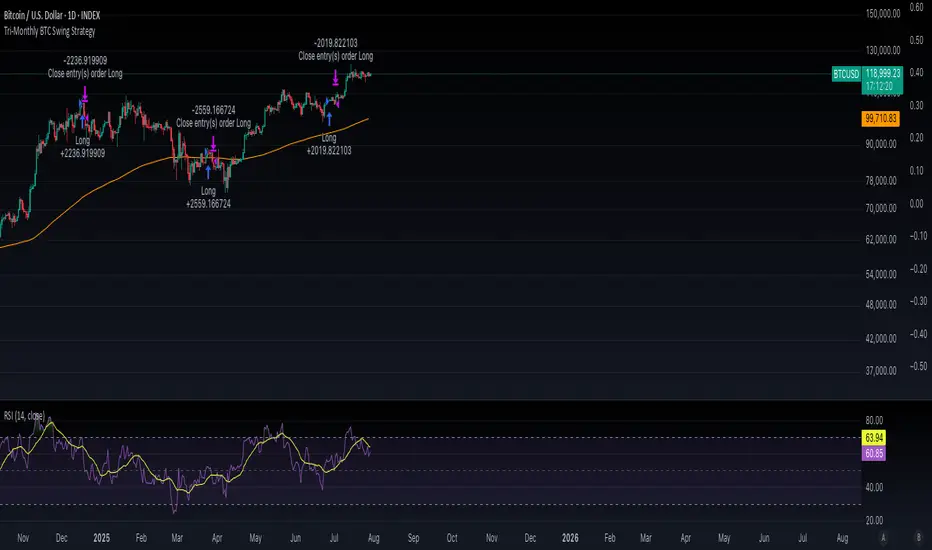
Tri-Monthly BTC Swing StrategyWhat This Does:
Component Function
EMA200 Filters long-term bullish conditions
MACD crossover Confirms swing entry
RSI > 50 Confirms momentum is strong
90-day cooldown Ensures you're not overtrading
Exit on MACD/RSI weakness Protects from reversals
AI Trend Momentum SniperThe AI Trend Momentum Sniper is a powerful technical analysis tool designed for day trading. This strategy combines multiple momentum and trend indicators to identify high-probability entry and exit points. The indicator utilizes a combination of Supertrend, MACD, RSI, ATR (Average True Range), and On-Balance Volume (OBV) to generate real-time signals for buy and sell opportunities.
Key Features:
Supertrend for detecting market direction (bullish or bearish).
MACD for momentum confirmation, highlighting changes in market momentum.
RSI to filter out overbought/oversold conditions and ensure high-quality trades.
ATR as a volatility filter to adjust for changing market conditions.
OBV (On-Balance Volume) to confirm volume strength and trend validity.
Dynamic Stop-Loss & Take-Profit based on ATR to manage risk and lock profits.
This indicator is tailored for intraday traders looking for quick market moves, especially in volatile and high liquidity assets like Bitcoin (BTC) and Ethereum (ETH). It helps traders capture short-term trends with efficient risk management tools.
How to Apply:
Set Your Chart: Apply the AI Trend Momentum Sniper to a 5-minute (M5) or 15-minute (M15) chart for optimal performance.
Buy Signal: When the indicator generates a green arrow below the bar, it indicates a buy signal based on positive trend and momentum alignment.
Sell Signal: A red arrow above the bar signals a sell condition when the trend and momentum shift bearish.
Stop-Loss and Take-Profit: The indicator automatically calculates dynamic stop-loss and take-profit levels based on the ATR value for each trade, ensuring proper risk management.
Alerts: Set up custom alerts for buy or sell signals, and get notified instantly when opportunities arise.
Best Markets for Use:
BTC/USDT, ETH/USDT – High liquidity and volatility.
Major altcoins with sufficient volume.
Avoid using it on low-liquidity assets where price action may become erratic.
Timeframes:
This indicator is best suited for lower timeframes (5-minute to 15-minute charts) to capture quick price movements in trending markets.

Confluence Buy-Sell Indicator with Fibonacci The script is a "Confluence Indicator with Fibonacci" designed to work on the TradingView platform. This indicator combines multiple technical analysis strategies to generate buy and sell signals based on user-defined confluence criteria. Here's a breakdown of its features:
Confluence Criteria: Users can enable or disable various strategies like MACD, RSI, Bollinger Bands, Divergence, Fibonacci, and Moving Average. The number of strategies that need to align for a signal to be generated can be set by the user.
Strategies Included:
MACD Strategy: Uses the Moving Average Convergence Divergence method to identify buy/sell opportunities.
RSI Strategy: Utilizes the Relative Strength Index to detect overbought or oversold conditions.
Bollinger Bands Strategy: Incorporates Bollinger Bands to identify volatility and potential buy/sell signals.
Divergence Strategy: A basic implementation that detects bullish and bearish divergences using the RSI.
Fibonacci Strategy: Uses Fibonacci retracement levels to determine potential support and resistance levels.
Moving Average Strategy: Employs a crossover system between the 50-period and 200-period simple moving averages.
Additional Features:
Support & Resistance: Identifies major support and resistance levels from the last 50 bars.
Pivot Points: Calculates pivot points to determine potential turning points.
Stop Loss Levels: Automatically calculates and plots stop-loss levels for buy and sell signals.
NYC Midnight Level: Option to display the New York City midnight price level.
Visualization: Plots buy and sell signals on the chart with green and red markers respectively.
Adequate Category:
"Technical Analysis Indicators & Overlays" or "Strategy & Scripting Tools".

AI-Bank-Nifty Tech AnalysisThis code is a TradingView indicator that analyzes the Bank Nifty index of the Indian stock market. It uses various inputs to customize the indicator's appearance and analysis, such as enabling analysis based on the chart's timeframe, detecting bullish and bearish engulfing candles, and setting the table position and style.
The code imports an external script called BankNifty_CSM, which likely contains functions that calculate technical indicators such as the RSI, MACD, VWAP, and more. The code then defines several table cell colors and other styling parameters.
Next, the code defines a table to display the technical analysis of eight bank stocks in the Bank Nifty index. It then defines a function called get_BankComponent_Details that takes a stock symbol as input, requests the stock's OHLCV data, and calculates several technical indicators using the imported CSM_BankNifty functions.
The code also defines two functions called get_EngulfingBullish_Detection and get_EngulfingBearish_Detection to detect bullish and bearish engulfing candles.
Finally, the code calculates the technical analysis for each bank stock using the get_BankComponent_Details function and displays the results in the table. If the engulfing input is enabled, the code also checks for bullish and bearish engulfing candles and displays buy/sell signals accordingly.
The FRAMA stands for "Fractal Adaptive Moving Average," which is a type of moving average that adjusts its smoothing factor based on the fractal dimension of the price data. The fractal dimension reflects self-similarity at different scales. The FRAMA uses this property to adapt to the scale of price movements, capturing short-term and long-term trends while minimizing lag. The FRAMA was developed by John F. Ehlers and is commonly used by traders and analysts in technical analysis to identify trends and generate buy and sell signals. I tried to create this indicator in Pine.
In this context, "RS" stands for "Relative Strength," which is a technical indicator that compares the performance of a particular stock or market sector against a benchmark index.
The "Alligator" is a technical analysis tool that consists of three smoothed moving averages. Introduced by Bill Williams in his book "Trading Chaos," the three lines are called the Jaw, Teeth, and Lips of the Alligator. The Alligator indicator helps traders identify the trend direction and its strength, as well as potential entry and exit points. When the three lines are intertwined or close to each other, it indicates a range-bound market, while a divergence between them indicates a trending market. The position of the price in relation to the Alligator lines can also provide signals, such as a buy signal when the price crosses above the Alligator lines and a sell signal when the price crosses below them.
In addition to these, we have several other commonly used technical indicators, such as MACD, RSI, MFI (Money Flow Index), VWAP, EMA, and Supertrend. I used all the built-in functions for these indicators from TradingView. Thanks to the developer of this TradingView Indicator.
I also created a BankNifty Components Table and checked it on the dashboard.

Ultimate IndicatorThis is a combination of all the price chart indicators I frequently switch between. It contains my day time highlighter (for day trading), multi-timeframe long-term trend indicator for current commodity in the bottom right, customizable trend EMA which also has multi-timeframe drawing capabilities, VWAP, customizable indicators with separate settings from the trend indicator including: EMA, HL2 over time, Donchian Channels, Keltner Channels, Bollinger Bands, and Super Trend. The settings for these are right below the trend settings and can have their length and multiplier adjusted. All of those also have multi-timeframe capabilities separate from the trend multi-time settings.
The Day Trade Highlight option will draw faint yellow between 9:15-9:25, red between 9:25-9:45, yellow between 9:45-10:05. There will be one white background at 9:30am to show the opening of the market. while the market is open there will be a very faint blue background. For the end of the day there will be yellow between 15:45-15:50, red between 15:50-16:00, and yellow between 16:00-16:05. During the night hours, there is no coloring. The purpose of this highlight is to show the opening / closing times of the market and the hot times for large moves.
The indicators can also be colored in the following ways:
1. Simple = Makes all colors for the indicator Gray
2. Trend = Will use the Donchian Channels to get the short-trend direction and by default will color the short-term direction as Blue or Red. Unless using Super Trend, the Donchian Channel is used to find short-term trend direction.
3. Trend Adv = Will use the Donchian Channels to get the short-trend direction and by default will color the short-term direction as Blue or Red. Unless using Super Trend, the Donchian Channel is used to find short-term trend direction. If there is a short-term up-trend during a long-term down-trend, the Blue will become Navy. If short-term down-trend during long-term up-trend, the Red will be Brown.
4. Squeeze = Compares the Bollinger Bands width to the Keltner Channels width and will color based on relative squeeze of the market: Teal = no squeeze. Yellow = little squeeze. Red = decent squeeze. White = huge squeeze. if you do not understand this one, try drawing the Bollinger Bands while using the Squeeze color option and it should become more apparent how this works. I also recommend leaving the length and multiplier to the default 20 and 2 if using this setting and only changing the timeframe to get longer/shorter lengths as I've seen that changing the length or multiplier can more or less make it not work at all.
Along with the indicator settings are options to draw lines/labels/fills for the indicator. I enjoy having only fills for a cleaner look.
The Labels option will show Buy/Sell signals when the short-term trend flips to agree with the long-term trend.
The Trend Bars option will do the same as the Labels option but instead will color the bars white when a Buy/Sell option is given.
The Range Bars option shows will color a bar white when the Close of a candle is outside of a respective ranging indicator option (Bollinger or Keltner).
The Trend Bars will draw white candles no matter which indicator selection you make (even "Off"). However, Range Bars will only draw white when either Bollinger or Keltner are selected.
The Donchian Channels and Super Trend are trending indicators and should be used during trending markets. I like to use the MACD in conjunction with these indicators for possibly earlier entries.
The Bollinger Bands and Keltner Channel are ranging indicators and should be used during ranging markets. I like to use the RSI in conjunction with these indicators and will use 60/40 for overbought and oversold areas rather than 70/30. During a range, I wait for an overbought or oversold indication and will buy/sell when it crosses back into the middle area and close my position when it touches the opposite band.
I have a MACD/RSI combination indicator if you'd like that as well :D
As always, trade at your own risk. This is not some secret indicator that will 100% win. As always, the trades you see in the picture use a 1:1.5 or 1:2 risk to reward ratio, for today (August 8, 2022) it won 5/6 times with one trade still open at the end of the day. Manage your account correctly and you'll win in the long term. Hit me up with any questions or suggestions. Happy Trading!

Full CRYPTO pack macd, rsi, obv, ema alert versionThis is the indicator version of a simple, yet very efficient crypto strategy, adapted to 4h time frame, on big coins like ETH and BTC . However it can be adapted to other markets, timeframes etc
For this strategy I use a combination of a trend line , an oscillator, price action and volume .
This study has alert for both long and short entries/exit.
The rules are the next ones:
Long : we check that current candle is ascending and above the moving average, the macd is in positive range, rsi is below overbought level and volume is bigger than the moving avg of volume .
For short, we have the opposite long rules.
If you have any questions, please let me know !

Full CRYPTO pack macd, rsi, obv, ema strategyThis is a simple, yet very efficient crypto strategy, adapted to 4h time frame, on big coins like ETH and BTC. However it can be adapted to other markets, timeframes etc
For this strategy I use a combination of a trend line, an oscillator, price action and volume.
This strategy has both the opportunity to go long and short.
As well, it has a leverage simulator .
The rules are the next ones:
Long : we check that current candle is ascending and above the moving average, the macd is in positive range, rsi is below overbought level and volume is bigger than the moving avg of volume.
For short, we have the opposite long rules.
If you have any questions, please let me know !

Collar Color IndicatorThe collar color ribbon indicator uses 4 different colors to help you deciding what to do with your position.
It uses a combination of MACD, RSI, SMA5 and SMA20 indicators to predict possible changes stock movement.
Green color
The indicator displays green when the RSI > 50, the MACD > 0 and the SMA5 > SMA20
Green indicates an upward (bullish) trend
When your long position is protected by a PUT option, the first green signal (after a series of 'non' green signals) indicates you could sell your PUT option as the trend becomes bullish.
In case of a short position, you should be protected by a CALL option
Yellow color
The indicator displays yellow when 1 of 3 the 'green' conditions aren't met
Yellow indicates that an upwards (bullish) trend is weakening or that a downwards (bearish) trend is strongly transitioning towards an upward (bullish) trend
If going short then you should consider buying a CALL option to protect your position
Orange color
The indicator displays orange when 2 of the 3 'green' conditions aren't met
Orange indicates that an upwards bullish trend is strongly transitioning towards a downwards bearish trend or that a downwards (bearish) trend is weakening
If going long then this you should considering buying a PUT option to protect your position
Red color
The indicator displays red when none of the 'green' conditions are met
Red indicates an downwards (bearish) trend
When your short position is protected by a CALL option, the first red signal (after a series of 'non' red signals) indicates you could sell your CALL option as the trend becomes bearish.
In case of a long position, you should be protected by a PUT option

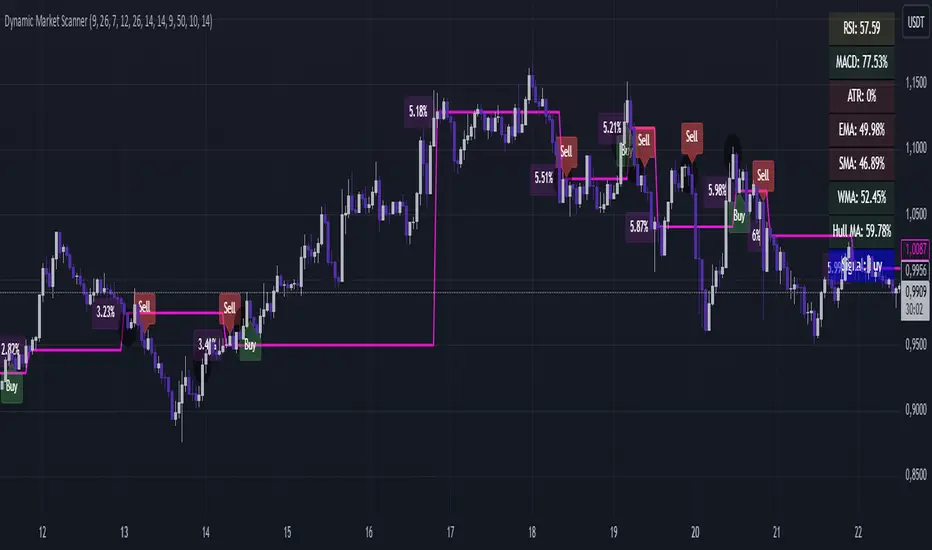
Dynamic Market ScannerDynamic Market Scanner is a powerful tool for analyzing financial markets, combining a variety of indicators to provide clear and understandable signals.
Key Features:
- Signal Generation:
The main signals "Buy", "Sell", and "Hold" are formed based on the analysis of indicators:
- MACD
- RSI
- SMA
- EMA
- WMA
- Hull MA
Additional Analytical Tools:
- ATR is used to assess volatility and helps to understand the risk of the current market situation.
- SMA Ichimoku does not generate signals but is used to assess their accuracy.
- If the price is above the SMA, "Buy" signals are more likely, as this confirms the strength of the upward movement.
- If the price is below the SMA, "Buy" signals require additional confirmations.
Dashboard:
Displays the current price position relative to the indicators, helping the trader understand how strong or weak the current signals are.
Advantages of Using:
1. Signal Filtering:
The price position relative to the SMA Ichimoku helps to assess the likelihood of successful trades.
2. Volatility Analysis:
ATR provides additional information about risks and market fluctuations.
3. Comprehensive Approach:
Signal generation is based on a combination of key indicators, offering a multifaceted view of the market.
Explanation of Percent Calculation in the Table:
- The table shows the values of indicators such as MACD, ATR, EMA, SMA, WMA, and Hull MA in percentages. Percentages are calculated based on the current value of the indicator relative to its maximum and minimum.
- Percentages are displayed for each indicator, allowing traders to assess market conditions based on their current values.
Dynamic Market Scanner will become a reliable assistant in your technical analysis toolkit, providing a comprehensive overview of market conditions and helping to make informed trading decisions.
BEC (Bearish Elephant Candle)Description:
The Bearish Elephant Candle Indicator is designed to identify and signal potential short entry points based on the Bearish Elephant Candle pattern. This pattern is characterized by a large bearish candle, where the body (difference between open and close) is more than 70% of the entire range (difference between high and low), and the total range is greater than the average true range over a specified period. The indicator also plots a 20-period Exponential Moving Average (EMA) to help visualize the trend.
How It Works:
Bearish Elephant Candle Identification:
The indicator calculates the true range and the average true range (ATR) over a specified period (default is 20 periods).
A candle is identified as a Bearish Elephant Candle if the body is more than 70% of the entire range, and the total range exceeds the average true range.
Short Entry Signal:
When a Bearish Elephant Candle is identified, a short entry signal is plotted on the chart as a red downward label.
Exponential Moving Average (EMA):
A 20-period EMA is plotted on the chart to help users visualize the overall trend. The EMA can serve as an additional filter or exit point for trades.
Pros:
Simplicity: The Bearish Elephant Candle pattern is straightforward to understand and identify.
Visual Signals: The indicator provides clear visual signals for potential short entries, making it easy for traders to spot opportunities.
Trend Visualization: The inclusion of the EMA helps traders stay aligned with the overall trend, potentially improving the effectiveness of the signals.
Cons:
False Signals: Like any pattern-based indicator, it can generate false signals, especially in choppy or sideways markets.
No Confirmation: This version of the indicator does not include additional confirmation signals (e.g., from other indicators like MACD), which may reduce its reliability.
Limited Scope: The indicator focuses solely on bearish signals and does not provide long entry signals.
Best Way to Use It:
Trend Alignment: Use the 20-period EMA to ensure you are trading in the direction of the overall trend. For example, prioritize short signals when the price is below the EMA.
Combine with Other Indicators: Enhance the reliability of the signals by combining this indicator with other technical indicators (e.g., MACD, RSI) for additional confirmation.
Risk Management: Always use proper risk management techniques, such as stop-loss orders, to protect against adverse market movements. Consider placing stop-loss orders above the high of the Bearish Elephant Candle.
Market Context: Be mindful of the broader market context and avoid using the indicator in highly volatile or news-driven environments where patterns may be less reliable.

JC_MacD_RSI_Candle_Strat_public//
// Author : Jacques CRETINON
// Last Version : V1.0 11-22-2016
//
// Risk disclaimer : Do not use this script in production environment. We assume no liability or responsibility for any damage to you, your computer, or your other property, due to the use of this script.
//
// Purpose of this script :
// 1- use same pine code for strategy or study script (with simple modifications)
// 2- be able to send alerts : enterlong, entershort, exitlong, exitshort, stoplosslong, stoplossshort, takeprofitlong, takeprofitshort in a study script like a strategy script should do
// 3- do not repaint (I HOPE)
//
// RoadMap :
// 1- manage : Trailing Stop Loss and Trailing Stop Loss offset
//
// I use this script :
// 1- with default value for XAUUSD, current chart resolution : 1mn, large timeframe : 15mn.
// 2- That's why I hard code MACD5 (5mn average), MACD15 (15mn average), MACD60 (1h average) ...
// 3- MACD, RSI (1mn and 15mn) and Candles info are my inputs to take any decisions
//
// I do not publish my enterLong, enterShort, exitLong and exitShort conditions (lines 204 to 207 are sample !) as they are not as perfect as I'd like. Fell free to use your own conditions :)
//
// Please, report me any bug, fell free to discuss and share. English is not my natural language, so be clement ;) Happy safe trading :)

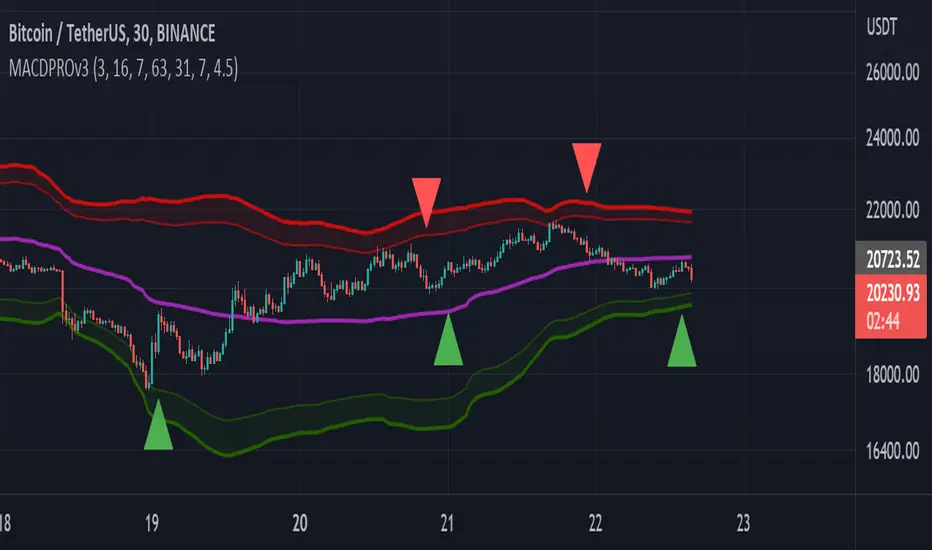
MACDPROThis MACDPRO indicator is based on MACD, RSI, ADX, BB and it has LONG/SHORT alerts for signals
In script settings you can specify:
1) Dispertion value, 3 by default.
2) Noise filter smooth factor, 16 by default.
3) Enable/Disable RSIPROv5 TrendIndicator algorythm
4) Setting RSI Overbought and Oversold values
5) Enable/Disable stop loss and take profit filter for indicator
6) Enable/Disable BB
Best fits for 30-60 min timeframe. Also good for 15min scalping strategy. Fits for any crypto coins, forex, metals, oil and bonds.
This is very powerfull script and will be private soon
RedK Volume-Accelerated Directional Energy Ratio (RedK VADER)The Volume-Accelerated Directional Energy Ratio (VADER) makes use of price moves (displacement) and the associated volume (effort) to estimate the positive (buying) and negative (selling) "energy" behind the scenes, enabling traders to "read the market action" in more details and adjust their trading decisions accordingly.
How does VADER work?
------------------------------------
I have always been a fan of technical analysis concepts that are simple, and that integrate both price action and volume together - The concept behind VADER is really a simple one.
Let's walk though it as we avoid getting too technical:
Large price moves that are associated with large volume means buyers (if the move is up) or sellers (when the move is down) are serious and are "in control" of the action
On the other hand, when the price moves are small but with large volume, it means there's a fight, or more of a balance of energy, between buying and selling.
Also when large price moves are associated with relatively limited volume, there's a lack of "energy" from either buyers or sellers - and moves likes these are usually short-lived.
The analogy with VADER, is that we look at price moves (change of close between 2 bars) as the displacement (or action result) and the associated volume as the "effort" behind this action -- Combining these 2 values together, the displacement and the effort, gives us a representation or a proxy of the underlying energy (in a specific direction).
when both values (displacement and effort) are high, then the resulting energy is high - and if one of these values are low, the resulting energy is low.
we then take an average of that relative energy in each direction (positive = buying and negative = selling) and calculate the net energy.
note that we're approaching the analogy here from a trading perspective and not from physics perspective :) -- we can be forgiven if the energy calculation in physics is different ..
VADER Plots
---------------------
the blue line with crosses represents the positive energy - or the buying strength
the orange line with circles represents the negative energy - or the selling strength
the thick Green / Red main line plot represents the net energy - and generally the main signal to be looking out for is when that line crosses 0 up or down - but i find it also very valuable to keep an eye on the individual energy lines as they sometimes "tell a story" like we see in the chart above,
Volume Calculation:
----------------------------
- VADER by default is a volume-weighted indicator - it uses the volume associated with change in bar close value (Full mode) as an accelerator in the calculation of the directional energy
- VADER introduces another method of integrating volume, by considering "relative" or "differential" volume (Relative mode) - in this mode, we consider the ratio of volume above the minimum volume observed within a "lookback" length - so practically, ignoring the minimum volume. in other words, if a price move is associated with very low volume, it gets very low "volume accelerator" (close to 0) and if the move is associated with very large volume, it gets the maximum volume accelerator (1 or close to 1) - The relative mode of volume calculation magnifies volume effect and ignores the low volume values that may just act as noise. test both modes and find which one works better for you.
- VADER also has the ability to work without volume (volume calculation = None) - and will revert to that mode when used with instruments that have no volume data. In that mode, VADER will behave similar to an RSI (but not exactly like it given the underlying calculation is different)
- We can also setup VADER at a specific resolution / timeframe that is different than the chart.
Using VADER & Other Thoughts
----------------------------------------
The main signal to look out for, is when VADER's Green / Red line crosses the zero line.
Green (above zero) represents that the net energy is with the buyers and we should favor long positions
Red (below zero) reflects that the sellers have control and we should favor short positions (or consider to close longs)
*** However, VADER should be used as a *secondary indicator* - given the big influence of volume on the calculation - VADER doesn't directly track price trend or momentum - VADER needs to be used in the context of other indicators that show trend and momentum - i would suggest you combine VADER with Moving Averages or other trend tracking indicators on the price chart, MACD, RSI and / or other trend and momentum indicators you're already familiar with.
Suggested setup:
There's more to add to VADER in future versions - alerts, control level, maybe improve visuals... etc - please share your feedback as you start experimenting with VADER.. good luck! (and of course, May the Force be with you :) )

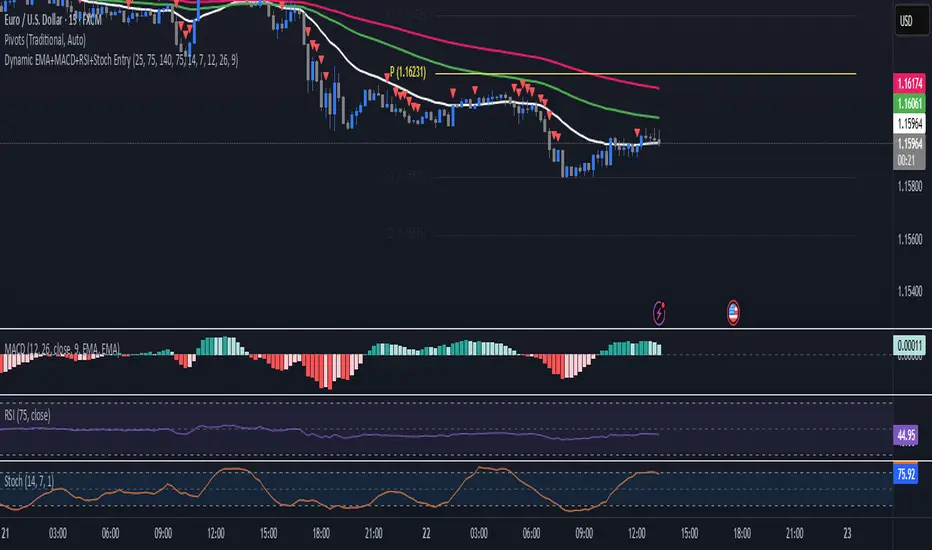
EMA+MACD+RSI+StochJust like SMA but EMA!
this EMA base indicator helps you to find the trend.
use pivot point standard for make better decesion on Long and Short
TF Alignment - Multi TF EMA/MACD/RSIThis is my first special indicator that aligns multiple timeframes.

Quantum Harmonic Oscillator Overlay🧪 Quantum Harmonic Oscillator Overlay
A visual model of price behavior using quantum harmonic oscillation principles
📜 Indicator Overview
The Quantum Harmonic Oscillator Overlay applies concepts from both classical physics (harmonic motion) and quantum mechanics (energy states) to model and visualize how price orbits around a central trend line. It overlays a Linear Regression line (representing the “mean position” or ground state of price) and calculates surrounding energy levels (σ-zones) akin to quantum shells that price can "jump" between.
This indicator is particularly useful for visualizing mean reversion, volatility compression/expansion, and momentum-driven price breakthroughs.
🧠 Core Concepts
Linear Regression Line (LSR): This is the calculated center of gravity or equilibrium path of price over a user-defined period. Think of it like the lowest energy state or central axis around which price vibrates.
Standard Deviation Zones (σ-levels):
1σ: The majority of normal price activity; within this range, price tends to fluctuate if in balance.
2σ: Indicates volatility or possible breakout pressure.
3σ: Represents extreme movement — a phase shift in energy, potentially leading to reversal or continuation with higher momentum.
Quantum Analogy: Just like in a quantum harmonic oscillator, particles (here, prices) move probabilistically between discrete energy states. The further the price moves from the center, the more "energy" (momentum, volume, volatility) is implied.
⚙️ Input Parameters
Setting Description
Linear Regression Length The number of bars used to calculate the regression trend (default 100). Affects the central path and responsiveness.
σ Multipliers (1σ, 2σ, 3σ) Determine how far each band is from the regression line. Adjusting these can highlight different price behaviors.
Show Energy Level Zones Toggle visibility of the colored bands around the regression line.
Show LSR Center Line Toggles visibility of the white Linear Regression line itself.
🎨 Visual Components
Color Zone Interpretation
✅ Green ±1σ Normal oscillation / mean reversion area. Ideal for range-bound strategies.
🟧 Orange ±2σ Warning zone; price may be gaining momentum or volatility.
🔴 Red ±3σ High-momentum state or anomaly. These regions may imply trend exhaustion, reversals, or breakouts.
White Line: The LSR — the average trajectory of the price movement.
Pink Dots: Appear when price exceeds Zone 3 (outside ±3σ) — a signal of extreme behavior or a possible regime shift.
📈 How to Use This Indicator
1. Detect Overextensions
When price touches or breaches the 3σ zone, it is likely overextended. This can be used to anticipate potential snapbacks or strong breakout trends.
2. Identify Mean Reversion Trades
If price exits the 2σ or 3σ zones and returns toward the center line, this signals a likely mean reversion setup.
3. Volatility Compression or Expansion
Flat zones between σ levels suggest calm markets; widening bands suggest expanding volatility.
4. Use with Confirmation Tools
Combine with momentum oscillators (MACD, RSI) or volume-based signals to confirm reversals or continuation outside Zone 3.
🔮 Philosophical Note
This indicator embodies the metaphor that the market behaves like a quantum oscillator — price particles exist in a probabilistic field and jump between discrete zones of volatility and energy. Tracking these transitions allows the trader to see price behavior as rhythmic, wave-like, and multidimensional rather than purely linear.

Support & Resistance AriesSupport & Resistance Aries
This indicator automatically identifies support and resistance levels based on the highest and lowest closing prices within a configurable period.
How it works:
The user sets a calculation period (default is 20 candles).
The indicator plots:
Green line = Support: lowest closing price within the period.
Red line = Resistance: highest closing price within the period.
Adjustable parameter:
Calculation Period (1 to 200): defines how many candles are used to find the price extremes.
Purpose:
Helps users quickly visualize dynamic support and resistance zones that adjust as price evolves, making it easier to identify areas for potential entries, exits, and stop placements.
Important:
This indicator should not be used as a standalone buy or sell signal, nor as a trend confirmation tool on its own.
It is recommended to use it in combination with other technical analysis tools such as MACD, RSI, Volume, Moving Averages, among others, for a more complete market view.
Disclaimer:
Investing involves financial risk. Be cautious with both profits and losses. Always define a stop loss to avoid larger losses if the trend reverses.
One of the golden rules in trading is: a trader should not lose more than 3% to 5% of their capital per trade. Protecting your capital should always be the priority.

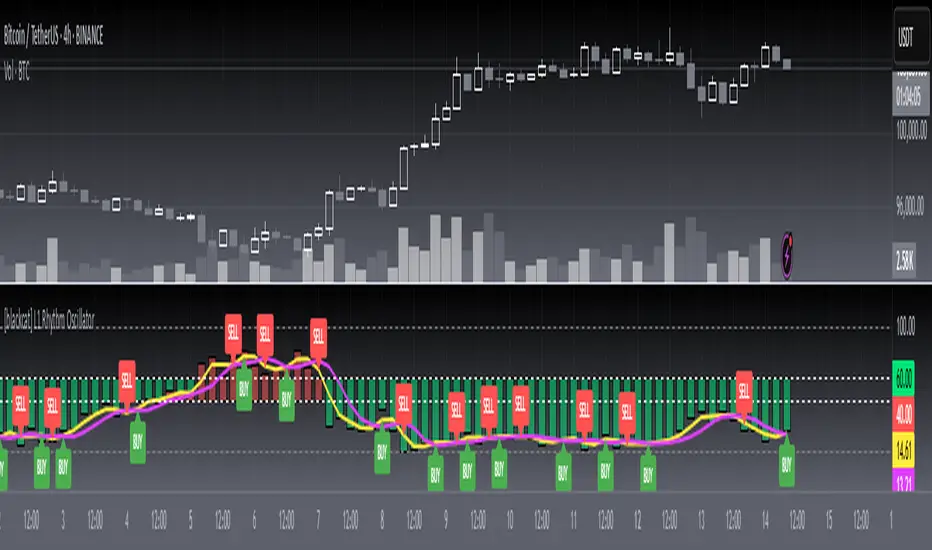
[blackcat] L1 Rhythm OscillatorOVERVIEW 📊💡
The L1 Rhythm Oscillator is an advanced oscillator designed to identify potential entry points in financial markets using a combination of Williams %R indicators and Time-Varying Moving Averages (TVMAs). This script provides traders with clear buy and sell signals that help them capitalize on trends while minimizing risk.
FEATURES 💡🌟
Williams %R Analysis:
Base Indicator (WR0): Measures overbought/oversold conditions within a specified period.
Smoothed Indicators (WR1 & WR2): Further refined versions of WR0 to filter out noise and highlight significant trends.
Dynamic Bands:
Bull Band: Shaded area between WR0 and the bullish threshold when WR0 falls below the defined level.
Bear Band: Shaded area between WR0 and the bearish threshold when WR0 exceeds the defined level.
Trading Signals:
Buy Signal: Generated when WR1 crosses above WR2, indicating a potential upward trend reversal.
Sell Signal: Triggered when WR1 crosses below WR2, suggesting a downward trend shift.
Thresholds:
Bull Threshold (default 60%): Marks levels where the asset is considered relatively undervalued.
Bear Threshold (default 40%): Indicates regions where the asset might be overvalued.
Visual Enhancements:
Colored Bands: Clearly distinguish between bullish and bearish areas.
Horizontal Lines: Provide quick reference points for overbought/oversold levels.
Labels: Display "BUY" and "SELL" markers at key signal locations.
HOW TO USE ⚙️📈
Add the Indicator to Your Chart:
Open your preferred asset's chart on TradingView.
Click on “Indicators” and search for “ L1 Rhythm Oscillator.”
Add the indicator to your chart.
Customize Parameters:
Adjust these inputs according to your trading strategy:
WR Period: Sets the lookback window for calculating Williams %R.
Bull Threshold: Defines the upper limit for bullish territory.
Bear Threshold: Establishes the lower boundary for bearish territory.
TVMA Length: Controls the sensitivity of the moving average used in calculations.
Interpret Visual Elements:
Yellow Line (WR1): The first smoothed version of the base Williams %R.
Fuchsia Line (WR2): The second smoothed line derived from WR1 via TVMA.
Lime-Shaded Area: Represents Bull Band where prices are potentially undervalued.
Red-Shaded Area: Symbolizes Bear Band indicating possible overvaluation.
Horizontal Lines:
Value 0% represents perfect overbought condition.
Value 100% indicates extreme oversold state.
Bull/Bear thresholds provide additional context for interpreting market sentiment.
Act on Crossovers:
Look for instances where WR1 crosses through WR2:
When WR1 moves above WR2 → Potential BUY opportunity.
When WR1 dips below WR2 → Likely SELL scenario.
Consider Contextual Factors:
Combine the oscillator signals with other technical indicators like MACD, RSI, or volume analysis for more robust decision-making.
Be aware of broader market trends and news events that could impact price movements.
Manage Risk:
Always use proper stop-loss orders to protect against adverse price movements.
Consider position sizing based on available capital and risk tolerance.
LIMITATIONS ⚠️🔍
Historical Data Dependency: Like most oscillators, this tool relies on past data patterns which may not always predict future behavior accurately.
False Signals: No single indicator can guarantee correct predictions; false positives/negatives can arise during volatile periods.
Overfitting Risks: Customized settings might work well historically but fail under different market conditions without careful validation.
Complexity: Multiple layers of smoothing and crossover logic require understanding to interpret correctly.
NOTES 🔍📝
Parameter Optimization: Experiment with various combinations of WR Period, Bull/Bear Thresholds, and TVMA Length to find what works best for specific assets and timeframes.
Regular Review: Continuously monitor the performance of the indicator versus actual outcomes, adjusting parameters as needed.
Educational Resources: Deepen your knowledge about oscillator strategies, particularly focusing on how they detect reversals and momentum shifts.
Consistency Key: For successful implementation, maintain consistent rules regarding trade entries/exits regardless of short-term fluctuations.
Weighted Ichimoku StrategyLSE:HSBA
The Ichimoku Kinko Hyo indicator is a comprehensive tool that combines multiple signals to identify market trends and potential buying/selling opportunities. My weighted variant of this strategy attempts to assign specific weights to each signal, allowing for a more nuanced and customizable approach to trend identification. The intent is to try and make a more informed trading decision based on the cumulative strength of various signals.
I've tried not to make it a mishmash of this and that + MACD + RSI and on and on; most people have their preferred indicator that focuses on just that that they can use in conjunction.
The signals used can be grouped into two groups the 'Core Ichimoku Signals' & the 'Additional Signals' (at the end you will find the signals and their assigned weights followed by the thresholds where they align).
The Core Ichimoku Signals are the primary signals used in Ichimoku analysis, including Kumo Breakout, Chikou Cross, Kijun Cross, Tenkan Cross, and Kumo Twist.
While the Additional Signals provide further insights and confirmations, such as Kijun Confirmation, Tenkan-Kijun Above Cloud, Chikou Above Cloud, Price-Kijun Cross, Chikou Span Signal, and Price Positioning.
Entries are triggered when the cumulative weight of bullish signals exceeds a specified buy threshold, indicating a strong uptrend or potential trend reversal.
Exits are initiated when the cumulative weight of bearish signals surpasses a specified sell threshold, or when additional conditions such as consolidation patterns or ATR-based targets are met.
There are various exit types that you can choose between, which can be used separately or in conjunction with one another. As an example you might want to exit on a different condition during consolidation periods than during other periods or just use ATR with some other backstop.
They are listed in evaluation order i.e. ATR trumps all, Consolidation exit trumps the regular Kumo sell and so on:
**ATR Sell**: Exits trades based on ATR-based profit targets and stop-losses.
**Consolidation Exit**: Exits trades during consolidation periods to reduce drawdown.
**Sell Below Kumo**: Exits trades when the price is below the Kumo, indicating a potential downtrend.
**Sell Threshold**: Exits trades when the cumulative weight of bearish signals surpasses a specified sell threshold.
There are various 'filters' which are really behavior modifiers:
**Kumo Breakout Filter**: Requires price to close above the Kumo for buy signals (essentially a entry delay).
**Whipsaw Filter**: Ensures trend strength over specified days to reduce false signals.
**Buy Cooldown**: Prevents new entries until half the Kijun period passes after an exit (prevents flapping).
**Chikou Filter**: Delays exits unless the previous close is below the Chikou Span.
**Consolidation Trend Filter**: Prevents consolidation exits if the trend is bullish (rare, but happens).
Then there are some debugging options. Ichimoku periods have some presets (personally I like 8/22/44/22) but are freely configurable, preset to the traditional values for purists.
The list of signals and most thresholds follow, play around with them. Thats all.
Cheers,
**Core Ichimoku Signals**
**Kumo Breakout**
- 30 (Bullish) / -30 (Bearish)
- Indicates a strong trend when the price breaks above (bullish) or below (bearish) the Kumo (cloud). This signal suggests a significant shift in market sentiment.
**Chikou Cross**
- 20 (Bullish) / -20 (Bearish)
- Shows the relationship between the Chikou Span (lagging span) and the current price. A bullish signal occurs when the Chikou Span is above the price, indicating a potential uptrend. Conversely, a bearish signal occurs when the Chikou Span is below the price, suggesting a downtrend.
**Kijun Cross**
- 15 (Bullish) / -15 (Bearish)
- Signals trend changes when the Tenkan-sen (conversion line) crosses above (bullish) or below (bearish) the Kijun-sen (base line). This crossover is often used to identify potential trend reversals.
**Tenkan Cross**
- 10 (Bullish) / -10 (Bearish)
- Indicates short-term trend changes when the price crosses above (bullish) or below (bearish) the Tenkan-sen. This signal helps identify minor trend shifts within the broader trend.
**Kumo Twist**
- 5 (Bullish) / -5 (Bearish)
- Shows changes in the Kumo's direction, indicating potential trend shifts. A bullish Kumo Twist occurs when Senkou Span A crosses above Senkou Span B, and a bearish twist occurs when Senkou Span A crosses below Senkou Span B.
**Additional Signals**
**Kijun Confirmation**
- 8 (Bullish) / -8 (Bearish)
- Confirms the trend based on the price's position relative to the Kijun-sen. A bullish signal occurs when the price is above the Kijun-sen, and a bearish signal occurs when the price is below it.
**Tenkan-Kijun Above Cloud**
- 5 (Bullish) / -5 (Bearish)
- Indicates a strong bullish trend when both the Tenkan-sen and Kijun-sen are above the Kumo. Conversely, a bearish signal occurs when both lines are below the Kumo.
**Chikou Above Cloud**
- 5 (Bullish) / -5 (Bearish)
- Shows the Chikou Span's position relative to the Kumo, indicating trend strength. A bullish signal occurs when the Chikou Span is above the Kumo, and a bearish signal occurs when it is below.
**Price-Kijun Cross**
- 2 (Bullish) / -2 (Bearish)
- Signals short-term trend changes when the price crosses above (bullish) or below (bearish) the Kijun-sen. This signal is similar to the Kijun Cross but focuses on the price's direct interaction with the Kijun-sen.
**Chikou Span Signal**
- 10 (Bullish) / -10 (Bearish)
- Indicates the trend based on the Chikou Span's position relative to past price highs and lows. A bullish signal occurs when the Chikou Span is above the highest high of the past period, and a bearish signal occurs when it is below the lowest low.
**Price Positioning**
- 10 (Bullish) / -10 (Bearish)
- Shows indecision when the price is between the Tenkan-sen and Kijun-sen, indicating a potential consolidation phase. A bullish signal occurs when the price is above both lines, and a bearish signal occurs when the price is below both lines.
**Confidence Level**: Highly Sensitive
- **Buy Threshold**: 50
- **Sell Threshold**: -50
- **Notes / Significance**: ~2–3 signals, very early trend detection. High sensitivity, may capture noise and false signals.
**Confidence Level**: Entry-Level
- **Buy Threshold**: 58
- **Sell Threshold**: -58
- **Notes / Significance**: ~3–4 signals, often Chikou Cross or Kumo Breakout. Very sensitive, risks noise (e.g., false buys in choppy markets).
**Confidence Level**: Entry-Level
- **Buy Threshold**: 60
- **Sell Threshold**: -60
- **Notes / Significance**: ~3–4 signals, Kumo Breakout or Chikou Cross anchors. Entry point for early trends.
**Confidence Level**: Moderate
- **Buy Threshold**: 65
- **Sell Threshold**: -65
- **Notes / Significance**: ~4–5 signals, balances sensitivity and reliability. Suitable for moderate risk tolerance.
**Confidence Level**: Conservative
- **Buy Threshold**: 70
- **Sell Threshold**: -70
- **Notes / Significance**: ~4–5 signals, emphasizes stronger confirmations. Reduces false signals but may miss some opportunities.
**Confidence Level**: Very Conservative
- **Buy Threshold**: 75
- **Sell Threshold**: -75
- **Notes / Significance**: ~5–6 signals, prioritizes high confidence. Minimizes risk but may enter trades late.
**Confidence Level**: High Confidence
- **Buy Threshold**: 80
- **Sell Threshold**: -80
- **Notes / Significance**: ~6–7 signals, very strong confirmations needed. Suitable for cautious traders.
**Confidence Level**: Very High Confidence
- **Buy Threshold**: 85
- **Sell Threshold**: -85
- **Notes / Significance**: ~7–8 signals, extremely high confidence required. Minimizes false signals significantly.
**Confidence Level**: Maximum Confidence
- **Buy Threshold**: 90
- **Sell Threshold**: -90
- **Notes / Significance**: ~8–9 signals, maximum confidence level. Ensures trades are highly reliable but may result in fewer trades.
**Confidence Level**: Ultra Conservative
- **Buy Threshold**: 100
- **Sell Threshold**: -100
- **Notes / Significance**: ~9–10 signals, ultra-high confidence. Trades are extremely reliable but opportunities are rare.
**Confidence Level**: Extreme Confidence
- **Buy Threshold**: 110
- **Sell Threshold**: -110
- **Notes / Significance**: All signals align, extreme confidence. Trades are almost certain but very few opportunities.
