Bias + VWAP Pullback — v4 (PA + BOS/CHOCH)Simple idea: I identify the trend (bias) from the larger timeframe, and only trade pullbacks to the VWAP/EMA during liquidity (London/New York). When the trend is clear, gold moves strongly, and its pullbacks to the balance lines provide clear opportunities.
Timeframe and Sessions (Cairo Time)
Analysis: H1 to determine the trend.
Implementation: 5m (or 1m if professional).
Trading window:
London Opening: 10:00–12:30
New York Opening: 16:30–19:00
(avoid the rest of the day unless there is exceptional traffic).
Direction determination (BIAS)
On H1:
If the price is above the 200 EMA and the daily VWAP is bullish and the price is above it → uptrend (long-only).
If the price is below the 200 EMA and the daily VWAP is bearish and the price is below it → bearish trend (short-only).
Determine your levels: yesterday's high/low (PDH/PDL) + approximate Asia range (03:00–09:30).
Entry Rules (Setup A: Trend Continuation)
Asia range breakout towards Bias during liquidity window.
Wait for a withdrawal to:
Daily VWAP, or
EMA50 on 5m frame (best if both cross).
Confirmation: Confirmation low/high on 5m (HL buy/LH sell) + clear impulse candle (Body is greater than average of last 10 candles).
Entry:
Buy: When the price returns above VWAP/EMA50 with a confirmation candle close.
Sell: The exact opposite.
Stop Loss (SL): Below/above the last confirmation low/high or ATR(14, 5m) x 1.5 (largest).
Objectives:
TP1 = 1R (Close 50% and move the rest Break-even).
TP2 = 2.5R to 3R or at an important HTF level (PDH/PDL/Bid/Demand Zone).
Entry Rules (Setup B: Reversion to VWAP – “Mean Reversion”)
Use with extreme caution, once daily maximum:
Price deviation from VWAP by more than ~1.5 x ATR(14, 5m) with rejection candles appearing near PDH/PDL.
Reverse entry towards the return of VWAP.
SL small behind rejection top/bottom.
Main target: VWAP. (Don't get greedy — this scenario is for extended periods only.)
News Filtering and Risk Management
Avoid trading 15–30 minutes before/after strong US news (CPI, NFP, FOMC).
Maximum daily loss: 1.5–2% of account balance.
Risk per trade: 0.25–0.5% (if you are learning) or 0.5–1% (if you are experienced).
Do not exceed two consecutive losing trades per day.
Don't chase the market after the opportunity has passed — wait for the next pullback.
Smart Deal Management
After TP1: Move stop to entry point + trail the rest with EMA20 on 5m or ATR Trailing = ATR(14)×1.0.
If the price touches a strong daily level (PDH/PDL) and fails to break, consider taking additional profit.
If VWAP starts to flatten and breaks against the trend on H1, stop trading for the day.
Quick Checklist (Before Entry)
H1 trend is clear and consistent with 200EMA + VWAP.
Penetrating the Asia range towards Bias.
Clean pull to VWAP/EMA50 on 5m.
Confirmation candle and real push.
SL is logical (behind swing/ATR×1.5) and R :R ≥ 1:2.
No red news coming soon.
Example of "ready-made" settings
EMA: 20, 50, 200 on 5m, 200 only on H1.
VWAP: Daily (reset daily).
ATR: 14 on 5m.
Levels: PDH/PDL + Asia Band (03:00–09:30 Cairo).
Gold Notes
Gold is fast and sharp at the open; don't get in early — wait for the draw.
Fakeouts are common before news: it is best to call with the trend after the price returns above/below VWAP.
Don't expect 80% consistent wins every day — the advantage comes from discipline, filtering out bad days, and only withdrawing when you're on the right track.
تعتبر شركة الماسة الألمانية أحد المؤسسات العاملة بالمملكة العربية السعودية ولها تاريخ طويل من الخدمات الكثيرة والمتنوعة التى مازالت تقدمها للكثير من العملاء داخل جميع مدن وأحياء المملكة حيث نقدم أفضل ما لدينا من خلال مجموعة الشركات التالية والتي من خلالها ستتلقي كل ما تحتاج إلية في كل المجال المختلفة فنحن نعمل منذ عام 2015 ولنا سابقات اعمال فى مختلف المجالات الحيوية التى نخدم من خلالها عملائنا ونوفر لهم أرخص الأسعار وبأعلى جودة من الممكن توفرها فى المجالات التالية :-
خدمات تنظيف المنازل والفلل والشقق
خدمات عزل الخزانات تنظيف غسيل صيانة اصلاح
خدمات جلي البلاط والرخام والسيراميك
خدمات نقل العفش عمالة فلبينية مدربة
خدمات مكافحة الحشرات بجدة
كل هذة الخدمات وأكثر نوفرها لكل المتعاقدين بأفضل الطرق مع توفير خطط وبرامج متنوعة لأتمام العمل المسنود إلينا بأفضل وأحدث الطرق الحديثة والعصرية سواء فى شركات النظافة بجدة ومكة المكرمة أو شركات نقل العفش بجدة عمالة فلبينية وباقى الخدمات مثل جلي وتلميع الرخام بمكة وجدة ولا ننسي شركة مكافحة حشرات بجدة التى ساعدت آلاف المواطنين على تنظيف منازلهم من الحشرات بأفضل مبيدات حشرية.
在腳本中搜尋"恒生指数期货+cfd"

Ease of Movement 2.0Ease of movement EoM is how easy it is for the price to move and stay where it moved to.
This indicator is the square of the True Range (i.e. distance of price travelled between the current close and the close of the previous bar, squared) relative to the volume of the current bar. -2, -1, +1, and +2 standard deviations, and the average are all based on n=14.
E.g., if an EoM up occurs after failed attempts to mark prices down, it suggests continuation of prices to the upside.

Liquidity Void Detector (Zeiierman)█ Overview
Liquidity Void Detector (Zeiierman) is an oscillator highlighting inefficient price displacements under low participation. It measures the most recent price move (standardized return) and amplifies it only when volume is below its own trend.
Positive readings ⇒ strong up-move on low volume → potential Buy-Side Imbalance (void below) that often refills.
Negative readings ⇒ strong down-move on low volume → potential Sell-Side Imbalance (void above) that often refills.
This tool provides a quantitative “void” proxy: when price travels far with unusually thin volume, the move is flagged as likely inefficient and prone to mean-reversion/mitigation.
█ How It Works
⚪ Volume Shock (Participation Filter)
Each bar, volume is compared to a rolling baseline. This is then z-scored.
// Volume Shock calculation
volTrend = ta.sma(volume, L)
vs = (volume > 0 and volTrend > 0) ? math.log(volume) - math.log(volTrend) : na
vsZ = zScore(vs, vzLen) // z-scored volume shock
lowVS = (vsZ <= vzThr) // low-volume condition
Bars with VolShock Z ≤ threshold are treated as low-volume (thin).
⚪ Prior Return Extremeness
The 1-bar log return is computed and z-scored.
// Prior return extremeness
r1 = math.log(close / close )
retZ = zScore(r1, rLen) // z-scored prior return
This shows whether the latest move is unusually large relative to recent history.
⚪ Void Oscillator
The oscillator is:
// Oscillator construction
weight = lowVS ? 1.0 : fadeNoLow
osc = retZ * weight
where Weight = 1 when volume is low, otherwise fades toward a user-set factor (0–1).
Osc > 0: up-move emphasized under low volume ⇒ Buy-Side Imbalance.
Osc < 0: down-move emphasized under low volume ⇒ Sell-Side Imbalance.
█ Why Use It
⚪ Targets Inefficient Moves
By filtering for low participation, the oscillator focuses on moves most likely driven by thin books/noise trading, which are statistically more likely to retrace.
⚪ Simple, Robust Logic
No need for tick data or order-book depth. It derives a practical void proxy from OHLCV, making it portable across assets and timeframes.
⚪ Complements Price-Action Tools
Use alongside FVG/imbalance zones, key levels, and volume profile to prioritize voids that carry the highest reversal probability.
█ How to Use
Sell-Side Imbalance = aggressive sell move (price goes down on low volume) → expect price to move up to fill it.
Buy-Side Imbalance = aggressive buy move (price goes up on low volume) → expect price to move down to fill it.
█ Settings
Volume Baseline Length — Bars for the volume trend used in VolShock. Larger = smoother baseline, fewer low-volume flags.
Vol Shock Z-Score Lookback — Bars to standardize VolShock; larger = smoother, fewer extremes.
Low-Volume Threshold (VolShock Z ≤) — Defines “thin participation.” Typical: −0.5 to −1.0.
Return Z-Score Lookback — Bars to standardize the 1-bar log return; larger = smoother “extremeness” measure.
Fade When Volume Not Low (0–1) — Weight applied when volume is not low. 0.00 = ignore non-low-volume bars entirely. 1.00 = treat volume condition as irrelevant (pure return extremeness).
Upper Threshold (Osc ≥) — Trigger for Sell-Side Imbalance (void below).
Lower Threshold (Osc ≤) — Trigger for Buy-Side Imbalance (void above).
-----------------
Disclaimer
The content provided in my scripts, indicators, ideas, algorithms, and systems is for educational and informational purposes only. It does not constitute financial advice, investment recommendations, or a solicitation to buy or sell any financial instruments. I will not accept liability for any loss or damage, including without limitation any loss of profit, which may arise directly or indirectly from the use of or reliance on such information.
All investments involve risk, and the past performance of a security, industry, sector, market, financial product, trading strategy, backtest, or individual's trading does not guarantee future results or returns. Investors are fully responsible for any investment decisions they make. Such decisions should be based solely on an evaluation of their financial circumstances, investment objectives, risk tolerance, and liquidity needs.

ICT Largest Midnight–00:30 FVG (NY, 1 per day) — FIXEDmarks out the first and largest fvg on the 1 min chart from midnight open until 12:30 am est

Risk controlRisk control.
The indicator displays lines at a distance of % from the current price specified in the parameters. This risk is taken as 100% of the volume. Additionally, the max/min of the visible part of the chart is determined. The distance from the current price to the min/max is calculated in % and the ratio of the risk specified in the parameters to the risk to the min/max is displayed in 10% increments. The indicator is calculated based on the visible part of the chart on the screen. The direction of visualization depends on the visible part of the chart: if the opening price of the first candle is > the current price, visualization is from the minimum, otherwise from the maximum.
Required parameters: risk in %.
Visualization: line offset to the left/right, line color and thickness. Additional: table of 3 cells (background, font size and color).

CVD ema filtered 3.0This indicator is based on CVD Cumulative Volume Delta.
In this version the lines stop after a certain number of touches.
You can also choose the color for the bullish and bearish lines.

CyberFX EMA21 Strategy (Pine v5)This is a simple indicator that can be used for a simple strategy. It follows the logic of the price always move back to the media, in that case an EMA(21). This give us an opportunity to achieve a better R/R. One important thing here is this indicator works better on trend markets. When the market is in consolidation mode it will show many signals so we need to pay attention and be patient. This indicator works better in 4H timeframes but it can used with other TFs.
The idea behind is:
for a bullish move when the price moves back to the EMA(21) we check the distance between the low value and the EMA(21) value. The best is when the price low crosses the EMA(21) from above. I am considering a 8 pips distance from the price low to the ema as a signal. Then I will wait for the new candle to move above the EMA(21) for a long entry. I also consider at least 50 pips for SL.
for a bearish move the idea is the same but we consider the price high crossing the EMA(21) and the new candle moving below the EMA.
I hope this can be useful and please leave your comment nad critics(but only the constructive one).
Have a safe trade

Thần Tiên / Hạ Phàm (MTF)🔔 Thần Tiên / Hạ Phàm (MTF) Indicator – modified & optimized for real trading practice.
✅ For educational and reference purposes only – not financial advice.
📩 To get the optimized settings & detailed trading strategy, contact me on Telegram: @NDucnhan79


Average True Range DisplayThis is a simple number on the screen showing current timeframes average true range.


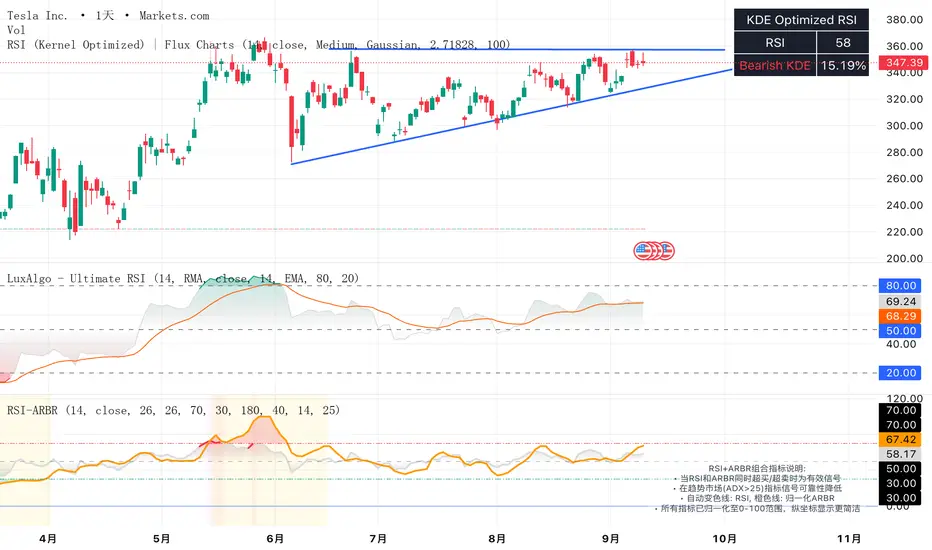
RSI + ARBR 组合指标The RSI + ARBR indicator mainly harmonizes the values of the two indicators, enabling investors to exit at market tops or buy at market bottoms when market sentiment surges or collapses.
### 补充说明:
- **RSI**:全称为Relative Strength Index(相对强弱指数),是常用的技术分析指标,用于衡量市场多空双方力量的对比。
- **ARBR**:由AR(Activity Ratio,人气指标)和BR(Buying Ratio,意愿指标)两个子指标组成,主要反映市场交易的活跃程度和投资者的买卖意愿。
- 句中“逃顶”译为“exit at market tops”,“抄底”译为“buy at market bottoms”,均为金融领域常用表达,准确对应“在高位卖出规避风险”和“在低位买入等待上涨”的操作含义。
cd_Quarterly_cycles_SSMT_TPD_CxGeneral
This indicator is designed in line with the Quarterly Theory to display each cycle on the chart, either boxed and/or in candlestick form.
Additionally, it performs inter-cycle divergence analysis ( SSMT ) with the correlated symbol, Terminus Price Divergence ( TPD ), Precision Swing Point ( PSP ) analysis, and potential Power of Three ( PO3 ) analysis.
Special thanks to @HandlesHandled for his great indicator, which I used while preparing the cycles content.
Details & Usage:
Optional cycles available: Weekly, Daily, 90m, and Micro cycles.
Displaying/removing cycles can be controlled from the menu (cycles / candles / labels).
All selected cycles can be shown, or you can limit the number of displayed cycles (min: 2, max: 4).
The summary table can be toggled on/off and repositioned.
What’s in the summary table?
• Below the header, the correlated symbol used in the analysis is displayed (e.g., SSMT → US500).
• If available, live and previous bar results of the SSMT analysis are shown.
• Under the PSP & TPD section, results are displayed when conditions are met.
• Under Alerts, the real-time status of conditions defined in the menu is shown.
• Under Potential AMD, possible PO3 analysis results are displayed.
Analysis & Symbol Selection:
To run analyses, a correlated symbol must first be defined with the main symbol.
Default pairs are preloaded (see below), but users should adjust them according to their exchange and instruments.
If no correlated pair is defined, cycles are displayed only as boxes/candles.
Once defined pairs are opened on the chart, analyses load automatically.
Pairs listed on the same row in the menu are automatically linked, so no need to re-enter them across rows.
SSMT Analysis:
Based on the chart’s timeframe, divergences are searched across Weekly, Daily, 90m, and Micro cycles.
The code will not produce results for smaller cycles than the current timeframe.
(Example: On H1, Micro cycles will not be displayed.)
Results are obtained by comparing the highs and lows of consecutive cycles in the same period.
If one pair makes a new high/low while the other does not, this divergence is added to SSMT results.
The difference from classic SMT is that cycles are used instead of bars.
PSP & TPD Analysis:
A correlated symbol must be defined.
For PSP, timeframe options are added to the menu.
Users toggle timeframes on/off by checking/unchecking boxes.
In selected timeframes, PSP & TPD analysis is performed.
• PSP: If candlesticks differ in color (bullish/bearish) between symbols and the bar is at a high/low of the timeframe (and higher/lower than the bars before/after it), it is identified as a PSP. Divergences between pairs are interpreted as potential reversal signals.
• TPD: Once a PSP occurs, the closing price of the previous bar and the opening price of the next bar are compared. If one symbol shows continuation while the other does not, it is marked as a divergence.
Example:
Let’s assume Pair 1 and Pair 2 are selected in the menu with the H4 timeframe, and our cycle is Weekly (Box).
For Pair 1, the H4 candle at the Weekly high level:
• Is positioned at the Weekly high,
• Its high is above both the previous and the next candle,
• It closed bearish (open > close).
For Pair 2, the same H4 candle closed bullish (close > open).
→ PSP conditions are met.
For TPD, we now check the candles before and after this PSP (H4) candle on both pairs.
Comparing the previous candle’s close with the next candle’s open, we see that:
• In Pair 1, the next open is lower than the previous close,
• In Pair 2, the next open is higher than the previous close.
Pair 1 → close > open
Pair 2 → close < open
Since they are not aligned in the same direction, this is interpreted as a divergence — a potential reversal signal.
While TPD results are displayed in the summary table, whenever the conditions are met in the selected timeframes, the signals are also plotted directly on the chart. (🚦, X)
• Higher timeframe TPD example:
• Current timeframe TPD example:
Alerts:
The indicator can be conditioned based on aligned timeframes defined within the concept.
Example (assuming random active rows in the screenshot):
• Weekly Bullish SSMT → Tf2 (menu-selected) Bullish TPD → Daily Bullish SSMT.
Selecting “none” in the menu means that condition is not required.
When an alert is triggered, it will be displayed in the corresponding row of the table.
• Example with only condition 3 enabled:
Potential PO3 Analysis:
According to Quarterly Theory, price moves in cycles, and the same structures are assumed to continue in smaller timeframes.
From classical PO3 knowledge: before the main move, price first manipulates in the opposite direction to trap buyers/sellers, then makes its true move.
The cyclical sequence is:
(A)ccumulation → (M)anipulation → (D)istribution → (R)eversal / Continuation.
Within cycle candles, the first letter of each phase is displayed.
So how does the analysis work?
If the active cycle is in (M)anipulation or (D)istribution phase, and it sweeps the previous cycle’s high or low but then pulls back inside, this is flagged in the summary table as a possible PO3 signal.
In other words, it reflects the alignment of theoretical sequence with real-time price action.
Confluence with SSMT and TPD conditions further strengthens the expectation.
Final Note:
No single marking or alert carries meaning on its own — it must always be evaluated in the context of your concept knowledge.
Instead of trading purely on expectations, align bias + trend + entry confirmations to improve your success rate.
Feedback and suggestions are welcome.
Happy trading!

Dynamic Swing Anchored VWAP STRAT (Zeiierman/PineIndicators)Dynamic Swing Anchored VWAP STRATEGY — Zeiierman × PineIndicators (Pine Script v6)
A pivot-to-pivot Anchored VWAP strategy that adapts to volatility, enters long on bullish structure, and closes on bearish structure. Built for TradingView in Pine Script v6.
Full credits to zeiierman.
Repainting notice: The original indicator logic is repainting. Swing labels (HH/HL/LH/LL) are finalized after enough bars have printed, so labels do not occur in real time. It is not possible to execute at historical label points. Treat results as educational and validate with Bar Replay and paper trading before considering any discretionary use.
Concept
The script identifies swing highs/lows over a user-defined lookback ( Swing Period ). When structure flips (most recent swing low is newer than the most recent swing high, or vice versa), a new regime begins.
At each confirmed pivot, a fresh Anchored VWAP segment is started and updated bar-by-bar using an EWMA-style decay on price×volume and volume.
Responsiveness is controlled by Adaptive Price Tracking (APT) . Optionally, APT auto-adjusts with an ATR ratio so that high volatility accelerates responsiveness and low volatility smooths it.
Longs are opened/held in bullish regimes and closed when the regime turns bearish. No short positions are taken by design.
How it works (under the hood)
Swing detection: Uses ta.highestbars / ta.lowestbars over prd to update swing highs (ph) and lows (pl), plus their bar indices (phL, plL).
Regime logic: If phL > plL → bullish regime; else → bearish regime. A change in this condition triggers a re-anchor of the VWAP at the newest pivot.
Adaptive VWAP math: APT is converted to an exponential decay factor ( alphaFromAPT ), then applied to running sums of price×volume and volume, producing the current VWAP estimate.
Rendering: Each pivot-anchored VWAP segment is drawn as a polyline and color-coded by regime. Optional structure labels (HH/HL/LH/LL) annotate the swing character.
Orders: On bullish flips, strategy.entry("L") opens/maintains a long; on bearish flips, strategy.close("L") exits.
Inputs & controls
Swing Period (prd) — Higher values identify larger, slower swings; lower values catch more frequent pivots but add noise.
Adaptive Price Tracking (APT) — Governs the VWAP’s “half-life.” Smaller APT → faster/closer to price; larger APT → smoother/stabler.
Adapt APT by ATR ratio — When enabled, APT scales with volatility so the VWAP speeds up in turbulent markets and slows down in quiet markets.
Volatility Bias — Tunes the strength of APT’s response to volatility (above 1 = stronger effect; below 1 = milder).
Style settings — Colors for swing labels and VWAP segments, plus line width for visibility.
Trade logic summary
Entry: Long when the swing structure turns bullish (latest swing low is more recent than the last swing high).
Exit: Close the long when structure turns bearish.
Position size: qty = strategy.equity / close × 5 (dynamic sizing; scales with account equity and instrument price). Consider reducing the multiplier for a more conservative profile.
Recommended workflow
Apply to instruments with reliable volume (equities, futures, crypto; FX tick volume can work but varies by broker).
Start on your preferred timeframe. Intraday often benefits from smaller APT (more reactive); higher timeframes may prefer larger APT (smoother).
Begin with defaults ( prd=50, APT=20 ); then toggle “Adapt by ATR” and vary Volatility Bias to observe how segments tighten/loosen.
Use Bar Replay to watch how pivots confirm and how the strategy re-anchors VWAP at those confirmations.
Layer your own risk rules (stops/targets, max position cap, session filters) before any discretionary use.
Practical tips
Context filter: Consider combining with a higher-timeframe bias (e.g., daily trend) and using this strategy as an entry timing layer.
First pivot preference: Some traders prefer only the first bullish pivot after a bearish regime (and vice versa) to reduce whipsaw in choppy ranges.
Deviations: You can add VWAP deviation bands to pre-plan partial exits or re-entries on mean-reversion pulls.
Sessions: Session-based filters (RTH vs. ETH) can materially change behavior on futures and equities.
Extending the script (ideas)
Add stops/targets (e.g., ATR stop below last swing low; partial profits at k×VWAP deviation).
Introduce mirrored short logic for two-sided testing.
Include alert conditions for regime flips or for price-VWAP interactions.
Incorporate HTF confirmation (e.g., only long when daily VWAP slope ≥ 0).
Throttle entries (e.g., once per regime flip) to avoid over-trading in ranges.
Known limitations
Repainting: Swing labels and pivot confirmations depend on future bars; historical labels can look “perfect.” Treat them as annotations, not executable signals.
Execution realism: Strategy includes commission and slippage fields, yet actual fills differ by venue/liquidity.
No guarantees: Past behavior does not imply future results. This publication is for research/education only and not financial advice.
Defaults (backtest environment)
Initial capital: 10,000
Commission value: 0.01
Slippage: 1
Overlay: true
Max bars back: 5000; Max labels/polylines set for deep swing histories
Quick checklist
Add to chart and verify that the instrument has volume.
Use defaults, then tune APT and Volatility Bias with/without ATR adaptation.
Observe how each pivot re-anchors VWAP and how regime flips drive entries/exits.
Paper trade across several symbols/timeframes before any discretionary decisions.
Attribution & license
Original indicator concept and logic: Zeiierman — please credit the author.
Strategy wrapper and publication: PineIndicators .
License: CC BY-NC-SA 4.0 (Attribution-NonCommercial-ShareAlike). Respect the license when forking or publishing derivatives.

RSI Momentum Trend MM with Risk Per Trade [MTF]This is a comprehensive and highly customizable trend-following strategy based on RSI momentum. The core logic identifies strong directional moves when the RSI crosses user-defined thresholds, combined with an EMA trend confirmation. It is designed for traders who want granular control over their strategy's parameters, from signal generation to risk management and exit logic.
This script evolves a simple concept into a powerful backtesting tool, allowing you to test various money management and trade management theories across different timeframes.
Key Features
- RSI Momentum Signals: Uses RSI crosses above a "Positive" level or below a "Negative" level to generate trend signals. An EMA filter ensures entries align with the immediate trend.
- Multi-Timeframe (MTF) Analysis: The core RSI and EMA signals can be calculated on a higher timeframe (e.g., using 4H signals to trade on a 1H chart) to align trades with the larger trend. This feature helps to reduce noise and improve signal quality.
Advanced Money Management
- Risk per Trade %: Calculate position size based on a fixed percentage of equity you want to risk per trade.
- Full Equity: A more aggressive option to open each position with 100% of the available strategy equity.
Flexible Exit Logic: Choose from three distinct exit strategies to match your trading style
- Percentage (%) Based: Set a fixed Stop Loss and Take Profit as a percentage of the entry price.
- ATR Multiplier: Base your Stop Loss and Take Profit on the Average True Range (ATR), making your exits adaptive to market volatility.
- Trend Reversal: A true trend-following mode. A long position is held until an opposite "Negative" signal appears, and a short position is held until a "Positive" signal appears. This allows you to "let your winners run."
Backtest Date Range Filter: Easily configure a start and end date to backtest the strategy's performance during specific market periods (e.g., bull markets, bear markets, or high-volatility periods).
How to Use
RSI Settings
- Higher Timeframe: Set the timeframe for signal calculation. This must be higher than your chart's timeframe.
- RSI Length, Positive above, Negative below: Configure the core parameters for the RSI signals.
Money Management
Position Sizing Mode
- Choose "Risk per Trade" to use the Risk per Trade (%) input for precise risk control.
- Choose "Full Equity" to use 100% of your capital for each trade.
- Risk per Trade (%): Define the percentage of your equity to risk on a single trade (only works with the corresponding sizing mode).
SL/TP Calculation Mode
Select your preferred exit method from the dropdown. The strategy will automatically use the relevant inputs (e.g., % values, ATR Multiplier values, or the trend reversal logic).
Backtest Period Settings
Use the Start Date and End Date inputs to isolate a specific period for your backtest analysis.
License & Disclaimer
© waranyu.trkm — MIT License.
This script is for educational purposes only and should not be considered financial advice. Trading involves significant risk, and past performance is not indicative of future results. Always conduct your own research and risk assessment before making any trading decisions.

Cumulative Returns by Session [BackQuant]Cumulative Returns by Session
What this is
This tool breaks the trading day into three user-defined sessions and tracks how much each session contributes to return, volatility, and volume. It then aggregates results over a rolling window so you can see which session has been pulling its weight, how streaky each session has been, and how sessions relate to one another through a compact correlation heatmap.
We’ve also given the functionality for the user to use a simplified table, just by switching off all settings they are not interested in.
How it works
1) Session segmentation
You define APAC, EU, and US sessions with explicit hours and time zones. The script detects when each session starts and ends on every intraday bar and records its open, intraday high and low, close, and summed volume.
2) Per-session math
At each session end the script computes:
Return — either Percent: (Close−Open)÷Open×100(Close − Open) ÷ Open × 100(Close−Open)÷Open×100 or Points: (Close−Open)(Close − Open)(Close−Open), based on your selection.
Volatility — either Range: (High−Low)÷Open×100(High − Low) ÷ Open × 100(High−Low)÷Open×100 or ATR scaled by price: ATR÷Open×100ATR ÷ Open × 100ATR÷Open×100.
Volume — total volume transacted during that session.
3) Storage and lookback
Each day’s three session stats are stored as a row. You choose how many recent sessions to keep in memory. The script then:
Builds cumulative returns for APAC, EU, US across the lookback.
Computes averages, win rates, and a Sharpe-like ratio avgreturn÷avgvolatilityavg return ÷ avg volatilityavgreturn÷avgvolatility per session.
Tracks streaks of positive or negative sessions to show momentum.
Tracks drawdowns on cumulative returns to show worst runs from peak.
Computes rolling means over a short window for short-term drift.
4) Correlation heatmap
Using the stored arrays of session returns, the script calculates Pearson correlations between APAC–EU, APAC–US, and EU–US, and colors the matrix by strength and sign so you can spot coupling or decoupling at a glance.
What it plots
Three lines: cumulative return for APAC, EU, US over the chosen lookback.
Zero reference line for orientation.
A statistics table with cumulative %, average %, positive session rate, and optional columns for volatility, average volume, max drawdown, current streak, return-to-vol ratio, and rolling average.
A small correlation heatmap table showing APAC, EU, US cross-session correlations.
How to use it
Pick the asset — leave Custom Instrument empty to use the chart symbol, or point to another symbol for cross-asset studies.
Set your sessions and time zones — defaults approximate APAC, EU, and US hours, but you can align them to exchange times or your workflow.
Choose calculation modes — Percent vs Points for return, Range vs ATR for volatility. Points are convenient for futures and fixed-tick assets, Percent is comparable across symbols.
Decide the lookback — more sessions smooths lines and stats; fewer sessions makes the tool more reactive.
Toggle analytics — add volatility, volume, drawdown, streaks, Sharpe-like ratio, rolling averages, and the correlation table as needed.
Why session attribution helps
Different sessions are driven by different flows. Asia often sets the overnight tone, Europe adds liquidity and direction changes, and the US session can dominate range expansion. Separating contributions by session helps you:
Identify which session has been the main driver of net trend.
Measure whether volatility or volume is concentrated in a specific window.
See if one session’s gains are consistently given back in another.
Adapt tactics: fade during a mean-reverting session, press during a trending session.
Reading the tables
Cumulative % — sum of session returns over the lookback. The sign and slope tell you who is carrying the move.
Avg Return % and Positive Sessions % — direction and hit rate. A low average but high hit rate implies many small moves; the reverse implies occasional big swings.
Avg Volatility % — typical intrabars range for that session. Compare with Avg Return to judge efficiency.
Return/Vol Ratio — return per unit of volatility. Higher is better for stability.
Max Drawdown % — worst cumulative give-back within the lookback. A quick way to spot riskiness by session.
Current Streak — consecutive up or down sessions. Useful for mean-reversion or regime awareness.
Rolling Avg % — short-window drift indicator to catch recent turnarounds.
Correlation matrix — green clusters indicate sessions tending to move together; red indicates offsetting behavior.
Settings overview
Basic
Number of Sessions — how many recent days to include.
Custom Instrument — analyze another ticker while staying on your current chart.
Session Configuration and Times
Enable or hide APAC, EU, US rows.
Set hours per session and the specific time zone for each.
Calculation Methods
Return Calculation — Percent or Points.
Volatility Calculation — Range or ATR; ATR Length when applicable.
Advanced Analytics
Correlation, Drawdown, Momentum, Sharpe-like ratio, Rolling Statistics, Rolling Period.
Display Options and Colors
Show Statistics Table and its position.
Toggle columns for Volatility and Volume.
Pick individual colors for each session line and row accents.
Common applications
Session bias mapping — find which window tends to trend in your market and plan exposure accordingly.
Strategy scheduling — allocate attention or risk to the session with the best return-to-vol ratio.
News and macro awareness — see if correlation rises around central bank cycles or major data releases.
Cross-asset monitoring — set the Custom Instrument to a driver (index future, DXY, yields) to see if your symbol reacts in a particular session.
Notes
This indicator works on intraday charts, since sessions are defined within a day. If you change session clocks or time zones, give the script a few bars to accumulate fresh rows. Percent vs Points and Range vs ATR choices affect comparability across assets, so be consistent when comparing symbols.
Session context is one of the simplest ways to explain a messy tape. By separating the day into three windows and scoring each one on return, volatility, and consistency, this tool shows not just where price ended up but when and how it got there. Use the cumulative lines to spot the steady driver, read the table to judge quality and risk, and glance at the heatmap to learn whether the sessions are amplifying or canceling one another. Adjust the hours to your market and let the data tell you which session deserves your focus.

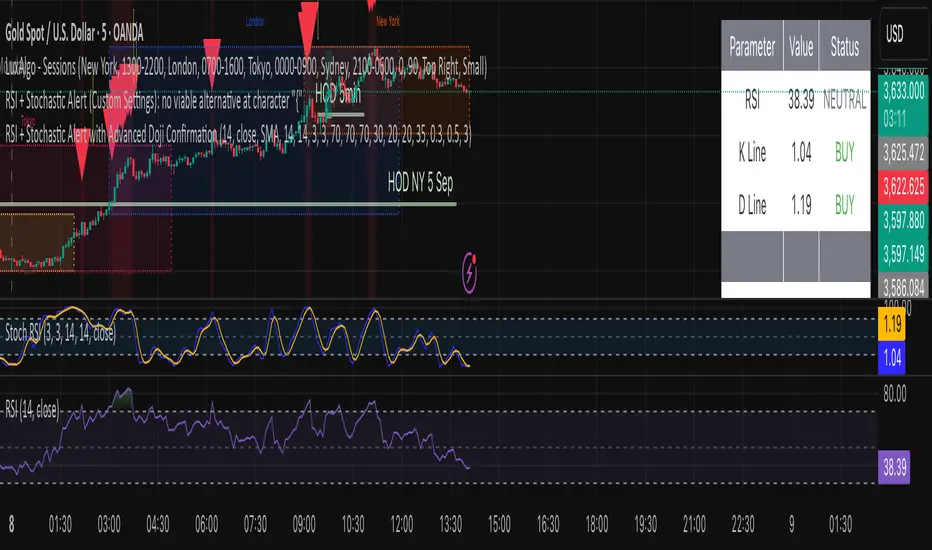
by A.Alasfoor RSI + Stochastic Alert with Doji Confirmationa buy and sell signals upon :
1- Sell : red hammer break (lower body) of 5min , ensure the wick is equal to or longer than the red body range.
2- Buy: Green hammer (upper body) break of 5min , ensure the wick is equal to or longer than the red body range.
Trigger buy/sell upon the break clean at 1min of the body closing level, risking (SL) the earlier 1 min tops/lows.
Credits to Ahmed Alasfoor & Zakariya Hamad AlJulandani by Sumou Oman
RSI + Stochastic Alert with Advanced Doji ConfirmationCredits to Ahmed Alasfoor and Somou by Zakariya Hamad AlJulandani
Custom Time Range HighlightThis indicator highlights specific time ranges on your TradingView chart with customizable background colors and labels, making it easier to identify key trading sessions and ICT (Inner Circle Trader) Killzones. It is designed for traders who want to mark important market hours, such as major sessions (Asia, New York, London) or high-volatility Killzones, with full control over activation, timing, colors, and transparency.
Features
Customizable Time Ranges: Define up to 9 different time ranges, including one custom range, three major market sessions (Asia, New York, London), and five ICT Killzones (Asia, NY Open, NY Close, London Open, London Close).
Individual Activation: Enable or disable each time range independently via checkboxes in the settings. By default, only the ICT Killzones are active.
Custom Colors and Transparency: Set unique background and label colors for each range, with adjustable transparency for both.
Labeled Time Ranges: Each active range is marked with a customizable label at the start of the period, displayed above the chart for easy identification.
Priority Handling: If multiple ranges overlap, the range with the higher number (e.g., Asia Killzone over Custom Range) determines the background color.
CET Time Zone: Time ranges are based on Central European Time (CET, Europe/Vienna). Adjust the hours and minutes to match your trading needs.
Settings
The indicator settings are organized into three groups for clarity:
Custom Range: A flexible range (default: 15:30–18:00 CET) for user-defined periods.
Session - Asia, NY, London: Major market sessions (Asia: 01:00–10:00, New York: 14:00–23:00, London: 09:00–18:00 CET).
ICT Killzones - Asia, NY, London: High-volatility periods (NY Open: 13:00–16:00, NY Close: 20:00–23:00, London Open: 08:00–11:00, London Close: 16:00–18:00, Asia: 02:00–05:00 CET).
For each range, you can:
Toggle activation (default: only ICT Killzones enabled).
Adjust start and end times (hours and minutes).
Customize the label text.
Choose background and label colors with transparency levels (0–100).
How to Use
Add the indicator to your chart.
Open the settings to enable/disable specific ranges, adjust their times, or customize colors and labels.
The chart will highlight active time ranges with the selected background colors and display labels at the start of each range.
Use it to focus on key trading periods, such as ICT Killzones for high-probability setups or major sessions for market analysis.
Notes
Ensure your time ranges align with your trading instrument’s session times.
Overlapping ranges prioritize higher-numbered ranges (e.g., Asia Killzone overrides London Session).
Ideal for day traders, scalpers, or ICT strategy followers who need clear visual cues for specific market hours.
Feedback
If you have suggestions for improvements or need help with customization, feel free to leave a comment or contact the author!
