Selected MACD Areas CompareThis is a simple tool to compare two selected MACD histogram area. The MACD histogram area is sometimes used to determine trend reversal or trend strength. One may have difficulty with this when the compared MACD areas are of different shape or similar in size. This indicator/tool allows user to select two time periods on the chart and get a precise compare result.
To use the indicator, place a regular MACD indicator on the chart which shows the histogram, then add this indicator and select the two areas of which you want to compare the size. Please make sure that the regular MACD indicator this one have the same source.
在腳本中搜尋"手机同花顺macd指标超出框架"

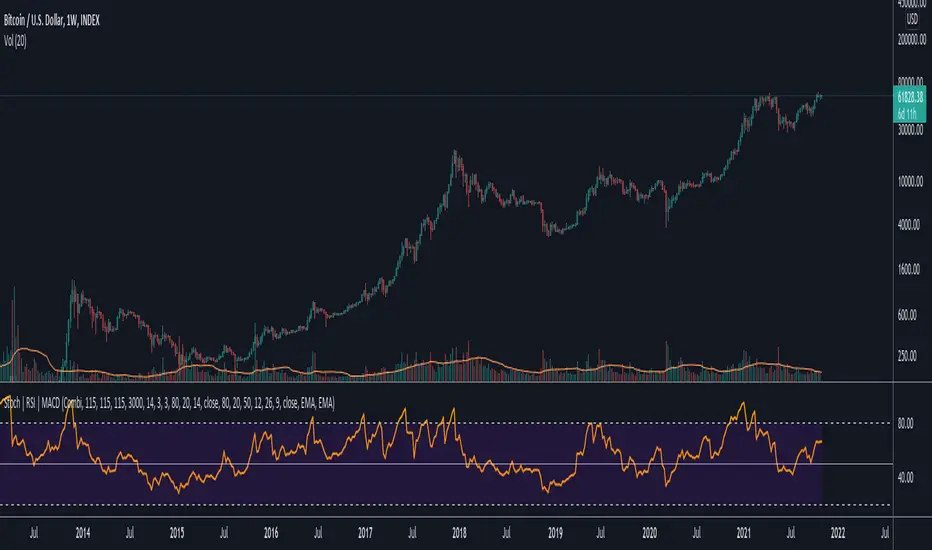
Data Trader Stoch | RSI | MACD Strategy IndicatorImplementation of Data Trader's strategy, described in the youtube video, "Highly Profitable Stochastic + RSI + MACD Trading Strategy (Proven 100x)"
Also see Algovibes' video, "Highly Profitable Stochastic + RSI + MACD Trading Strategy? Testing Data Traders strategy in Python"
Note: Despite the claims, it generates barely, if any, signals, certainly in the crypto markets
If there are any mistakes, give feedback in the comments, and I'll fix
### Strategy Summary ###
# Long Signals #
Stoch K and D are oversold
RSI above midline
MACD above signal line
# Short Signals #
Stoch K and D are overbought
RSI below midline
MACD below signal line
# Stop loss and Take Profit #
Stop loss
Longs: below last swing low
Shorts: above last swing high
Take profit at 1.5x stop loss
Forex scalper 2xEMA + SRSI + MACDThis is a forex scalping strategy designed for the most liquid pairs, like major forex pairs.
Its made of
1 EMA 50
1 EMA 100
Stochastic RSI
MACD
Rules
For long :close of the candle is above moving average 50, moving average 50> moving average 100, macd histogram is positive and cross over of stochastic rsi with the oversold level.
For short :close of the candle is below moving average 50, moving average 50 < moving average 100, macd histogram is negative and cross under of stochastic rsi with the overbought level.
Exit
For exit we have take profit and stop loss using fixed pip points.
For this example on EURUSD we use 20 pips for both tp and sl
IF you have any questions let me know !

RSI & MACDThis indicator presents standart RSI and MACD indicators in a single indicator. The appearances of these indicators have been modified a little bit and squeezed into one window. To overcome the scale problem the MACD values has expanded with 1000 and divided by the current price to use both indicators in the same scale. Original values could be determined from there. Original Tradingview codes have been used to get full control of graphs.
Bu indikatör RSI ve MACD gösterfgelerini tek bir indikatörde sunuyor. İndikatörlerin görünüşleri bir miktar modifiye edilip iki indikatörğn tek bir pencereden takip edilmesine olanak sağlanmıştır. İki indikatördeki farklı ölçek kullanımından ortaya çıkan ölçek sorunu MACD değerlerinin 1000 ile genişletilip, ürünün güncel fiyatına bölünmesiyle giderilmiştir. Her iki indikatiör için de orjinal Tradingview kodları kullanılmıştır.

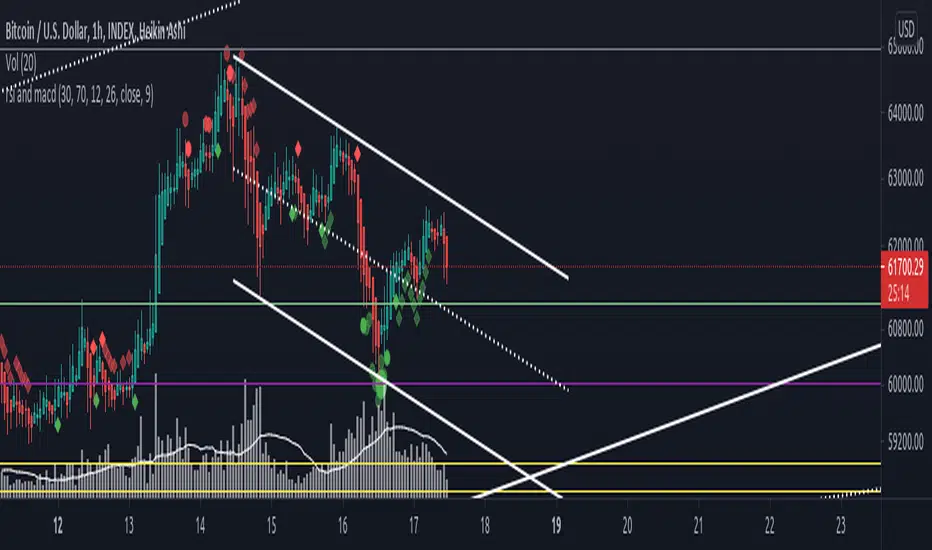
rsi and macdRSI and MACD in the chart:
- small circles -> oversold/overbought
- big circles -> oversold/overbought rising/falling
- small diamonds -> macd over/under signal with macd over/under zero
Please comment if you have an idea to improve it ;)
Momentum Strategy (BTC/USDT; 1h) - MACD (with source code)Good morning traders.
It's been a while from my last publication of a strategy and today I want to share with you this small piece of script that showed quite interesting result across bitcoin and other altcoins.
The macd indicator is an indicator built on the difference between a fast moving average and a slow moving average: this difference is generally plottted with a blue line while the orange line is simply a moving average computed on this difference.
Usually this indicator is used in technical analysis for getting signals of buy and sell respectively when the macd crosses above or under its moving average: it means that the distance of the fast moving average (the most responsive one) from the slower one is getting lower than what it-used-to-be in the period considered: this could anticipate a cross of the two moving averages and you want to anticipate this potential trend reversal by opening a long position
Of course the workflow is specularly the same for opening short positions (or closing long positions)
What this strategy does is simply considering the moving average computed on macd and applying a linear regression on it: in this way, even though the signal can be sligthly delayed, you reduce noise plotting a smooth curve.
Then, it simply checks the maximums and the minimums of this curve detecting whenever the changes of the values start to be negative or positive, so it opens a short position (closes long) on the maximum on this curve and it opens a long position (closes short) on the minimum.
Of course, I set an option for using this strategy in a conventional way working on the crosses between macd and its moving average. Alternatively you can use this workflow if you prefer.
In conclusion, you can use a tons of moving averages: I made a function in pine in order to allw you to use any moving average you want for the two moving averages on which the macd is based or for the moving average computed on the macd
PLEASE, BE AWARE THAT THIS TRADING STRATEGY DOES NOT GUARANTEE ANY KIND OF SUCCESS IN ADVANCE. YOU ARE THE ONE AND ONLY RESPONSIBLE OF YOUR OWN DECISIONS, I DON'T TAKE ANY RESPONSIBILITY ASSOCIATED WITH THEM. IF YOU RUN THIS STRATEGY YOU ACCEPT THE POSSIBILITY OF LOOSING MONEY, ALL OF MY PUBBLICATIONS ARE SUPPOSED TO BE JUST FOR EDUCATIONAL PURPOSES.
IT IS AT YOUR OWN RISK WHETHER TO USE IT OR NOT
But if you make money out of this, please consider to buy me a beer 😜
Happy Trading!

[SK] Double MACDThe Double MACD indicator is precisely two different MACD indicators plotted on the same axis for precise visual correlation between each other.
This correlation provides more information than a single regular MACD by allowing you to compare the signals of a shorter timeframe to the default or longer timeframe,
showing the strength of the change in momentum and the peak of the momentum between both configurations.
The indicator has cloud options by default if you toggle on the MACD / Signal lines for better readability.
The cloud will change color to the line on top of it's set. This is to help you not get lost in the 4 different lines.
Customize the indicator to your preference and make it your own
If you'd like a candle like visualization, change the short MACD plot style to a histogram.
For a beautiful double bars style, select bars on both configurations and set the transparency to 30 - 40
For a dynamic moving average style, go with the line plot style ( default )
All MACD/Signal lines are toggled off by default, toggle them on in the inputs section.
On the styles panel, you can turn off the cloud fills or the lines.
Change all the colors you'd like!

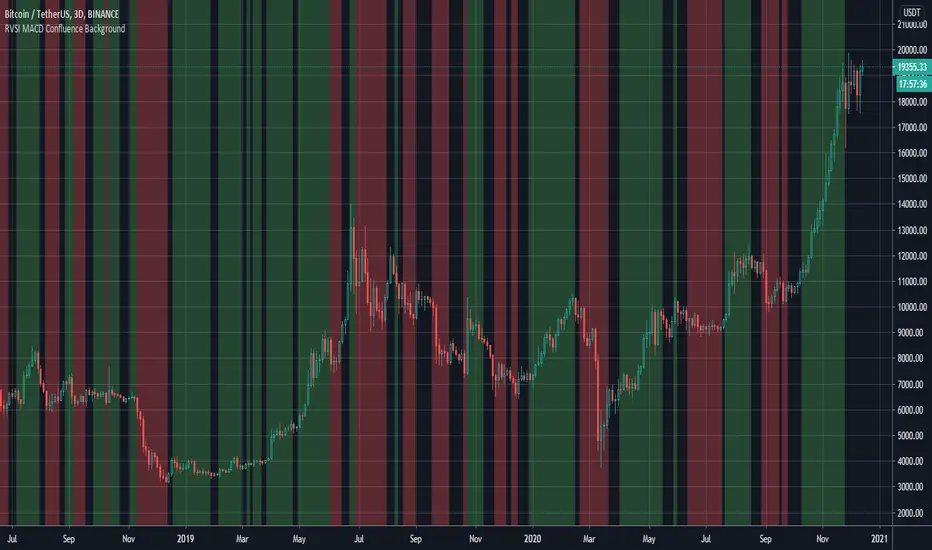
RVSI & MACD Confluence BackgroundThis indicator colors the background in vertical (green/red) stripes to indicate if the current trend is possibly bull / bear
A region where the background is not colored indicates that the present trend can not be identified
The algo combines the RVSI (Relative Volume Strength Index {ref fract} ) and the MACD
The Relative Volume Strength Index has been adapted to include 2 moving averages, one fast and one slow
This same fast slow lookback length is applied to the MACD for simplicity
What's interesting is that there is a very strong confluence between the MACD and RVSI, as the MACD is obtained from 'price action only' and the RVSI from the 'volume only'
So a break in confluence of these two might suggest that the current trend is weakening in confidence or can not be clearly identified
Generally, a green background means consider going long ie price trend is rising
A red background means consider going short ie price trend is falling
An absent background color means - consider exiting current trade or wait to get into a new trade
Best Regards, MoonFlag - and a special thanks/mention to 'fract' for the RVSI algo this is derived from
SALEH MACD Donchian + EMA & MACD + ADXI gathered all the signals coming from the MACD & Donchian channels indicators and filtered them with EMA 200 or ADX > 25 indicators (which both of them show the trend),
and put them on the chart to show me the buy and sell signals;
the signals rules are as following:
BUY:
when we have an uptrend ( the price is above the EMA 200 or ADX > 25 ) & the macd line cross up the signal line while they are both under the 0 level of histogram it generates buy signals.
SELL:
when we have a downtrend ( the price is below the EMA 200 or ADX > 25) & the macd line cross below the signal line while they are both above the 0 level of histogram it generates sell signals.
Donchian channel works as a confirmation for the macd signal.
this signals work best at London session, you can also filter them by chandelier exit indicator.

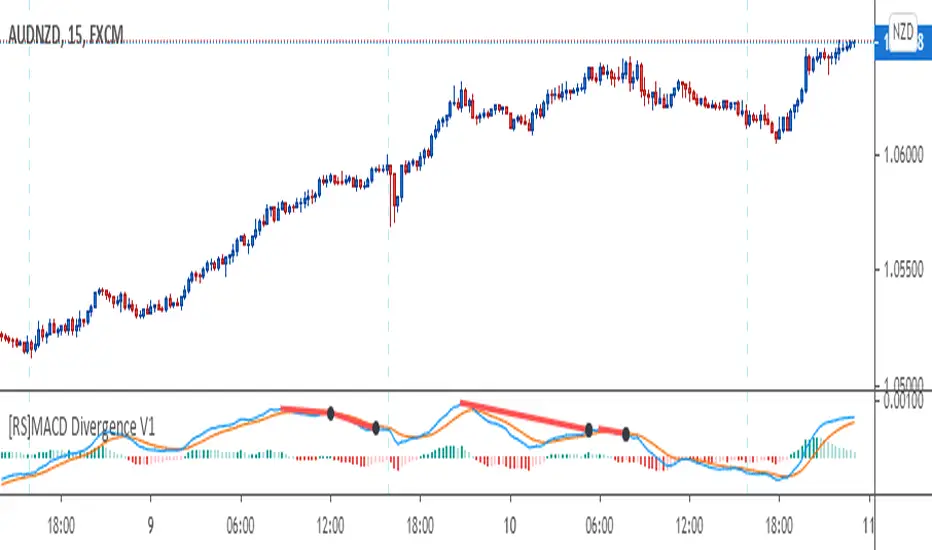
[RS]MACD Divergence V1This oscilator was created by Ricardo Santos using MACD's histogram as the series to find low and high fractals and from there find and plot divergences.
I just modified it a little bit to make it to look more like the MACD public library indicator and use the actual MACD series (instead of the histogram) to find the fractals and from there plot divergences.
I did this to make it easier for me and other fellow students of a Forex school where we use these type of divergences to find patterns.

{INDYAN} RSI + MACDModded RSI and MACD for intraday use. If rsi above 60 and macd is above zero line then go for buy and if rsi is below 40 and macd below zero line then go for sell side. use it in small timeframe i.e. 3 minute or less.
better for scalp trading
Happy Trading
Love INDYAN
#It can be used best with INDYAN Go With Trend

DEMA Strategy with MACDThe Double Exponential Moving Average (DEMA) indicator was introduced in January 1994 by Patrick G. Mulloy, in an article in the "Technical Analysis of Stocks & Commodities" magazine: "Smoothing Data with Faster Moving Averages"
It attempts to remove the inherent lag associated to Moving Averages by placing more weight on recent values. The name suggests this is achieved by applying a double exponential smoothing which is not the case. The name double comes from the fact that the value of an EMA (Exponential Moving Average) is doubled. To keep it in line with the actual data and to remove the lag the value "EMA of EMA" is subtracted from the previously doubled ema.
DEMA is a very responsive system. A lot of signals can be generated only when trading with DEMA. In this strategy, I combined Dema buy-sell signals with MACD indicator. When you activate MACD confirmation from settings; When DEMA comes to long situation, the MACD histogram is checked to be positive.

Trend Trader Strategy with MACDThis is plots the indicator developed by Andrew Abraham in the Trading the Trend article of TASC September 1998
The strategy I use has already been published explicitly by HPotter, you can review the core code from there.
I have converted the existing strategy codes that have been published into the strategy and the result looks great but I noticed that the indicator performed too much in short periods like 1 minute and I thought it would be healthier to get MACD approval. MACD approval will come selected by default. When the indicator reaches the buy status, if the macd histogram is positive, it enters the long process. By removing this confirmation from the settings window, you can see the normal signal frequency of the indicator.
This strategy is mainly based on trend signals. In fact, I am publishing this strategy to use in alternating trading for Bear-Bull crypto coins.
What does the bear-bull comparison mean?
You can open the same chart in the ETHBEAR / USDT symbol as opposed to the ETHBULL / USDT symbol that appears on the chart. When BUY signal comes in bull symbol, SELL will come in bear symbol. When BUY signal comes in bear symbol, SELL will come in bull symbol. In this way, very fast and very high profit can be obtained by alternating operation.

kurdistan MACD & RSI & EMA Hello friends
This indicator can help you to combine the three indicators together
EMA (20), MACD (12, 26, 20), RSI (14)
Apply ema20 to rsi as the signal line
Long arrival time
Price above EMA20, MACD above signal line and RSI above signal line
Short arrival time
Price below EMA20, MACD below signal line and RSI below signal line

Point and Figure (PnF) MACDThis is live and non-repainting Point and Figure Chart MACD tool. The script has it’s own P&F engine and not using integrated function of Trading View.
Point and Figure method is over 150 years old. It consist of columns that represent filtered price movements. Time is not a factor on P&F chart but as you can see with this script P&F chart created on time chart.
P&F chart provide several advantages, some of them are filtering insignificant price movements and noise, focusing on important price movements and making support/resistance levels much easier to identify.
P&F MACD is calculated and shown by using its own P&F engine.
If you are new to Point & Figure Chart then you better get some information about it before using this tool. There are very good web sites and books. Please PM me if you need help about resources.
Options in the Script
Box size is one of the most important part of Point and Figure Charting. Chart price movement sensitivity is determined by the Point and Figure scale. Large box sizes see little movement across a specific price region, small box sizes see greater price movement on P&F chart. There are four different box scaling with this tool: Traditional, Percentage, Dynamic (ATR), or User-Defined
4 different methods for Box size can be used in this tool.
User Defined: The box size is set by user. A larger box size will result in more filtered price movements and fewer reversals. A smaller box size will result in less filtered price movements and more reversals.
ATR: Box size is dynamically calculated by using ATR, default period is 20.
Percentage: uses box sizes that are a fixed percentage of the stock's price. If percentage is 1 and stock’s price is $100 then box size will be $1
Traditional: uses a predefined table of price ranges to determine what the box size should be.
Price Range Box Size
Under 0.25 0.0625
0.25 to 1.00 0.125
1.00 to 5.00 0.25
5.00 to 20.00 0.50
20.00 to 100 1.0
100 to 200 2.0
200 to 500 4.0
500 to 1000 5.0
1000 to 25000 50.0
25000 and up 500.0
Default value is “ATR”, you may use one of these scaling method that suits your trading strategy.
If ATR or Percentage is chosen then there is rounding algorithm according to mintick value of the security. For example if mintick value is 0.001 and box size (ATR/Percentage) is 0.00124 then box size becomes 0.001.
And also while using dynamic box size (ATR or Percentage), box size changes only when closing price changed.
Reversal : It is the number of boxes required to change from a column of Xs to a column of Os or from a column of Os to a column of Xs. Default value is 3 (most used). For example if you choose reversal = 2 then you get the chart similar to Renko chart.
Source: Closing price or High-Low prices can be chosen as data source for P&F charting.
P&F MACD Part
Fast Length: Fast Length for P&F MACD , default value is 12
Slow Length: Fast Length for P&F MACD , default value is 26
Signal Smoothing: Signal Length, default value is 9
Source: Moving averages on P&F charts are based on the average price of each column. Bar chart moving averages are based on each close price. Average price means “(ClosePrice + OpenPrice) / 2”. You can choose Close Price or Average Price as source. Default is Average Price.
There are 2 Alerts:
If PNF MACD line crossover the signal line
If PNF MACD line crossunder the signal line
While adding alert “Once Per Bar Close” option should be chosen.

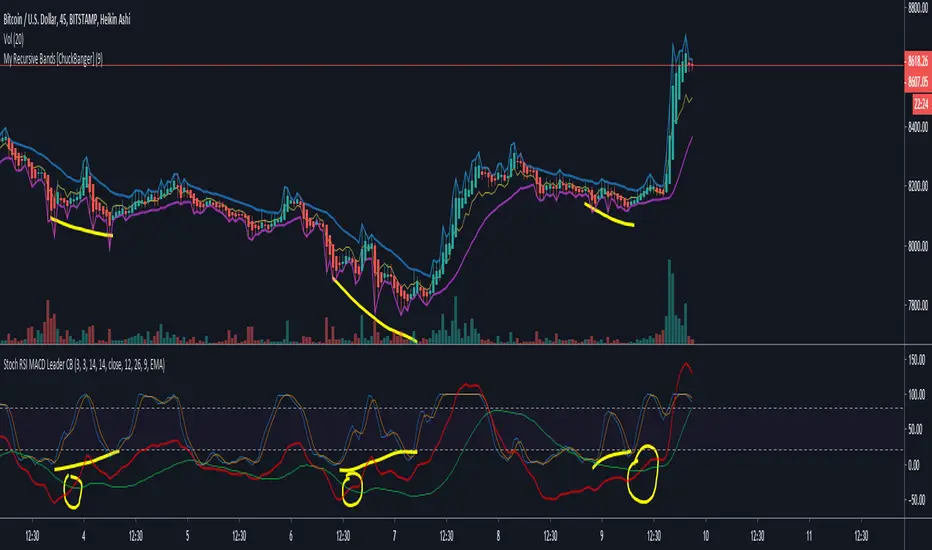
Stochastic RSI and MACD leader [ChuckBanger]Here I have combined Stochastic RSI with my MACD leader.
MACD leader and Stochastic RSI works well together and they are powerful in combination with My Recursive Bands. It is up to you to back test this properly before you use it in real life trades. But in my opinion it is very powerful.
Because of MACD nature it's a little messy when you turn on the MACD's histogram so I commented that out.
MACD Leader:
My Recursive Bands:
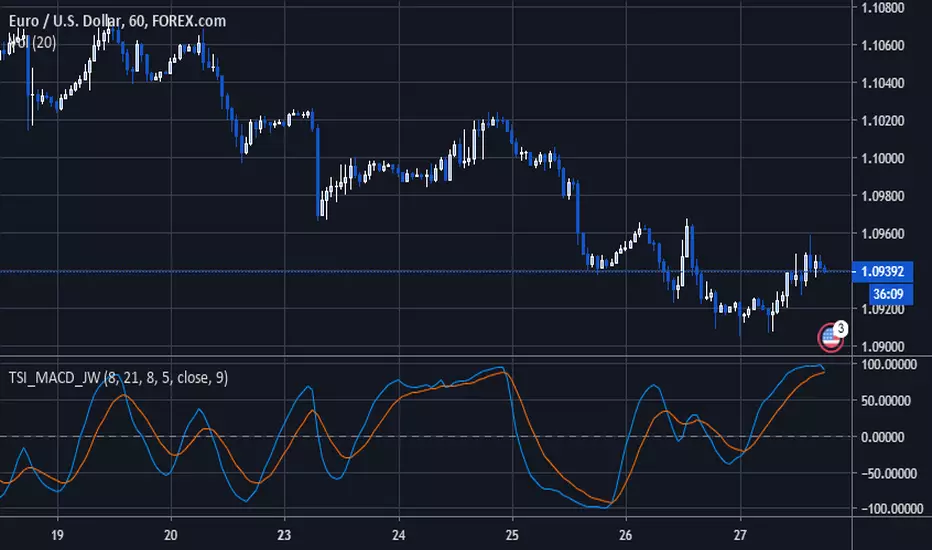
TSI MACD by Jwammo12The TSI MACD indicator is a combination of the TSI (True Strength Index) and MACD (Moving Average Convergence Divergence) technical indicators.
The TSI MACD indicator is a momentum indicator, considering that it comes from two momentum indicators.
Ultimately, the TSI MACD indicator is used to gauge the strength of a trend, as well as its accompanying momentum.
The indicator is shown to oscillate between -110 and +110, while its signal baseline is on the zero level (a level that determines the market bias).
SMA/pivot/Bollinger/MACD/RSI en pantalla gráficoMulti-indicador con los indicadores que empleo más pero sin añadir ventanas abajo.
Contiene:
Cruce de 3 medias móviles
La idea es no tenerlas en pantalla, pero están dibujadas también. Yo las dejo ocultas salvo que las quiera mirar para algo.
Lo que presento en pantalla es la media lenta con verde si el cruce de las 3 marca alcista, amarillo si no está claro y rojo si marca bajista.
Pivot
Normalmente los tengo ocultos pero los muestro cuando me interesa. Están todos aunque aparezcan 2 seguidos.
Bandas de Bollinger
No dibujo la línea central porque empleo la media como tal.
Parabollic SAR
Lo empleo para dibujar las ondas de Elliott como postula Matías Menéndez Larre en el capítulo 11 de su libro "Las ondas de Elliott". Así que, aunque se puede mostrar, lo mantengo oculto y lo que muestro es dónde cambia (SAR cambio).
MACD
No está dibujado porque necesitaría sacarlo del gráfico.
Marco en la parte superior cuándo la señal sobrepasa al MACD hacia arriba o hacia abajo con un flecha indicando el sentido de esta señal.
RSI
Similar al MACD pero en la parte inferior.
Probablemente, programe otro indicador para visualizar en una ventanita MACD, RSI y volumen todo junto. El volumen en la principal hay veces que no te permite ver bien alguna sombra y los otros 2 te quitan mucho espacio para graficar si los tienes permanentemente en 2 ventanas separadas.
Multiple MACD RSI simple strategySimple strategy script I've had for a while but looks like I never published.
Although it is one of my most simple it seems to have the best profitability. It is pretty rough though. the Stoch RSI has only a little weight to the trade trigger. I'll refine it more over time or you can by all means. Basically the Stoch RSI current K line has to be OVER 40 to trigger a SELL. It has no effect on buy side.
The triggers are roughly as follows:
Year - since so many assets have gone 2x, 3x, 10x+ since 2013 having a strategy that earns a 500% return from 2013 to now isn't that good if buy-and-holding would have got you 800%. This eliminates some of that noise and makes it a little easier to quickly gauge success. So buy/sell trigger need a value of greater or equal to 2018 (default)
MACD 1 - First MACD (short) needs to indicate greater than 0 to buy or less than 0 to sell.
MACD 2 - Same as MACD1 but for second MACD set (long)
Uptrend - Latest close + high divided by last periods close + high needs to be grater than 1. So if latest is 34.30 close and 34.60 high and previous interval is 34.80 close and 34.82 high, that is 0.99 and will not trigger a buy trade.
Downtrend - Same thing but close + low and less than 1.
This script/strategy is pretty rough but if there is interest I'll polish it more since it is a pretty solid but simple strategy for most assets.

Advanced MACDThis is a more advanced version of the standard moving average convergence/divergence indicator (MACD). It allows you to change the type of all moving averages (Simple, Exponential, Weighted, Volume-weighted, Triple EMA or a moving average that uses RSI). By for example setting the period to 3/10/16 and use simple moving averages instead of exponential moving averages you can turn it into the modified version of the MACD oscillator (mMACD) described in detail in Appendix B in the book "The Art and Science of Technical Analysis: Market Structure, Price Action and Trading Strategies" by Adam Grimes.
The indicator also allows you to volume weight the indicator (turned on by default), which will turn it into a Volume-Weighted Moving Average Convergence Divergence (VW-MACD) first used by Buff Pelz Dormeier in 2002 and described in detail in his book "Investing with Volume Analysis: Identify, Follow, and Profit from Trends". If you want to weight the oscillator against the true range instead of volume this is also possible. By default, this will be done automatically for assets that do not support volume.

DiNapoli MACD & Stoch [LazyBear] --- Updated: May 19 2015 ----
Applicable only If you are setting up alerts:
I noticed I have switched the plot names. Histo shd be the MACD and DMACD shd be the Signal.
Replace lines 16 & 17 with these to get the correct names. NOTE that no functionality is affected, just the names.
plot(r, style=columns, color=r>0?green:red, transp=80, title="Dinapoli MACD")
plot(s, color=teal, linewidth=2, title="Trigger")
--- Original Description ---
These two indicators are from one of my favorite books - DiNapoli's Levels. These are custom MACD and Stoch used by him. There are more indicators - Detrended Osc, DisplacedMA - that he uses, will publish them all later.
The settings of normal MACD/Stoch can be tuned to obtain these DiNapoli indicators, or if you are lazy (like me!) just use these :)
DiNapoli Preferred Stoch source: pastebin.com
More info:
www.amazon.com
List of my public indicators: bit.ly
List of my app-store indicators: blog.tradingview.com

Indicators: Volume-Weighted MACD Histogram & Sentiment Zone OscVolume-Weighted MACD Histogram
-------------------------------------------------------------------------------------
Volume-Weighted MACD Histogram, first discussed by Buff Dormeier, is a modified version of MACD study. It calculates volume-averaged Close price for finding the histogram.
More info:
www.moneyshow.com
Sentiment Zone Oscillator
-------------------------------------------------------------------------------------
Sentiment Zone Oscillator, developed by Walid Khalil, is a complementing oscillator to VZO and PZO.
To quote Walid:
>> The sentiment zone oscillator (SZO) is a leading contrary oscillator that measures the extreme emotions of a single market or share.
>> It measures and defines both extremes, bullishness (overoptimism) and bearishness (overpessimism), that could lead to a change
>> in sentiment, eventually changing the trend of the time frame under study. The SZO was devised on the belief that after several waves
>> of rising prices, investors begin to get bullish on the stock with increasing confidence since the price has been rising for some time.
>> The SZO measures that bullishness/bearishness and marks overbought/oversold levels.
SZO has its own oversold/overbought bands. Also, when SZO goes above 7, it indicates extreme optimism. When the SZO goes below -7, it indicates extreme pessimism.
More info: www.traders.com
How to import / use custom indicators from this chart?
-------------------------------------------------------------------------------------
PDF: drive.google.com
