RSI Divergence on 1-Hour with 15min & 5min CorrectionUsing the 15 minute timeframe, rsi divergence on the hourly chart is "tracked" by the 15 and 5 min rsi levels to watch for the hourly chart's rsi correction.
在腳本中搜尋"机械革命无界15+时不时闪屏"

Pivot Points High Low & Missed Reversal Levels + Alertsmake alert if there come a new high and low, best in 15 min and pivot go from 50 to 15

Multi-Symbol EMA Crossover Scanner with Multi-Timeframe AnalysisDescription
What This Indicator Does:
This indicator is a comprehensive market scanner that monitors up to 10 symbols simultaneously across 4 different timeframes (15-minute, 1-hour, 4-hour, and daily) to detect exponential moving average (EMA) crossovers in real-time. Instead of manually checking multiple charts and timeframes for EMA crossover signals, this scanner automatically does the work for you and presents all detected signals in a clean, organized table that updates continuously throughout the trading session.
Key Features:
Multi-Symbol Monitoring: Scan up to 10 different symbols at once (stocks, forex, crypto, or any TradingView symbol)
Multi-Timeframe Analysis: Simultaneously tracks 4 timeframes (15m, 1H, 4H, 1D) with toggle options to enable/disable each
Comprehensive EMA Pairs: Detects crossovers between all major EMA combinations: 20×50, 20×100, 20×200, 50×100, 50×200, and 100×200
Real-Time Signal Feed: Displays the most recent signals in a sorted table (newest first) with timestamp, direction, price, and EMA pair information
Session Filter: Built-in time filter (default 10:00-18:00) to focus on specific trading hours and avoid pre-market/after-hours noise
Pagination System: Navigate through signals using a page selector when you have more signals than fit in one view
Signal Statistics: Footer displays total signals, bullish/bearish breakdown, and page navigation hints
Customizable Display: Choose table position (4 corners), signals per page (5-20), and maximum signal history (10-100)
How It Works:
The scanner uses the request.security() function to fetch EMA data from multiple symbols and timeframes simultaneously. For each symbol-timeframe combination, it calculates four exponential moving averages (20, 50, 100, and 200 periods) and monitors for crossovers:
Bullish Crossovers (▲ Green):
Faster EMA crosses above slower EMA
Indicates potential upward momentum
Common entry signals for long positions
Bearish Crossovers (▼ Red):
Faster EMA crosses below slower EMA
Indicates potential downward momentum
Common entry signals for short positions or exits
The scanner prioritizes crossovers involving faster EMAs (20×50) over slower ones (100×200), as faster crossovers typically generate more frequent signals. Each detected crossover is stored with its timestamp, allowing the scanner to sort signals chronologically and remove duplicates within the same timeframe.
Signal Table Columns:
Sym: Symbol name (abbreviated, e.g., "ASELS" instead of "BIST:ASELS")
TF: Timeframe where the crossover occurred (15m, 1h, 4h, 1D)
⏰: Exact time of the crossover (HH:MM format in Istanbul timezone)
↕: Direction indicator (▲ bullish green / ▼ bearish red)
₺: Price level where the crossover occurred (average of the two EMAs)
MA: Which EMA pair crossed (e.g., "20×50", "50×200")
How to Use:
For Day Traders:
Enable 15m and 1h timeframes
Monitor symbols from your watchlist
Use crossovers as entry timing signals in the direction of the larger trend
Adjust the time filter to match your trading session (e.g., market open to 2 hours before close)
For Swing Traders:
Enable 4h and 1D timeframes
Focus on 50×200 and 100×200 crossovers (golden/death crosses)
Look for multiple timeframe confluence (same symbol showing bullish crossovers on both 4h and 1D)
Use as a pre-market scanner to identify potential setups for the day
For Multi-Market Traders:
Mix symbols from different markets (stocks, forex, crypto)
Use the scanner to identify which markets are showing the most momentum
Track relative strength by comparing crossover frequency across symbols
Identify rotation opportunities when one asset shows bullish signals while another shows bearish
Setup Recommendations:
Default BIST (Turkish Stock Market) Setup:
The code comes pre-configured with 10 popular BIST stocks:
ASELS, EKGYO, THYAO, AKBNK, PGSUS, ASTOR, OTKAR, ALARK, ISCTR, BIMAS
For US Stocks:
Replace with symbols like: NASDAQ:AAPL, NASDAQ:TSLA, NASDAQ:NVDA, NYSE:JPM, etc.
For Forex:
Use pairs like: FX:EURUSD, FX:GBPUSD, FX:USDJPY, OANDA:XAUUSD, etc.
For Crypto:
Use exchanges like: BINANCE:BTCUSDT, COINBASE:ETHUSD, BINANCE:SOLUSDT, etc.
Settings Guide:
Symbol List (10 inputs):
Enter any valid TradingView symbol in "EXCHANGE:TICKER" format
Use symbols you actively trade or monitor
Mix different asset classes if desired
Timeframe Toggles:
15 Minutes: High-frequency signals, best for day trading
1 Hour: Balanced frequency, good for intraday swing trades
4 Hours: Lower frequency, quality swing trade signals
1 Day: Low frequency, major trend changes only
Time Filter:
Start Hour (10): Beginning of your trading session
End Hour (18): End of your trading session
Prevents signals during low-liquidity periods
Adjust to match your market's active hours
Display Settings:
Table Position: Choose corner placement (doesn't interfere with other indicators)
Max Signals (40): Total historical signals to keep in memory
Signals Per Page (10): How many rows to show at once
Page Number: Navigate through signal history (auto-adjusts to available pages)
What Makes This Original:
Multi-symbol scanners exist on TradingView, but this indicator's originality comes from:
Comprehensive EMA Pair Coverage: Most scanners focus on 1-2 EMA pairs, this monitors 6 different combinations simultaneously
Unified Multi-Timeframe View: Presents signals from 4 timeframes in a single, chronologically sorted feed rather than separate panels
Session-Aware Filtering: Built-in time filter prevents signal overload from 24-hour markets
Smart Pagination: Handles large signal volumes gracefully with page navigation instead of scrolling
Signal Deduplication: Prevents the same crossover from appearing multiple times if it persists across several bars
Price-at-Cross Recording: Captures the exact price where the crossover occurred, not just that it happened
Real-Time Statistics: Live tracking of bullish vs bearish signal distribution
Trading Strategy Examples:
Trend Confirmation Strategy:
Find a symbol showing bullish crossover on 1D (major trend change)
Wait for pullback
Enter when 1h shows bullish crossover (confirmation)
Exit when 1h shows bearish crossover
Multi-Timeframe Confluence:
Look for symbols appearing multiple times with same direction
Example: ASELS shows ▲ on both 4h and 1D = strong bullish signal
Avoid symbols showing conflicting signals (▲ on 1h but ▼ on 4h)
Rotation Scanner:
Monitor 10+ symbols from the same sector
Identify which are turning bullish (▲) first
Enter leaders, avoid laggards
Rotate out when crossovers turn bearish (▼)
Important Considerations:
Not a Complete System: EMA crossovers should be confirmed with price action, volume, and support/resistance analysis
Whipsaw Risk: During consolidation, EMAs can cross back and forth frequently (especially on 15m timeframe)
Lag: EMAs are lagging indicators; crossovers occur after the move has already begun
False Signals: More common during sideways markets; work best in trending environments
Symbol Limits: TradingView has limits on request.security() calls; this scanner uses 40 calls (10 symbols × 4 timeframes)
Performance: On lower-end devices, scanning 10 symbols across 4 timeframes may cause slight delays in chart updates
Best Practices:
Start with 5 symbols and 2 timeframes, then expand as you get comfortable
Use in conjunction with a main chart for price context
Don't trade every signal—filter for high-quality setups
Backtest your favorite EMA pairs on your symbols to understand their reliability
Adjust the time filter to exclude lunch hours if your market has low midday volume
Check the footer statistics—if you're getting 50+ signals per day, tighten your time filter or reduce symbols
Technical Notes:
Uses lookahead=barmerge.lookahead_off to prevent future data leakage
Signals are stored in arrays and sorted by timestamp (newest first)
Automatic daily reset clears old signals to prevent memory buildup
Table dynamically resizes based on signal count
All times displayed in Europe/Istanbul timezone (configurable in code)

Session Breakout, Retest, Reversal + Large Move Alert## **Session Breakout, Retest, Reversal + Large Move Alert**
### Overview
A powerful multi-functional indicator designed for day traders and futures traders to identify session-based breakout opportunities, retest confirmations, and significant price movements across all futures contracts (Gold, E-mini S&P 500, Nasdaq, Crude Oil, and more).
### Key Features
**📊 Pre-Market Session Tracking**
- Automatically calculates pre-market/overnight session highs and lows
- Displays session ranges with customizable colors and styling
- Extends lines through the entire trading session for easy reference
- Supports overnight sessions (e.g., 4 PM – 7:30 AM for Gold futures)
**🚀 Breakout Detection**
- Identifies breakouts above/below pre-market highs and lows
- Uses close-price confirmation to filter false signals from wicks
- Displays "BO ↑" and "BO ↓" labels at breakout points
- Generates instant alerts when breakouts occur
**♻️ Retest Failed Tracking**
- Monitors price retests after breakouts
- Detects when retests fail to reach previous support/resistance
- Labels "RF" (Retest Failed) for high-probability trade setups
- Helps identify reversal opportunities
**📈 First 5-Minute Analysis**
- Captures first 5 minutes of market open (customizable timeframe)
- Tracks first 5-minute highs and lows separately
- Essential for mean-reversion and breakout confirmation strategies
- Blue lines extend through the trading session for easy tracking
**⚡ Large Move Alerts**
- Detects significant price movements based on point thresholds
- Individual thresholds for 5+ different symbols:
- GC (Gold): 15 points
- ES (E-mini S&P 500): 15 points
- NQ (E-mini Nasdaq): 50 points
- CL (Crude Oil): 1.5 points
- Custom: Fully adjustable
- Auto-detects symbol from chart ticker
- Labels show exact point movement and candle direction
### Customization Options
**Symbol Configuration**
- **Auto-Mode**: Automatically detects trading symbol from chart ticker
- **Manual-Mode**: Select specific symbol (GC, ES, NQ, CL, or Custom)
**Session Settings**
- Fully customizable pre-market session time (24-hour format)
- Adjustable market open time for first 5-minute window
- Market close hour and minute configuration
- Support for any timezone
**Point Move Thresholds by Symbol**
- Set independent thresholds for each of your trading symbols
- Quickly adjust settings when switching between different futures
- Includes helpful tooltips for recommended values
**Display & Styling**
- Toggle all visual elements on/off individually
- Customizable colors for all lines and labels:
- Pre-market high/low colors
- Breakout labels (up/down)
- Retest failed labels
- First 5-minute session lines
- Large move indicators
- Text size options: tiny, small, normal, large, huge
### How It Works
1. **Session Tracking**: The indicator identifies your pre-market session and marks the high and low with labeled lines (PH/PL)
2. **Breakout Signal**: Once the market opens, it monitors for close prices above/below the pre-market levels and alerts you with "BO ↑" or "BO ↓"
3. **Retest Confirmation**: After a breakout, it tracks retests and labels "RF" when the retest fails to reach the opposite extreme, confirming trade direction
4. **Large Move Detection**: Simultaneously monitors for significant point moves that exceed your symbol-specific thresholds
5. **Alert Triggers**: Get real-time alerts for:
- Breakout Up/Down
- Any Breakout
- Large Move events
### Alert Conditions
The indicator includes four alert conditions:
- **Breakout Up Alert**: Price closes above pre-market high
- **Breakout Down Alert**: Price closes below pre-market low
- **Any Breakout Alert**: Either breakout condition triggers
- **Large Move Alert**: Point movement exceeds threshold for current symbol
### Ideal For
- ✅ Day traders (breakout/retest strategies)
- ✅ Futures traders (Gold, Oil, Stock Index Contracts)
- ✅ Intraday scalpers (first 5-minute analysis)
- ✅ Swing traders (session-based levels)
- ✅ Multi-symbol traders (independent thresholds per symbol)
### Disclaimer
This indicator is designed for educational and informational purposes. Past performance does not guarantee future results. Always use proper risk management and position sizing. Test thoroughly on historical data before trading live.

Market Breadth - [JTCAPITAL]Market Breadth - is a comprehensive crypto market strength and sentiment indicator designed to visualize the overall bullish or bearish alignment across 40 major cryptocurrencies. By combining multi-asset Exponential Moving Average (EMA) comparisons and smoothing techniques, it offers a clean, aggregated view of the broader market trend—helping traders quickly assess whether the market is dominated by bullish momentum or bearish pressure.
The indicator works by calculating in the following steps:
Symbol Selection and Data Retrieval
The script monitors 40 leading cryptocurrencies based on Market Cap. Each asset’s daily close price is requested using a 1D timeframe. This ensures that every data point reflects the same temporal resolution, allowing the indicator to evaluate global crypto strength rather than individual token volatility.
EMA Comparison per Asset
For each asset, two Exponential Moving Averages (EMAs) are calculated:
A short-term EMA with period emalength (default 10).
A long-term EMA with period emalength2 (default 20).
Each coin receives a score of +1 when the short-term EMA is greater than the long-term EMA (indicating bullish structure), or -1 when it is below (indicating bearish structure). This binary scoring system effectively converts individual price action into a directional sentiment measure.
Market Breadth Aggregation
All 40 individual scores are summed into a single composite value called scores .
If many assets have bullish EMA alignment, the total score becomes strongly positive.
If the majority show bearish alignment, the total score turns negative.
This step transforms scattered price data into one unified market breadth metric—quantifying how many assets participate in the same directional trend.
Smoothing the Breadth Line
To reduce short-term noise and isolate trend direction, the aggregated score is smoothed using an EMA of length = smoothlen (default 15). The resulting smoothed line helps identify sustained shifts in collective sentiment rather than temporary fluctuations.
Visualization and Color Coding
When scores > 0 , the market breadth is bullish and the histogram is colored blue.
When scores < 0 , the breadth turns bearish and the histogram is purple.
The same logic applies to the smoothed line and background color, offering an instant visual cue of market mood transitions.
Buy and Sell Conditions:
The indicator itself does not trigger direct buy/sell signals but rather acts as a market regime filter . Traders can use it as follows:
Buy Filter: When the smoothed value is above zero and rising, the majority of assets confirm an uptrend — this favors long setups or trend continuation entries.
Sell Filter: When the smoothed value is below zero and falling, bearish alignment dominates — ideal for short setups or defensive risk management.
Optional filters could include combining this with RSI or volume-weighted momentum indicators to confirm breadth-based reversals.
Features and Parameters:
emalength – Defines the short-term EMA length used for individual asset trend detection (default 10).
emalength2 – Defines the long-term EMA length (default 20).
smoothlen – Defines the smoothing EMA length for the total market breadth line (default 15).
40 asset inputs – User-editable symbols allow full customization of which cryptos are tracked.
Dynamic color backgrounds – Visual distinction between bullish and bearish phases.
Specifications:
Exponential Moving Average (EMA)
EMA is a type of moving average that places more weight on recent price data, responding faster to market changes compared to SMA. By comparing a short-term and long-term EMA, the indicator captures momentum shifts across each asset individually. The crossover logic (EMA10 > EMA20) signals bullish conditions, while the opposite indicates bearish momentum.
Market Breadth
Market Breadth quantifies how many assets are participating in a directional move. Instead of tracking a single coin’s trend, breadth analysis measures collective sentiment. When most coins’ short-term EMAs are above long-term EMAs, the market shows healthy bullish breadth. Conversely, when most are below, weakness dominates.
Smoothing (EMA on Scores)
After summing the breadth score, the result is smoothed with an additional EMA to mitigate the inherent volatility caused by individual coin reversals. This second-level smoothing transforms raw fluctuations into a readable, trend-consistent curve.
Color Visualization
Visual cues are integral for intuitive interpretation.
Blue Shades: Indicate bullish alignment and collective upward momentum.
Purple Shades: Indicate bearish conditions and potential risk-off phases.
The background tint reinforces visual clarity even when the indicator is overlaid on price charts.
Background Logic
By applying the same color logic to the chart’s background, users can instantly recognize the prevailing market phase.
Use Cases
As a trend confirmation filter for other indicators (e.g., trade only in the direction of positive breadth).
As a divergence tool : when price rises but breadth weakens, it may signal a topping market.
As a macro sentiment monitor : perfect for assessing when the crypto market as a whole transitions from bearish to bullish structure.
Summary
“ Market Breadth - ” transforms the chaotic price movements of 40 cryptocurrencies into a single, powerful visual representation of overall market health. By merging EMA cross analysis with market-wide aggregation and smoothing , it provides traders with a deep understanding of when bullish or bearish forces dominate the ecosystem.
It’s a clean, data-driven approach to identifying shifts in crypto market sentiment — a perfect companion for trend-following, macro analysis, and timing portfolio exposure.
Enjoy!

Moving Average Ribbon (10x, per-MA timeframe)A flexible moving‑average ribbon that plots up to 10 MAs, each with its own type, length, source, color, and independent timeframe selector for true multi‑timeframe analysis without repainting on higher‑timeframe pulls.
What it does
Plots ten moving averages with selectable types: SMA, EMA, SMMA (RMA), WMA, and VWMA.
Allows per‑line timeframe inputs (e.g., 5, 15, 60, 1D, 1W) so you can overlay higher‑ or equal‑timeframe MAs on the current chart.
Uses a non‑repainting request pattern for higher‑timeframe series to keep lines stable in realtime.
How to use
Leave a TF field blank to keep that MA on the chart’s timeframe; type a timeframe (like 15 or 1D) to fetch it from another timeframe.
Typical trend‑following setup: fast MAs (10–21) on chart TF, mid/slow MAs (34–200) from higher TFs for bias and dynamic support/resistance.
Color‑code faster vs slower lines and optionally hide lines you don’t need to reduce clutter.
Best practices
Prefer pulling equal or higher timeframes for stability; mixing lower TFs into a higher‑TF chart can create choppy visuals.
Combine with price action and volume/volatility tools (e.g., RSI, Bollinger Bands) for confirmation rather than standalone signals.
Showcase example charts in your publish post and explain default settings so users know how to interpret the ribbon.
Inputs
Show/Hide per MA, Type (SMA/EMA/SMMA/WMA/VWMA), Source, Length, Color, Timeframe.
Defaults cover common lengths (10/20/50/100/200 etc.) and can be customized to fit intraday or swing styles.
Limitations
This is an analysis overlay, not a signal generator; it doesn’t place trades or alerts by default.
Effectiveness depends on instrument liquidity and user configuration; avoid overfitting to one market or regime.
Attribution and etiquette
Provide a brief explanation of your calculation choices and note that MA formulas are standard; credit any borrowed concepts or snippets if used.

Trendline Detector - 3 TimeframesThis advanced Pine Script indicator automatically identifies and draws diagonal support and resistance trendlines across three customizable timeframes simultaneously.
Key Features:
Multi-Timeframe Analysis: Configure three independent sets (A, B, C) to analyze different timeframes on a single chart
Smart Pivot Detection: Identifies local minimums and maximums based on open/close prices rather than wicks, reducing false signals from volatile candle shadows
Automatic Trendline Drawing: Calculates ascending support lines from pivot lows and descending resistance lines from pivot highs
Touch Validation: Only displays trendlines that meet your minimum touch requirements, ensuring statistical significance
Customizable Parameters: Full control over lookback period, pivot window size, deviation tolerance, and minimum touches for each timeframe
Visual Pivot Markers: Optional display of all detected pivot points with color-coded arrows (green for lows, red for highs)
Extended Lines: All valid trendlines extend to the right for forward projection
How It Works:
The indicator scans historical bars within your specified lookback period to identify pivot points. It then evaluates all possible trendline combinations, counting how many price points touch each potential line within your deviation tolerance. The trendline with the most touches (meeting your minimum requirement) is displayed.
Parameter Breakdown:
Each set (A, B, C) includes five critical parameters:
Timeframe: The chart timeframe for analysis (e.g., "1" for 1-minute, "15" for 15-minute, "1D" for daily)
Lookback Bars: How many historical bars to scan for pivot points (default: 250). Higher values capture longer-term trends but may increase computation time.
Min Touches: Minimum number of price touches required for a trendline to be considered valid (default: 3). Higher values ensure stronger, more reliable trendlines but may filter out emerging trends.
Deviation %: Percentage tolerance for what constitutes a "touch" (default: 0.1-1.0%). A 0.5% deviation means prices within 0.5% of the theoretical trendline are counted as touches. Lower values create stricter trendlines; higher values are more forgiving.
Pivot Window: Number of bars on each side used to identify local highs/lows (default: 5). A pivot window of 5 means the center bar must be the highest/lowest among 11 bars total (5 left + center + 5 right). Larger values identify more significant pivots but may miss shorter-term turning points.
Display Options:
Show Min/Max Points: Toggle visibility of pivot point markers to see exactly which price levels the algorithm identified as potential trendline anchors.
Perfect For:
Swing traders looking for multi-timeframe confluence zones
Technical analysts who rely on diagonal support/resistance levels
Traders who want automated trendline detection without manual drawing
Anyone seeking to identify trend channels and breakout opportunities
Color Coding:
Support lines are displayed in green with varying transparency, while resistance lines appear in red. Each timeframe set can be independently enabled/disabled based on which chart timeframe you're currently viewing, preventing clutter and maintaining clarity.
Technical Notes:
The indicator uses efficient algorithms to process large datasets while maintaining accuracy. It avoids repainting by only considering confirmed pivot points. The algorithm prioritizes trendlines with more touches and, in case of ties, favors more recent formations with steeper angles for maximum relevance.

Trend Bars with Counter Table# TradingView Trend Bar Indicator Explained
## Indicator Overview
This is a TradingView indicator designed to identify and count **Trend Bars**. It not only visually marks strong bullish and bearish bars on the chart but also displays a data table in the upper right corner that tracks the distribution of trend bars across different periods, helping traders quickly assess market bias.
## Core Concept: What is a Trend Bar?
The indicator defines two types of trend bars:
### Bull Trend Bar
- **Condition**: Close > Open (bullish candle)
- **Strength Requirement**: Body size ≥ 75% of total candle range
```
Body Length = |Close - Open|
Total Candle Range = High - Low
Criteria: Body Length ≥ 0.75 × Total Candle Range
```
This means both upper and lower wicks are very short, representing a very strong bullish candle.
### Bear Trend Bar
- **Condition**: Close < Open (bearish candle)
- **Strength Requirement**: Body size ≥ 75% of total candle range
Similarly, this represents a strong bearish candle with minimal wicks and a full body.
## Visual Markers
The indicator marks qualifying candles with:
- **Green upward arrow**: Bull trend bar, appears below the candle
- **Red downward arrow**: Bear trend bar, appears above the candle
## Statistical Function
The indicator uses a **rolling array** (storing up to 1000 trend bars) to track historical data, then counts trend bar distribution across 5 different periods:
| Period | Statistical Range |
|--------|------------------|
| Group 1 | Last 7 trend bars |
| Group 2 | Last 15 trend bars |
| Group 3 | Last 21 trend bars |
| Group 4 | Last 29 trend bars |
| Group 5 | Last 35 trend bars |
**Note**: This counts "the last N trend bars," not "the last N candles." Only candles meeting the trend bar criteria are included.
## Data Table Interpretation
The table in the upper right corner contains 5 columns:
1. **Last N**: The set statistical range (7, 15, 21, 29, 35)
2. **Total**: Actual number of trend bars counted (may be less than target initially)
3. **Bull**: Number of bull trend bars (displayed in green)
4. **Bear**: Number of bear trend bars (displayed in red)
5. **Bias**: Market bias
- "bull" (green): More bull trend bars
- "bear" (red): More bear trend bars
## Practical Applications
### 1. Assess Short-term Momentum
Check the distribution of the last 7 trend bars. If bull trend bars dominate (e.g., 5:2), it indicates strong short-term buying pressure.
### 2. Identify Trend Strength
If multiple periods show the same Bias direction, the trend is very clear. For example, all 5 periods showing "bull" is a strong upward signal.
### 3. Spot Trend Reversals
When short-term bias (7 bars) opposes long-term bias (35 bars), it may signal a trend change in progress.
### 4. Combine with Other Indicators
Use this indicator alongside moving averages, support/resistance levels, and other tools to improve trading decision accuracy.
## Technical Highlights
- **Dynamic Array Management**: Uses `array.unshift()` to add new data at the array's beginning, ensuring the latest trend bars are always first
- **Efficient Statistics**: Quickly calculates bull/bear distribution through loop iteration over specified array ranges
- **Adaptive Display**: Shows actual available count when historical data is insufficient
- **Real-time Updates**: Only updates the table on the last bar to avoid unnecessary calculations
## Conclusion
The core value of this indicator lies in **quantifying price action**. By identifying strong candles with full bodies and clear direction, then tracking their distribution, traders can quickly grasp the balance of market forces and make more informed trading decisions. Whether for intraday trading or swing trading, this tool provides valuable reference information.

Force DashboardScalping Dashboard - Complete User Guide
Overview
This scalping system consists of two complementary TradingView indicators designed for intraday trading with no overnight holds:
Force Dashboard - Single-row table showing real-time market bias and entry signals
Large Order Detection - Visual diamonds showing institutional order flow
Together, they provide a complete at-a-glance view of market conditions optimized for quick entries and exits.
Recommended Timeframes
Primary Scalping Timeframes
1-minute chart: Ultra-fast scalps (30 seconds - 3 minutes hold time)
2-minute chart: Quick scalps (2-5 minutes hold time)
5-minute chart: Standard scalps (5-15 minutes hold time)
Best Practices
Use 1-2 minute for highly liquid instruments (ES, NQ, major forex pairs)
Use 5-minute for less liquid markets or if you prefer fewer signals
Never hold past the last hour of trading to avoid overnight risk
Set hard stop times (e.g., exit all positions by 3:45 PM EST)
Dashboard Components Explained
Core Indicators (Circles ●)
MACD (5/13/5)
Green ● = Bullish momentum (MACD histogram positive)
Red ● = Bearish momentum (MACD histogram negative)
Gray ● = No clear momentum
Use: Confirms trend direction and momentum shifts
EMA (9/20/50)
Green ● = Price > EMA9 > EMA20 (uptrend)
Red ● = Price < EMA9 < EMA20 (downtrend)
Gray ● = Choppy/sideways
Use: Identifies the immediate micro-trend
Stoch (5-period Stochastic)
Green ● = Oversold (<20) - potential reversal up
Red ● = Overbought (>80) - potential reversal down
Gray ● = Neutral zone (20-80)
Use: Spots reversal opportunities at extremes
RSI (7-period)
Green ● = Oversold (<30)
Red ● = Overbought (>70)
Gray ● = Neutral
Use: Confirms overbought/oversold conditions
CVD (Cumulative Volume Delta)
Green ● = CVD above its moving average (buying pressure)
Red ● = CVD below its moving average (selling pressure)
Gray ● = Neutral
Use: Shows overall buying vs selling pressure
ΔCVD (Delta CVD - Rate of Change)
Green ● = CVD accelerating upward (buying acceleration)
Red ● = CVD accelerating downward (selling acceleration)
Gray ● = No acceleration
Use: Detects momentum shifts in order flow
Imbal (Order Flow Imbalance)
Green ● = Buy pressure >2x sell pressure
Red ● = Sell pressure >2x buy pressure
Gray ● = Balanced
Use: Identifies extreme one-sided order flow
Vol (Volume Strength)
Green ● = Volume >1.5x average (strong interest)
Red ● = Volume <0.7x average (low interest)
Gray ● = Normal volume
Yellow background = Volume surge (>2x average) - BIG MOVE ALERT
Use: Confirms conviction behind price moves
Tape (Tape Speed)
Green ● = Fast order flow (>1.3x normal)
Red ● = Slow order flow (<0.7x normal)
Gray ● = Normal speed
Yellow background = Very fast tape (>1.5x) - RAPID EXECUTION ALERT
Use: Measures urgency and speed of orders
Key Levels
Support (Supp)
Shows the nearest high-volume support level below current price
Bright Green background = Price is AT support (within 0.3%) - BOUNCE ZONE
Green background = Price above support (healthy)
Red background = Price below support (broken support, now resistance)
Resistance (Res)
Shows the nearest high-volume resistance level above current price
Bright Orange background = Price is AT resistance (within 0.3%) - REJECTION ZONE
Red background = Price below resistance (facing overhead supply)
Green background = Price above resistance (breakout)
These levels update automatically every 3 bars based on volume profile
Entry Signal Components
Score
Displays format: "6L" (6 long indicators) or "4S" (4 short indicators)
Bright Green = 6-7 indicators aligned for long
Light Green = 5 indicators aligned for long
Yellow = 4 indicators aligned (weaker setup)
Gray = No alignment
Red/Orange colors = Same scale for short setups
Score of 5+ indicates high-probability setup
SCALP (Main Entry Signal)
BRIGHT GREEN "LONG" = High-quality long scalp (Score 5+)
Green "LONG" = Decent long scalp (Score 4)
BRIGHT ORANGE "SHORT" = High-quality short scalp (Score 5+)
Red "SHORT" = Decent short scalp (Score 4)
Gray "WAIT" = No clear setup - STAY OUT
Entry Strategies
Strategy 1: High-Probability Scalps (Conservative)
When to Enter:
SCALP column shows BRIGHT GREEN "LONG" or BRIGHT ORANGE "SHORT"
Score is 5 or higher
Vol or Tape has yellow background (volume surge)
Example Long Setup:
SCALP = BRIGHT GREEN "LONG"
Score = 6L
Vol = Yellow background
Price AT Support (bright green Supp cell)
EMA, MACD, CVD, ΔCVD, Imbal all green
Entry: Enter immediately on next candle
Target: 0.5-1% move or resistance level
Stop: Below support or -0.3%
Hold Time: 2-10 minutes
Strategy 2: Momentum Scalps (Aggressive)
When to Enter:
Tape has yellow background (fast tape)
Vol has yellow background (volume surge)
ΔCVD is green (for longs) or red (for shorts)
Imbal shows strong imbalance in your direction
Score is 4+
Example Short Setup:
Tape & Vol = Yellow backgrounds
ΔCVD = Red, Imbal = Red
Price AT Resistance (bright orange)
Score = 5S
Entry: Enter immediately
Target: Quick 0.3-0.7% move
Stop: Tight -0.2%
Hold Time: 1-5 minutes
Strategy 3: Reversal Scalps (Mean Reversion)
When to Enter:
Stoch shows oversold (green) or overbought (red)
RSI confirms the extreme
Price is AT Support (for longs) or AT Resistance (for shorts)
ΔCVD and Imbal start reversing direction
Score is 4+
Example Long Setup:
Stoch = Green (oversold)
RSI = Green (oversold)
Supp = Bright green (at support)
ΔCVD turns green
Imbal turns green
Score = 4L or 5L
Entry: Wait for confirmation candle
Target: Move back to EMA9 or mid-range
Stop: Below the low
Hold Time: 3-8 minutes
Large Order Detection Usage
Diamond Signals
Green diamonds below bar = Large buy orders (institutional buying)
Red diamonds above bar = Large sell orders (institutional selling)
Size matters: Larger diamonds = larger order flow
How to Use with Dashboard
Confirmation Entries
Dashboard shows "LONG" signal
Green diamond appears
Enter immediately - institutions are buying
Divergence Alerts (CAUTION)
Dashboard shows "LONG" signal
RED diamond appears (institutions selling)
DO NOT ENTER - conflicting order flow
Cluster Patterns
Multiple green diamonds in row = Strong accumulation, stay long
Multiple red diamonds in row = Strong distribution, stay short
Alternating colors = Chop, avoid trading
Risk Management Rules
Position Sizing
Risk 0.5-1% of account per scalp
Maximum 3 concurrent positions
Reduce size after 2 consecutive losses
Stop Loss Guidelines
Tight stops: 0.2-0.3% for 1-2 min charts
Standard stops: 0.3-0.5% for 5 min charts
Always use stop loss - no exceptions
Place stops below support (longs) or above resistance (shorts)
Take Profit Targets
Target 1: 0.3-0.5% (take 50% off)
Target 2: 0.7-1% (take remaining 50%)
Move stop to breakeven after Target 1 hit
Trail stop if Score remains high
Time-Based Exits
Exit immediately if:
SCALP changes from LONG/SHORT to WAIT
Score drops below 3
Large diamond appears in opposite direction
Maximum hold time: 15 minutes (even if profitable)
Hard exit time: 30 minutes before market close
Trading Sessions
Best Times to Scalp
High-Liquidity Sessions
9:30-11:00 AM EST (Market open, highest volume)
2:00-3:30 PM EST (Afternoon session, good moves)
Avoid
11:30 AM-1:30 PM EST (Lunch, low volume)
Last 30 minutes (unpredictable, don't initiate new trades)
News releases (wait 5 minutes for volatility to settle)
Common Patterns & Setups
The Perfect Storm (Highest Probability)
Score = 6L or 7L
SCALP = BRIGHT GREEN
Vol + Tape = Yellow backgrounds
Green diamond appears
Price AT Support
Win rate: ~70-80%
The Fade Setup (Counter-Trend)
Price hits resistance (bright orange)
Stoch + RSI overbought (red)
Red diamond appears
CVD starts turning red
SCALP shows "SHORT"
Win rate: ~60-70%
The Breakout Continuation
Price breaks resistance (Res turns green)
EMA, MACD green
Vol surge (yellow)
Multiple green diamonds
SCALP = "LONG"
Win rate: ~65-75%
Warning Signs - DO NOT TRADE
Red Flags
❌ SCALP shows "WAIT"
❌ Score below 3
❌ Vol and Tape both gray (no volume)
❌ Conflicting signals (dashboard says LONG but red diamonds appearing)
❌ Alternating green/red circles (choppy market)
❌ Support and Resistance very close together (tight range)
Market Conditions to Avoid
Low volume periods
Major news releases (first 5 minutes after)
First 2 minutes after market open
Wide spreads
Consecutive losing trades (take a break after 2 losses)
Quick Reference Checklist
Before Taking ANY Trade:
☑ SCALP shows LONG or SHORT (not WAIT)
☑ Score is 4 or higher
☑ Vol or Tape shows activity
☑ No conflicting diamond signals
☑ Stop loss level identified
☑ Target profit level identified
☑ Not in restricted time periods
After Entering:
☑ Set stop loss immediately
☑ Set profit targets
☑ Watch SCALP column - exit if changes to WAIT
☑ Watch for opposite-colored diamonds
☑ Move stop to breakeven after first target
☑ Exit all by market close
Advanced Tips
Scalping Psychology
Be patient: Wait for Score 5+ setups
Be decisive: When signal appears, act immediately
Be disciplined: Follow your stop loss always
Be flexible: Exit quickly if dashboard reverses
Optimization
Backtest on your specific instrument
Adjust RSI/Stoch levels for your market
Fine-tune volume thresholds
Keep a trade journal to track which setups work best
Multi-Timeframe Confirmation
Use 5-min dashboard as "trend filter"
Take 1-min trades only in direction of 5-min SCALP signal
Increases win rate by ~10-15%
Troubleshooting
Q: Dashboard shows WAIT most of the time
Normal - scalping is about patience. Quality > Quantity
3-8 good setups per day is excellent
Q: Too many false signals
Increase minimum Score requirement to 5 or 6
Only trade with volume surge (yellow backgrounds)
Add large order detection confirmation
Q: Signals too slow
You may be on too high a timeframe
Try 1-minute chart for faster signals
Ensure real-time data feed is active
Q: Support/Resistance not updating
Normal - updates every 3 bars
If completely stuck, remove and re-add indicator
Summary
This scalping system works best when:
✅ Multiple indicators align (Score 5+)
✅ Volume and tape speed confirm the move
✅ Order flow (diamonds) confirms direction
✅ Price is at key levels (support/resistance)
✅ You manage risk strictly
✅ You exit before market close
The golden rule: When SCALP says WAIT, you WAIT. Discipline beats frequency.

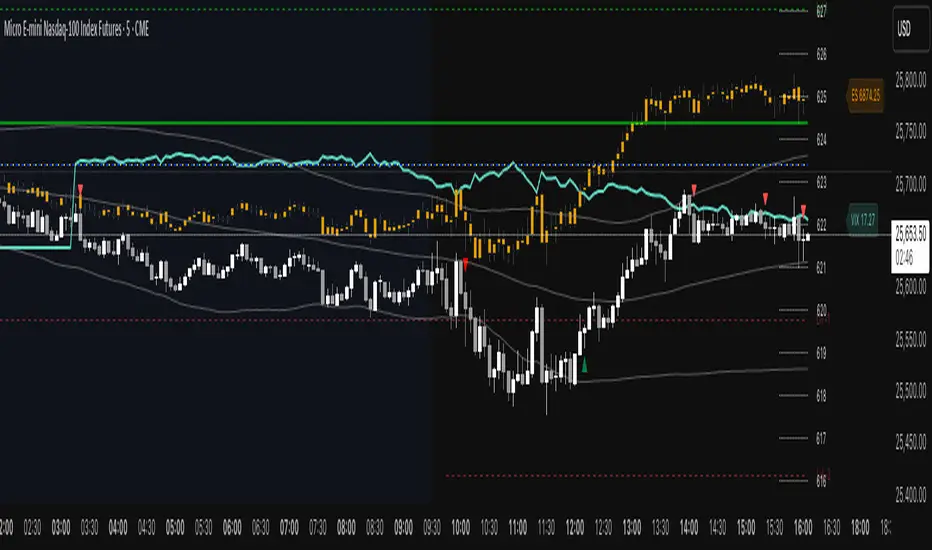
ES VIX on MNQ🧭 ES + VIX Overlay on MNQ
This indicator overlays the ES (S&P 500 futures) and VIX (Volatility Index) directly on the MNQ (Micro Nasdaq Futures) chart, allowing traders to visualize in real time the correlation, divergence, and volatility influence between the three instruments.
⸻
⚙️ How It Works
• The VIX is dynamically rescaled to the MNQ’s daily open, so its moves appear on the same price scale.
• The ES line is projected based on its percentage move relative to the session open (18:00 NY).
• Both are plotted in sync with MNQ to expose relative strength and divergence zones that often precede strong directional moves.
⸻
🧩 Inputs
• VIX Symbol: choose between VIX, CBOE:VIX, TVC:VIX
• Invert VIX Correlation: flips the VIX line for inverse-correlation setups
• VIX Step: controls how sensitively the VIX moves on the MNQ scale
• ES Symbol: defines the ES contract (e.g. ES1!)
• Show Signals: toggles on/off buy & sell markers
• Step (points): minimum distance between MNQ and VIX for a valid signal
• Block Signals: disables signals between 16:15 – 03:15 (illiquid hours)
⸻
💡 Signal Logic
The system tracks crossings between MNQ and the projected VIX line:
• Buy signal → when MNQ crosses above the VIX and expands upward by ≥ X points.
• Sell signal → when MNQ crosses below the VIX and expands downward by ≥ X points.
A time filter avoids noise during low-volume sessions.
⸻
📊 Visual Guide
• Cyan line = VIX on MNQ scale
• Orange line = ES on MNQ scale
• Labels on the right = current VIX / ES values
• BUY/SELL markers = potential volatility-based reversals
⸻
🚀 Practical Use
Perfect for traders who monitor:
• VIX–price divergence
• ES vs MNQ momentum confirmation
• Early volatility expansions before trend moves
⸻
💬 Core Idea:
“Volatility leads — price confirms.”
ETH Short-Term VWAP+EMA/RSI (ATR Risk, <1h) (James Logan)ETH Short-Term VWAP + EMA / RSI Strategy (ATR-based Risk Control)
A short-term (< 1 hour) ETH trading system designed for intraday scalps and momentum swings on 5- to 15-minute charts.
It blends trend confirmation (EMA 50 / 200) with intrabar structure (EMA 21 pullback & VWAP filter) and RSI momentum triggers, managing exits dynamically through ATR-based stop, take-profit, and trailing stop targets.
Core logic
• Long when RSI crosses above the threshold within an up-trend (EMA 50 > EMA 200) and price is above VWAP.
• Short when RSI crosses below threshold within a down-trend (EMA 50 < EMA 200) and price is below VWAP.
• Optional pullback confirmation to the 21-EMA for cleaner entries.
• Risk defined by ATR-multiples for stop-loss, take-profit, and an adaptive trailing stop.
• Automatic flat-out exit after a set number of bars (time-based close).
Best use
• 5 min – 15 min ETH/USDT charts (Binance, Bybit, Coinbase, etc.)
• Works with both spot and perpetual data.
• Tune ATR and RSI thresholds per venue; defaults are balanced for 0.05 % per-side fees.
Key parameters
• ATR SL × 1.6 ATR TP × 2.2 ATR Trail × 2.0
• RSI 50 cross | EMA 50/200 trend filter | VWAP confirmation
• Default position sizing = USD-based (e.g. $1 000 per trade).
Notes
• All orders and exits are simulated at bar close; use 1-minute bar magnifier for finer fill modeling.
• No repainting—uses only confirmed bar data.
• Best validated with ≥ 200 trades and profit factor > 1.25 over multi-month backtests.

Moving Average ProjectionDisplays 2-5 moving averages (solid lines) and projects their future trajectory (dashed lines) based on current trend momentum. This helps you anticipate where key MAs are heading and identify potential future support/resistance levels.
Important: Projections show where MAs would move IF the current trend continues—they're not predictions. Market conditions change, so use projections as planning tools, not trading signals.
General Settings
Number of MAs (2-5) controls how many moving averages display on your chart. Start with 2-3 to avoid clutter. Projection Bars (1-100) determines how far into the future to project—use 10-20 for intraday charts and 20-40 for daily charts. Lookback for Slope (2-100) sets the number of bars used to calculate trend slope, where shorter lookbacks are more responsive and longer ones are smoother. The default of 20 works well for most situations.
Individual MA Settings (MA 1-5)
Each MA has four settings: Length sets the period for the MA (common values are 9, 20, 50, 100, and 200), Type lets you choose between SMA, EMA, WMA, HMA, VWMA, or RMA (EMA is most popular), Color sets the historical MA line color, and Projection Color sets the projected line color (usually a lighter or transparent version of the main color).
MA Types Quick Reference: EMA is most popular and responsive to recent prices. SMA gives equal weight to all periods and is the smoothest. HMA is very responsive with low lag. VWMA incorporates volume data.
Quick Setup Examples
Day Trading: 3 MAs (9/21/50 EMA), 10-15 projection bars, 10-15 lookback
Swing Trading: 2 MAs (50/200 EMA), 20-30 projection bars, 20 lookback
Scalping: 2 MAs (9/20 EMA), 5-10 projection bars, 5-10 lookback
How to Use
Trend Identification: An uptrend shows price above rising MAs with projections pointing up. A downtrend shows price below falling MAs with projections pointing down. Consolidation appears as flat MAs with horizontal projections.
Support & Resistance: Rising MA projections act as future dynamic support levels, while falling MA projections act as future dynamic resistance levels.
Anticipating Changes: Watch for projected MA crossovers before they happen. When projections converge, expect volatility or consolidation. Steep projections suggest unsustainable trends, so be cautious. Flat projections indicate ranging markets.
Trade Planning: Check the current trend using MA alignment, then look at projections to gauge trend continuation likelihood. Use projected MA levels for potential targets or stop placement.
Important Tips
When Projections Work Best: Projections are most reliable in stable trending markets with consistent momentum, low volatility environments, and away from major news events.
When to Be Cautious: Use caution during high volatility or choppy price action, around major economic releases, when projections show extreme or parabolic angles, and during trend transitions.
Combine With Other Analysis: Don't trade projections alone. Use them alongside price action, volume, support and resistance levels, and other indicators for confirmation.
Best Practices
Start with 2-3 MAs to avoid chart clutter. Match your projection and lookback bars to your trading timeframe. Use consistent color schemes for quick interpretation. Adjust settings as market conditions change. Always use proper risk management—projections are planning tools, not guarantees.
Troubleshooting
Projections not showing: Check that Projection Bars > 0 and you're viewing the most recent bar
Chart too cluttered: Reduce number of MAs or increase projection color transparency
Projections too volatile: Increase lookback bars or switch to EMA/SMA from HMA
Can't see certain MAs: Verify "Number of MAs" setting includes them (MA 3 won't show if set to 2)

📋 Trading Checklist – Precision Entry SystemTake your trading discipline to the next level with this Precision Trading Checklist for TradingView. Designed for intraday traders following liquidity, structure, and Smart Money Concepts (SMC) AKA ICT Concepts, this overlay ensures you never miss a key confirmation before entering a trade.
Features:
✅ Pre-Market Preparation: Track previous session highs/lows, AM/PM sessions, and key liquidity zones.
✅ Bias & Narrative Check: Quickly confirm daily trend, price position relative to daily open, and higher timeframe confluence.
✅ Session-Specific Rules: Focused sessions like Silver Bullet (10:00–11:30), Afternoon (13:30–15:00), and Final Hour (15:00–16:00).
✅ Structure & Setup Validation: Confirm liquidity sweeps, market structure shifts, expansion candles, fair value gaps, and order blocks.
✅ Risk Management Reminders: Stop-loss, target points, risk percentage, breakeven management, and pyramiding rules.
✅ Post-Trade Journaling: Document entries, session, setup type, trade outcome, and grading for continuous improvement.
✅ Golden Rules: Visual reminders to enforce discipline, avoid emotional trades, and respect session limits.
Why Use It:
This checklist is perfect for traders who want to stay consistent, minimise mistakes, and follow a disciplined routine. Displayed as an overlay on your chart, it provides all essential checks in one glance, keeping you focused on the setup rather than scrolling through notes or separate trackers.
How to use:
Add the indicator to your chart
Click the settings/gear icon
Check off items as you complete them
The checklist on your chart updates in real-time with green checkmarks!
The checkboxes will persist as long as the indicator is on your chart,
making it perfect for tracking your pre-trade and post-trade routines!
Follow the checklist items step by step before entering trades.
Use the session-specific guidelines to filter setups.
Journal your trades post-execution for growth and analysis.

Power Balance ForecasterHey trader buddy! Remember the old IBM 5150 on Wall Street back in the 80s? :) Well, I wanted to pay tribute to it with this retro-style code when MS DOS and CRT screens were the cutting edge of technology...
Analysis of the balance of power between buyers and sellers with price predictions
What This Indicator Does
The Power Balance Forecaster indicator analyzes the relationship between buyer and seller strength to predict future price movements. Here's what it does in detail:
Main Features:
Power Balance Analysis: Calculates real-time percentage of buyer power vs seller power
Price Predictions: Estimates next closing level based on current momentum
Market State Detection: Identifies 5 different market conditions
Visual Signals: Shows directional arrows and price targets
How the Trading Logic Works
Power Balance Calculation:
Analyzes Consecutive Bars - Counts consecutive bullish and bearish bars
Calculates Momentum - Uses ATR-normalized momentum to measure trend strength
Determines Market State - Assigns one of 5 market states based on conditions
Market States:
Bull Control: Strong uptrend (75% buyer power)
Bear Control: Strong downtrend (75% seller power)
Buying Pressure: Bullish pressure (65% buyer power)
Selling Pressure: Bearish pressure (65% seller power)
Balance Area: Market in equilibrium (50/50)
Prediction System:
Bullish Condition: Buyer power > 55% + Positive momentum = Bullish prediction
Bearish Condition: Seller power > 55% + Negative momentum = Bearish prediction
Price Target: Based on ATR multiplied by timeframe factor
Configurable Parameters:
Analysis Sensitivity (5-50): Controls how responsive the indicator is
Low values (5-15): More sensitive, ideal for scalping
High values (30-50): More stable, ideal for swing trading
Table Position: Choose from 9 positions to display the data table
Trading Signals:
Green Triangle ▲: Bullish signal, price expected to increase
Green Triangle ▼: Bearish signal, price expected to decrease
Dashed Line: Shows the price target projection
Label: Displays the exact target value
Recommended Timeframes:
Lower Timeframes (1-15 minutes):
Sensitivity: 10-20
Automatic Low TF mode
Higher Timeframes (1 hour - 1 day):
Sensitivity: 25-40
Automatic High TF mode
Important Notes:
Always use this indicator in combination with:
Market context analysis
Proper risk management
Confirmation from other indicators
Mandatory stop losses
The indicator works best in trending markets and may be less effective during extreme consolidation periods.

Analog Flow [KedArc Quant]Overview
AnalogFlow is an advanced analogue based market projection engine that reconstructs future price tendencies by matching current price behavior to historical analogues in the same instrument. Instead of using traditional indicators such as moving averages, RSI, or regression, AnalogFlow applies pattern vector similarity analysis - a data driven technique that identifies historically similar sequences and aggregates their subsequent movements into a smooth, forward looking curve.
Think of it as a market memory system:
If the current pattern looks like one we have seen before, how did price move afterward?
Why AnalogFlow Is Unique
1. Pattern centric - it does not rely on any standard indicator formula; it directly analyzes price movement vectors.
2. Adaptive - it learns from the same instrument's past behavior, making it self calibrating to volatility and regime shifts.
3. Non repainting - the projection is generated on the latest completed bar and remains fixed until new data is available.
4. Noise resistant - the EMA Blend engine smooths the projected trajectory, reducing random variance between analogues.
Inputs and Configuration
Pattern Bars
Number of bars in the reference pattern window: 40
Projection Bars
Number of bars forward to project: 30
Search Depth
Number of bars back to look for matching analogues: 600
Distance Metric
Comparison method: Euclidean, Manhattan, or Cosine (default Euclidean)
Matches
Number of top analogues to blend (1-5): Top 3
Build Mode
Projection type: Cumulative, MeanStep, or EMA Blend (default EMA Blend)
EMA Blend Length
Smoothness of the projected path: 15
Normalize Pattern
Enable Z score normalization for shape matching: true
Dissimilarity Mode
If true, finds inverse analogues for mean reversion analysis: false
Line Color and Width
Style settings for projection curve: Blue, width 2
How It Works with Past Data
1. The system builds a memory bank of patterns from the last N bars based on the scanDepth value.
2. It compares the latest Pattern Bars segment to each historical segment.
3. It selects the Top K most similar or dissimilar analogues.
4. For each analogue, it retrieves what happened after that pattern historically.
5. It averages or smooths those forward moves into a single composite forecast curve.
6. The forecast (blue line) is drawn ahead of the current candle using line.new with no repainting.
Output Explained
Blue Path
The weighted mean future trajectory based on historical analogues.
Smoother when EMA Blend mode is enabled.
Flat Section
Indicates low directional consensus or equilibrium across analogues.
Upward or Downward Slope
Represents historical tendency toward continuation or reversal following similar conditions.
Recommended Timeframes
Scalping / Short Term
1m - 5m : Short winLen (20-30), small ahead (10-15)
Swing Trading
15m - 1h : Balanced settings (winLen 40-60, ahead 20-30)
Positional / Multi Day
4h - 1D : Large windows (winLen 80-120, ahead 30-50)
Instrument Compatibility
Works seamlessly on:
Stocks and ETFs
Indices
Cryptocurrency
Commodities (Gold, Crude, etc.)
Futures and F&O (both intraday and positional)
Forex
No symbol specific calibration needed. It self adapts to volatility.
How Traders Can Use It
Forecast Context
Identify likely short term price path or drift direction.
Reversal Detection
Flip seekOpp to true for mean reversion pattern analysis.
Scenario Comparison
Observe whether the current regime tends to continue or stall.
Momentum Confirmation
Combine with trend tools such as EMA or MACD for directional bias.
Backtesting Support
Compare projected path versus realized price to evaluate reliability.
FAQ
Q1. Does AnalogFlow repaint?
No. It calculates only once per completed bar and projects forward. The future path remains static until a new bar closes.
Q2. Is it a neural network or AI model?
Not in the machine learning sense. It is a deterministic analogue matching engine using statistical distance metrics.
Q3. Why does the projection sometimes flatten?
That means similar historical setups had no clear consensus in direction (neutral expectation).
Q4. Can I use it for live trading signals?
AnalogFlow is not a signal generator. It provides probabilistic context for upcoming movement.
Q5. Does higher scanDepth improve accuracy?
Up to a point. More depth gives more analogues, but too much can dilute recency. Try 400 to 800.
Glossary
Analogue
A past pattern similar to the current price behavior.
Distance Metric
Mathematical formula for pattern similarity.
Step Vector
Difference between consecutive closing prices.
EMA Blend
Exponential smoothing of the projected path.
Cumulative Mode
Adds sequential historical deltas directly.
Z Score Normalization
Rescaling to mean 0 and variance 1 for shape comparison.
Summary
AnalogFlow converts the market's historical echoes into a structured, statistically weighted forward projection. It gives traders a contextual roadmap, not a signal, showing how similar past setups evolved and allowing better informed entries, exits, and scenario planning across all asset classes.
Disclaimer
This script is provided for educational purposes only.
Past performance does not guarantee future results.
Trading involves risk, and users should exercise caution and proper risk management when applying this strategy.

Sigma Trinity ModelAbstract
Sigma Trinity Model is an educational framework that studies how three layers of market behavior interact within the same trend: (1) structural momentum (Rasta), (2) internal strength (RSI), and (3) continuation/compounding structure (Pyramid). The model deliberately combines bar-close momentum logic with intrabar, wick-aware strength checks to help users see how reversals form, confirm, and extend. It is not a signal service or automation tool; it is a transparent learning instrument for chart study and backtesting.
Why this is not “just a mashup”
Many scripts merge indicators without explaining the purpose. Sigma Trinity is a coordinated, three-engine study designed for a specific learning goal:
Rasta (structure): defines when momentum actually flips using a dual-line EMA vs smoothed EMA. It gives the entry/exit framework on bar close for clean historical study.
RSI (energy): measures internal strength with wick-aware triggers. It uses RSI of LOW (for bottom touches/reclaims) and RSI of HIGH (for top touches/exhaustion) so users can see intrabar strength/weakness that the close can hide.
Pyramid (progression): demonstrates how continuation behaves once momentum and strength align. It shows the logic of adds (compounding) as a didactic layer, also on bar close to keep historical alignment consistent.
These three roles are complementary, not redundant: structure → strength → progression.
Architecture Overview
Execution model
Rasta & Pyramid: bar close only by default (historically stable, easy to audit).
RSI: per tick (realtime) with bar-close backup by default, using RSI of LOW for entries and RSI of HIGH for exits. This makes the module sensitive to intra-bar wicks while still giving a close-based safety net for backtests.
Stops (optional in strategy builds): wick-accurate: trail arms/ratchets on HIGH; stop hit checks with LOW (or Close if selected) with a small undershoot buffer to avoid micro-noise hits.
Visual model
Dual lines (EMA vs smoothed EMA) for Rasta + color fog to see direction and compression/expansion.
Rungs (small vertical lines) drawn between the two Rasta lines to visualize wave spacing and rhythm.
Clean labels for Entry/Exit/Pyramid Add/RSI events. Everything is state-locked to avoid spamming.
Module 1 — Rasta (Structural Momentum Layer)
Goal: Identify structural momentum reversals and maintain a consistent, replayable backbone for study.
Method:
Compute an EMA of a chosen price source (default Close), and a smoothed version (SMA/EMA/RMA/WMA/None selectable).
Flip points occur when the EMA line crosses the smoothed line.
Optional EMA 8/21 trend filter can gate entries (long-bias when EMA8 > EMA21). A small “adaptive on flip” option lets an entry fire when the filter itself flips to ON and the EMA is already above the smoothed line—useful for trend resumption.
Why bar close only?
Bar-close Rasta gives a stable, auditable timeline for the structure of the trend. It teaches users to separate “structure” (close-resolved) from “energy” (intrabar, via RSI).
Visuals:
Fog between the lines (green/red) to show regime.
Rungs between lines to show spread (compression vs expansion).
Optional plotting of EMA8/EMA21 so users can see the gating effect.
Module 2 — RSI (Internal Strength / Energy Layer)
Goal: Reveal the intrabar strength/weakness that often precedes or confirms structural flips.
Method:
Standard RSI with adjustable length and signal smoothing for the panel view.
Logic uses wick-aware sources:
Entry trigger: RSI of LOW (same RSI length) touching or below a lower band (default 15). Think of it as intraband reactivation from the bottom, using the candle’s deepest excursion.
Exit trigger: RSI of HIGH touching or above an upper band (default 85). Think of it as exhaustion at the top, using the candle’s highest excursion.
Realtime + Close Backup: fires intrabar on tick, but if the realtime event was missed, the close backup will note it at bar end.
Cooldown control: optional bars-between-signals to avoid rapid re-triggers on choppy sequences.
Why wick-aware RSI?
A close-only RSI can miss the true micro-extremes that cause reversals. Using LOW/HIGH for triggers captures the behavior that traders actually react to during the bar, while the bar-close backup preserves historical reproducibility.
Module 3 — Pyramid (Continuation / Compounding Layer)
Goal: Teach how continuation behaves once a trend is underway, and how adds can be structured.
Method:
Same dual-line logic as Rasta (EMA vs smoothed EMA), but only fires when already in a position (or after prior entry conditions).
Supports the same EMA 8/21 filter and optional adaptive-on-flip behavior.
Bar close only to maintain historical cohesion.
What it teaches:
Adds tend to cluster when momentum persists.
Students can experiment with add spacing and compare “one-shot entries” vs “laddered adds” during strong regimes.
How the Pieces Work Together
Rasta establishes the structural frame (when the wave flip is real enough to record at close).
RSI validates or challenges that structure by tracking intrabar energy at the extremes (low/high touches).
Pyramid shows what sustained continuation looks like once (1) and (2) align.
This produces a layered view: Structure → Energy → Progression. Users can see when all three line up (strongest phases) and when they diverge (riskier phases or transitions).
How to Use It (Step-by-Step)
Quick Start
Apply script to any symbol/timeframe.
In Strategy/Indicator Properties:
Enable On every tick (recommended).
If available, enable Using bar magnifier and choose a lower resolution (e.g., 1m) to simulate intrabar fills more realistically.
Keep On bar close unchecked if you want to observe realtime logic in live charts (strategies still place orders on close by platform design).
Default behavior: Rasta & Pyramid = bar close; RSI = per tick with close backup.
Reading the Chart
Watch for Rasta Entry/Exit labels: they define clean structural turns on close.
Watch RSI Entry (LOW touch at/below lower band) and RSI Exit (HIGH touch at/above upper band) to gauge internal energy extremes.
Pyramid Add labels reveal continuation phases once a move is already in progress.
Tuning
Rasta smoothing: choose SMA/EMA/RMA/WMA or None. Higher smoothing → later but cleaner flips; lower smoothing → earlier but choppier.
RSI bands: a common educational setting is 15/85 for strong extremes; 20/80 is a bit looser.
Cooldown: increase if you see too many RSI re-fires in chop.
EMA 8/21 filter: toggle ON to study “trend-gated” entries, OFF to study raw momentum flips.
Backtesting Notes (for Strategy Builds)
Stops (optional): trail is armed when price advances by a trigger (default D–F₀), ratchets only upward from HIGH, and hits from LOW (or Close if chosen) with a tiny undershoot buffer to avoid micro-wicks.
Order sequencing per bar (mirrors the script’s code comments):
Trail ratchet via HIGH
Intrabar stop hit via LOW/CLOSE → immediate close
If still in position at bar close: process exits (Rasta/RSI)
If still in position at bar close: process Pyramid Add
If flat at bar close: process entries (Rasta/RSI)
Platform reality: strategies place orders at bar close in historical testing; the intrabar logic improves realism for stops and event marking but final order timestamps are still close-resolved.
Inputs Reference (common)
Modules: enable/disable RSI and Pyramid learning layers.
Rasta: EMA length, smoothing type/length, EMA8/21 filter & adaptive flip, fog opacity, rungs on/off & limit.
RSI: RSI length, signal MA length (panel), Entry band (LOW), Exit band (HIGH), cooldown bars, labels.
Pyramid: EMA length, smoothing, EMA8/21 filter & adaptive adds.
Execution: toggle Bar Close Only for Rasta/Pyramid; toggle Realtime + Close Backup for RSI.
Stops (strategy): Fixed Stop % (first), Fixed Stop % (add), Trail Distance %, Trigger rule (auto D–F₀ or custom), undershoot buffer %, and hit source (LOW/CLOSE).
What to Study With It
Convergence: how often RSI-LOW entry touches precede the next Rasta flip.
Divergence: cases where RSI screams exhaustion (HIGH >= upper band) but Rasta hasn’t flipped yet—often transition zones.
Continuation: how Pyramid adds cluster in strong moves; how spacing changes with smoothing/filter choices.
Regime changes: use EMA8/21 filter toggles to see what happens at macro turns vs chop.
Limitations & Scope
This is a learning tool, not a trade copier. It does not provide financial advice or automated execution.
Intrabar results depend on data granularity; bar magnifier (when available) can help simulate lower-resolution ticks, but true tick-by-tick fills are a platform-level feature and not guaranteed across all symbols.
Suggested Publication Settings (Strategy)
Initial capital: 100
Order size: 100 USD (cash)
Pyramiding: 10
Commission: 0.25%
Slippage: 3 ticks
Recalculate: ✓ On every tick
Fill orders: ✓ Using bar magnifier (choose 1m or similar); leave On bar close unchecked for live viewing.
Educational License
Released under the Michael Culpepper Gratitude License (2025).
Use and modify freely for education and research with attribution. No resale. No promises of profitability. Purpose is understanding, not signals.

Directional Strength and Momentum Index█ OVERVIEW
“Directional Strength and Momentum Index” (DSMI) is a technical analysis indicator inspired by DMI, but due to different source data, it produces distinct results. DSMI combines direction measurement, trend strength, and overheat levels into a single index, enhanced with gradient fills, extreme zones, entry signals, candle coloring, and a summary table.
█ CONCEPT
The classic DMI, despite its relatively simple logic, can seem somewhat chaotic due to separate +DI and -DI lines and the need for manual interpretation of their relationships. The DSMI indicator was created to increase clarity and speed up results, consolidating key information into a single index from 0 to 100 that simultaneously:
- Indicates trend direction (bullish/bearish)
- Measures movement strength
- Identifies overheat levels
- Generates ready entry signals
DMI (ADX + +DI / -DI) measures trend direction and strength, but does so based solely on comparing price movements between candles. ADX shows whether the trend is orderly and growing (e.g., above 20–30), but does not assess how dynamic the movement is.
DSMI, on the other hand, takes into account candle size and actual market aggression, thus showing directional momentum — whether the trend has real “fuel” to sustain or accelerate, not just whether it is orderly.
The main calculation difference involves replacing True Range with candle size (high-low) and using directional EMA instead of Wilder smoothing. This allows DSMI to react faster to momentum changes, eliminating delays typical of classic DMI based on TR.
This gives the trader an immediate picture of the market situation without analyzing multiple lines.
█ FEATURES
DSMI Main Line:
- EMA(Directional Index) based on +DS and -DS
- Scale 0–100, smooth color gradient depending on strength
+DS / -DS:
- Positive and Negative Directional Strength
- Gradient fill between lines — more intense with stronger trend
Extreme Zones:
- Default 20 and 80
- Gradient fill outside zones
Trend Strength Levels:
- Weak (<10) → neutral
- Moderate (up to 35)
- Strong (up to 45)
- Overheated (up to 55)
- Extreme (>55)
All levels editable
Entry Signals:
- Activated on crossing entry level (default 20)
Or on direction change when DSMI already ≥ entry level
- Highlighted background (green/red)
Candle Coloring:
- According to current trend
Trend Strength Table:
- Top-right corner
- Shows current strength (WEAK/STRONG etc.) + DSMI value
Alerts:
- DSMI Bullish Entry
- DSMI Bearish Entry
█ HOW TO USE
Add to Chart: Paste code in Pine Editor or find in indicator library.
Settings:
DSMI Parameters:
- DSMI Period → default 20
- Show DSMI Line → on/off
Extreme Zones:
- Lower Level → default 20
- Upper Level → default 80
Trend Strength Levels:
- Weak, Moderate, Strong, Overheated → adjust to strategy
Trend Colors:
- BULLISH → default green
- BEARISH → default red
- NEUTRAL → gray
Entry Signals:
- Show Highlight → on/off
- DSMI Entry Level → default 20
Signal Interpretation:
- DSMI Line: Main strength indicator.
- Gradient between +DS and -DS: Visualizes side dominance.
- Crossing 18 with direction confirmation → entry signal.
- Extreme Zones: Potential reversal or continuation points after correction.
- Table: Quick overview of current trend condition.
█ APPLICATIONS
The indicator works well in:
- Trend-following: Enter on signal, exit on direction change or overheat. When a new trend appears, consider entering a position, preferably with a rising trend strength indicator.
- Scalping/daytrading: Shorter period (7–10), lower entry level.
- Swing/position: Longer period (20–30), higher entry level, extreme zones as filters.
- Noise filtering: Ignores consolidation below “Weak” – increasing value e.g. to 15 highlights consolidation zones, but no signals appear there.
Style Adjustment:
- Aggressive strategies → shorten period and entry level
- Conservative → extend period, raise entry level (25–30), watch “Overheated”
“Weak” level (<10 default) → neutral; increasing it e.g. to 15 gives fewer but higher-quality signals. The Weak zone value controls the level below which no signals appear, and the gradient turns gray (often aligned with consolidation zones).
Combine with:
- Support/resistance levels
- Fair Value Gaps (FVG)
- Volume (Volume Profile, VWAP)
- Other oscillators (RSI, Stochastic)
█ NOTES
- Works on all markets and timeframes.
- Adjust period and levels to instrument volatility.
- Higher entry level → fewer signals, higher quality.
- Neutral color below “Weak” – avoids trading in consolidation.
- Gradient and table enable quick assessment without line analysis.

ADX Color Change by BehemothI find this tool to be the most valuable and accurate entry point indicator along with moving averages and the VWAP.
ADX Color Indicator - Controls & Intraday Trading Benefits
Indicator Controls:
1. ADX Length (default: 14)
- Controls the calculation period for ADX
- Lower values (7-10) = more sensitive, faster signals (better for scalping)
- Higher values (14-20) = smoother, fewer false signals (better for swing trades)
- *Intraday tip:* Try 10-14 for most intraday timeframes
2. Show Threshold Levels (default: On)
- Displays the 20 and 25 horizontal lines
- Helps you quickly identify when ADX crosses key strength levels
3. Use Custom Timeframe (default: Off)
- Allows viewing higher timeframe ADX on lower timeframe charts
- *Example:* Trade on 5-min chart but see 15-min or 1-hour ADX
4. Custom Timeframe
- Select any timeframe: 1m, 5m, 15m, 30m, 1H, 4H, D, etc.
- *Intraday tip:* Use 15m or 1H ADX on 5m charts for better trend context
5. Show +DI and -DI (default: Off)
- Shows directional movement indicators
- Green line (+DI) > Red line (-DI) = bullish trend
- Red line (-DI) > Green line (+DI) = bearish trend
6. Show Background Zon es (default: Off)
- Visual background colors for quick trend strength identification
- Green = strong trend (ADX > 25)
- Yellow = moderate trend (ADX 20-25)
Intraday Trading Benefits:
1. Avoid Choppy Markets
- When ADX < 20 (no background color), market is ranging
- Reduces false breakout trades and whipsaws
- Save time and capital by stepping aside during low-quality setups
2. Identify High-Probability Trend Trades
- **Green line + Green zone** = strong trend building, look for pullback entries
- Yellow line crossing above 20 = early trend formation signal
- Catch trends early when ADX starts rising from below 20
3. Multi-Timeframe Analysis
- Use custom timeframe to align with higher timeframe trends
- *Example:* If 1H ADX shows green (strong trend), take breakout trades on 5m chart in same direction
- Increases win rate by trading with the bigger picture
4. Exit Signals
- When ADX turns red (falling), trend is weakening
- Consider tightening stops or taking profits
- Avoid entering new positions when ADX is declining
5. Quick Visual Confirmation
- Color coding eliminates need to analyze numbers
- Instant recognition: Green = go, Yellow = caution, Red = trend dying
- Faster decision-making during fast market moves
6. Scalping Strategy
- Set ADX length to 7-10 for sensitive signals
- Only scalp when ADX is rising (blue, yellow, or green)
- Exit when ADX turns red
7. Breakout Confirmation
- Wait for ADX to rise above 20 after a breakout
- Filters false breakouts in ranging markets
- Yellow or green color confirms momentum behind the move
Optimal Intraday Settings:
- Day Trading (5-15 min charts):** ADX Length = 10-14
- Scalping (1-5 min charts):** ADX Length = 7-10, watch custom 15m timeframe
- Swing Intraday (30min-1H charts):** ADX Length = 14-20
Simple Trading Rules:
✅ Trade: ADX rising + above 20 (yellow or green)
⚠️ Caution: ADX flat or just crossed 20
❌ Avoid:*ADX falling (red) or below 20
The key advantage is staying out of low-quality, choppy price action which is where most intraday traders lose money!

[Parth🇮🇳] Wall Street US30 Pro - Prop Firm Edition....Yo perfect! Here's the COMPLETE strategy in simple words:
***
## WALL STREET US30 TRADING STRATEGY - SIMPLE VERSION
### WHAT YOU'RE TRADING:
US30 (Dow Jones Index) on 1-hour chart using a professional indicator with smart money concepts.
---
### WHEN TO TRADE:
**6:30 PM - 10:00 PM IST every day** (London-NY overlap = highest volume)
***
### THE INDICATOR SHOWS YOU:
A table in top-right corner with 5 things:
1. **Signal Strength** - How confident (need 70%+)
2. **RSI** - Momentum (need OK status)
3. **MACD** - Trend direction (need UP for buys, DOWN for sells)
4. **Volume** - Real or fake move (need HIGH)
5. **Trend** - Overall direction (need UP for buys, DOWN for sells)
Plus **green arrows** (buy signals) and **red arrows** (sell signals).
---
### THE RULES:
**When GREEN ▲ arrow appears:**
- Wait for 1-hour candle to close (don't rush in)
- Check the table:
- Signal Strength 70%+ ? ✅
- Volume HIGH? ✅
- RSI okay? ✅
- MACD up? ✅
- Trend up? ✅
- If all yes = ENTER LONG (BUY)
- Set stop loss 40-50 pips below entry
- Set take profit 2x the risk (2:1 ratio)
**When RED ▼ arrow appears:**
- Wait for 1-hour candle to close (don't rush in)
- Check the table:
- Signal Strength 70%+ ? ✅
- Volume HIGH? ✅
- RSI okay? ✅
- MACD down? ✅
- Trend down? ✅
- If all yes = ENTER SHORT (SELL)
- Set stop loss 40-50 pips above entry
- Set take profit 2x the risk (2:1 ratio)
***
### REAL EXAMPLE:
**7:45 PM IST - Green arrow appears**
Table shows:
- Signal Strength: 88% 🔥
- RSI: 55 OK
- MACD: ▲ UP
- Volume: 1.8x HIGH
- Trend: 🟢 UP
All checks pass ✅
**8:00 PM - Candle closes, signal confirmed**
I check table again - still strong ✓
**I enter on prop firm:**
- BUY 0.1 lot
- Entry: 38,450
- Stop Loss: 38,400 (50 pips below)
- Take Profit: 38,550 (100 pips above)
- Risk: $50
- Reward: $100
- Ratio: 1:2 ✅
**9:30 PM - Price hits 38,550**
- Take profit triggered ✓
- +$100 profit
- Trade closes
**Done for that signal!**
***
### YOUR DAILY ROUTINE:
**6:30 PM IST** - Open TradingView + prop firm
**6:30 PM - 10 PM IST** - Watch for signals
**When signal fires** - Check table, enter if strong
**10:00 PM IST** - Close all trades, done
**Expected daily** - 1-3 signals, +$100-300 profit
***
### EXPECTED RESULTS:
**Win Rate:** 65-75% (most trades win)
**Signals per day:** 1-3
**Profit per trade:** $50-200
**Daily profit:** $100-300
**Monthly profit:** $2,000-6,000
**Monthly return:** 20-30% (on $10K account)
---
### WHAT MAKES THIS WORK:
✅ Uses 7+ professional filters (not just 1 indicator)
✅ Checks volume (real moves only)
✅ Filters overbought/oversold (avoids tops/bottoms)
✅ Aligns with 4-hour trend (higher timeframe)
✅ Only trades peak volume hours (6:30-10 PM IST)
✅ Uses support/resistance (institutional levels)
✅ Risk/reward 2:1 minimum (math works out)
***
### KEY DISCIPLINE RULES:
**DO:**
- ✅ Only trade 6:30-10 PM IST
- ✅ Wait for candle to close
- ✅ Check ALL 5 table items
- ✅ Only take 70%+ strength signals
- ✅ Always use stop loss
- ✅ Always 2:1 reward ratio
- ✅ Risk 1-2% per trade
- ✅ Close all trades by 10 PM
- ✅ Journal every trade
- ✅ Follow the plan
**DON'T:**
- ❌ Trade outside 6:30-10 PM IST
- ❌ Enter before candle closes
- ❌ Take weak signals (below 70%)
- ❌ Trade without stop loss
- ❌ Move stop loss (lock in loss)
- ❌ Hold overnight
- ❌ Revenge trade after losses
- ❌ Overleverge (more than 0.1 lot start)
- ❌ Skip journaling
- ❌ Deviate from plan
***
### THE 5-STEP ENTRY PROCESS:
**Step 1:** Arrow appears on chart ➜
**Step 2:** Wait for candle to close ➜
**Step 3:** Check table (all 5 items) ➜
**Step 4:** If all good = go to prop firm ➜
**Step 5:** Enter trade with SL & TP
Takes 30 seconds once you practice!
***
### MONEY MATH (Starting with $5,000):
**If you take 20 signals per month:**
- Win 15, Lose 5 (75% rate)
- Wins: 15 × $100 = $1,500
- Losses: 5 × $50 = -$250
- Net: +$1,250/month = 25% return
**Month 2:** $5,000 + $1,250 = $6,250 account
**Month 3:** $6,250 + $1,562 = $7,812 account
**Month 4:** $7,812 + $1,953 = $9,765 account
**Month 5:** $9,765 + $2,441 = $12,206 account
**Month 6:** $12,206 + $3,051 = $15,257 account
**In 6 months = $10,000 account → $15,000+ (50% growth)**
That's COMPOUNDING, baby! 💰
***
### START TODAY:
1. Copy indicator code
2. Add to 1-hour US30 chart on TradingView
3. Wait until 6:30 PM IST tonight (or tomorrow if late)
4. Watch for signals
5. Follow the rules
6. Trade your prop firm
**That's it! Simple as that!**
***
### FINAL WORDS:
This isn't get-rich-quick. This is build-wealth-steadily.
You follow the plan, take quality signals only, manage risk properly, you WILL make money. Not every trade wins, but the winners are bigger than losers (2:1 ratio).
Most traders fail because they:
- Trade too much (overtrading)
- Don't follow their plan (emotions)
- Risk too much per trade (blown account)
- Chase signals (FOMO)
- Don't journal (repeat mistakes)
You avoid those 5 things = you'll be ahead of 95% of traders.
**Start trading 6:30 PM IST. Let's go! 🚀**

FVG MagicFVG Magic — Fair Value Gaps with Smart Mitigation, Inversion & Auto-Clean-up
FVG Magic finds every tradable Fair Value Gap (FVG), shows who powered it, and then manages each gap intelligently as price interacts with it—so your chart stays actionable and clean.
Attribution
This tool is inspired by the idea popularized in “Volumatic Fair Value Gaps ” by BigBeluga (licensed CC BY-NC-SA 4.0). Credit to BigBeluga for advancing FVG visualization in the community.
Important: This is a from-scratch implementation—no code was copied from the original. I expanded the concept substantially with a different detection stack, a gap state machine (ACTIVE → 50% SQ → MITIGATED → INVERSED), auto-clean up rules, lookback/nearest-per-side pruning, zoom-proof volume meters, and timeframe auto-tuning for 15m/H1/H4.
What makes this version more accurate
Full-coverage detection (no “missed” gaps)
Default ICT-minimal rule (Bullish: low > high , Bearish: high < low ) catches all valid 3-candle FVGs.
Optional Strict filter (stricter structure checks) for traders who prefer only “clean” gaps.
Optional size percentile filter—off by default so nothing is hidden unless you choose to filter.
Correct handling of confirmations (wick vs close)
Mitigation Source is user-selectable: high/low (wick-based) or close (strict).
This avoids false “misses” when you expect wick confirmations (50% or full fill) but your logic required closes.
State-aware labelling to prevent misleading data
The Bull%/Bear% meter is shown only while a gap is ACTIVE.
As soon as a gap is 50% SQ, MITIGATED, or INVERSED, the meter is hidden and replaced with a clear tag—so you never read stale participation stats.
Robust zoom behaviour
The meter uses a fixed bar-width (not pixels), so it stays proportional and readable at any zoom level.
Deterministic lifecycle (no stale boxes)
Remove on 50% SQ (instant or delayed).
Inversion window after first entry: if price enters but doesn’t invert within N bars, the box auto-removes once fully filled.
Inversion clean up: after a confirmed flip, keep for N bars (context) then delete (or 0 = immediate).
Result: charts auto-maintain themselves and never “lie” about relevance.
Clarity near current price
Nearest-per-side (keep N closest bullish & bearish gaps by distance to the midpoint) focuses attention where it matters without altering detection accuracy.
Lookback (bars) ensures reproducible behaviour across accounts with different data history.
Timeframe-aware defaults
Sensible auto-tuning for 15m / H1 / H4 (right-extension length, meter width, inversion windows, clean up bars) to reduce setup friction and improve consistency.
What it does (under the hood)
Detects FVGs using ICT-minimal (default) or a stricter rule.
Samples volume from a 10× lower timeframe to split participation into Bull % / Bear % (sum = 100%).
Manages each gap through a state machine:
ACTIVE → 50% SQ (midline) → MITIGATED (full) → INVERSED (SR flip after fill).
Auto-clean up keeps only relevant levels, per your rules.
Dashboard (top-right) displays counts by side and the active state tags.
How to use it
First run (show everything)
Use Strict FVG Filter: OFF
Enable Size Filter (percentile): OFF
Mitigation Source: high/low (wick-based) or close (stricter), as you prefer.
Remove on 50% SQ: ON, Delay: 0
Read the context
While ACTIVE, use the Bull%/Bear% meter to gauge demand/supply behind the impulse that created the gap.
Confluence with your HTF structure, sessions, VWAP, OB/FVG, RSI/MACD, etc.
Trade interactions
50% SQ: often the highest-quality interaction; if removal is ON, the box clears = “job done.”
Full mitigation then rejection through the other side → tag changes to INVERSED (acts like SR). Keep for N bars, then auto-remove.
Keep the chart tidy (optional)
If too busy, enable Size Filter or set Nearest per side to 2–4.
Use Lookback (bars) to make behaviour consistent across symbols and histories.
Inputs (key ones)
Use Strict FVG Filter: OFF(default)/ON
Enable Size Filter (percentile): OFF(default)/ON + threshold
Mitigation Source: high/low or close
Remove on 50% SQ + Delay
Inversion window after entry (bars)
Remove inversed after (bars)
Lookback (bars), Nearest per side (N)
Right Extension Bars, Max FVGs, Meter width (bars)
Colours: Bullish, Bearish, Inversed fill
Suggested defaults (per TF)
15m: Extension 50, Max 12, Inversion window 8, Clean up 8, Meter width 20
H1: Extension 25, Max 10, Inversion window 6, Clean up 6, Meter width 15
H4: Extension 15, Max 8, Inversion window 5, Clean up 5, Meter width 10
Notes & edge cases
If a wick hits 50% or the far edge but state doesn’t change, you’re likely on close mode—switch to high/low for wick-based behaviour.
If a gap disappears, it likely met a clean up condition (50% removal, inversion window, inversion clean up, nearest-per-side, lookback, or max-cap).
Meters are hidden after ACTIVE to avoid stale percentages.

MTF 20 SMA Table - DXY**MTF 20 SMA Table - Multi-Timeframe Trend Analysis Dashboard**
**Overview:**
This indicator provides a comprehensive multi-timeframe analysis dashboard that displays the relationship between price and the 20-period Simple Moving Average (SMA) across four key timeframes: 15-minute, 1-hour, 4-hour, and Daily. It's designed to help traders quickly identify trend alignment and potential trading opportunities across multiple timeframes at a glance. It's definitely not perfect but has helped me speed up my backtesting efforts as it's worked well for me eliminating flipping back and forth between timeframes excpet when I have confluence on the table, then I check the HTF.
**How It Works:**
The indicator creates a table overlay on your chart showing three critical metrics for each timeframe:
1. **Price vs SMA (Row 1):** Shows whether price is currently above (bullish) or below (bearish) the 20 SMA
- Green = Price Above SMA
- Red = Price Below SMA
2. **SMA Direction (Row 2):** Indicates the trend direction of the SMA itself over a lookback period
- Green (↗ Rising) = Uptrend
- Red (↘ Falling) = Downtrend
- Gray (→ Flat) = Ranging/Consolidation
3. **Strength (Row 3):** Displays the distance between current price and the SMA in pips
- Purple background = Strong move (>50 pips away)
- Orange background = Moderate move (20-50 pips)
- Gray background = Weak/consolidating (<20 pips)
- Text color: Green for positive distance, Red for negative
**Key Features:**
- **Customizable Table Position:** Place the table anywhere on your chart (9 position options)
- **Adjustable SMA Lengths:** Modify the SMA period for each timeframe independently (default: 20)
- **Direction Lookback Settings:** Fine-tune how far back the indicator looks to determine SMA direction for each timeframe
- **Flat Threshold:** Set the pip threshold for determining when an SMA is "flat" vs trending (default: 5 pips)
- **DXY Optimized:** Calculations are calibrated for the US Dollar Index (1 pip = 0.01)
**Best Use Cases:**
1. **Trend Alignment:** Identify when multiple timeframes align in the same direction for higher probability trades
2. **Divergence Spotting:** Detect when lower timeframes diverge from higher timeframes (potential reversals)
3. **Entry Timing:** Use lower timeframe signals while higher timeframes confirm overall trend
4. **Strength Assessment:** Gauge how extended price is from the mean (SMA) to avoid overextended entries
**Settings Guide:**
- **SMA Settings Group:** Adjust the SMA period for each timeframe (15M, 1H, 4H, Daily)
- **SMA Direction Group:** Control lookback periods to determine trend direction
- 15M: Default 5 candles
- 1H: Default 10 candles
- 4H: Default 15 candles
- Daily: Default 20 candles
- **Flat Threshold:** Set sensitivity for "flat" detection (lower = more sensitive to ranging markets)
**Trading Strategy Examples:**
1. **Trend Following:** Look for all timeframes showing the same direction (all green or all red)
2. **Pullback Trading:** When Daily/4H are green but 15M/1H show red, wait for lower timeframes to flip green for entry
3. **Ranging Markets:** When multiple SMAs show "flat", consider range-bound strategies
**Important Notes:**
- This is a reference tool only, not a standalone trading system
- Always use proper risk management and combine with other analysis methods
- Best suited for trending instruments like indices and major forex pairs
- Calculations are optimized for DXY but can be used on other instruments (pip calculations may need adjustment)
**Credits:**
Feel free to modify and improve this code! Suggestions for enhancements are welcome in the comments.
---
**Installation Instructions:**
1. Add the indicator to your TradingView chart
2. Adjust the table position via settings to avoid overlap with price action
3. Customize SMA lengths and lookback periods to match your trading style
4. Monitor the table for timeframe alignment and trend confirmation
---
This indicator is published as open source for the community to learn from and improve upon. Happy trading! 📈
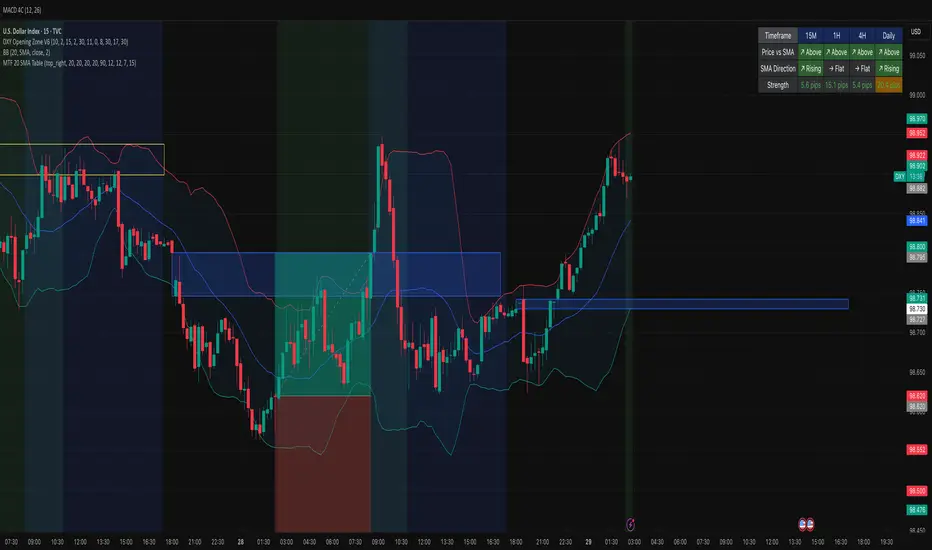
Zarks 4H Range, 15M Triggers Pt2🕓 4-Hour Structure Dividers ⏰
📈 Vertical lines represent each 4-hour candle broken down into smaller execution timeframes — perfect for aligning entries across 15-minute, 5-minute, and 1-minute charts.
🧭 The lines remain true and synchronized with the 4-hour structure, ensuring timing accuracy:
⏱ 15-Minute: Lines appear at :45 of each corresponding hour
⚙️ 5-Minute: Lines appear at :55 of each corresponding hour
🔹 1-Minute: Lines appear at :59 of each corresponding hour
🎯 Use these precise vertical dividers to visualize higher-timeframe structure while executing on lower-timeframe setups — ideal for confluence traders combining HTF bias with LTF precision.

Zarks 4H Range, 15M Triggers Pt1HTF Dividers + 4H Candle Structure + CRT Reference Tool
🔹 Vertical Blue Lines → represent divisions of the 4-hour timeframe, helping you visually segment intraday structure into HTF blocks.
Green Dotted Line → marks the High of each 4-hour interval.
🔵 Blue Dotted Line → shows the Open of that 4-hour interval.
⚫ Gray Dotted Line → displays the Close of that 4-hour interval.
🔴 Red Dotted Line → highlights the Low of that 4-hour interval.
💡 CRT Concepts (Candle Range Theory by Romeo TPT)
CRT signals are not direct buy/sell signals ❌💰 — they serve as contextual reference points 🧭.
A high-probability setup often appears when:
A 4H sweep of a previous candle’s high occurs 🐢 (liquidity manipulation),
Followed by a bearish 15-minute close,
Targeting the 50% retracement of that 4H candle’s range 🎯.
📊 Use this tool to frame market structure across timeframes, align entries with liquidity events, and visualize when price may be expanding from or reverting to institutional reference points.
This indicator is meant to be combined with vertical lines on the 15 min time frame at corresponding times example 1:45,4:45,9:45
