Indicator Based Market Exposure (IBME)The Indicator Based Market Exposure (IBME) system was created by Big Wave Chartist as a way to navigate the markets using a confluence of three different signals to determine when the "internals" of the market are in your favor and how heavily invested to be at any point. The idea of the system is also to flash warning signs when the market internals are beginning to deteriorate so as to take a defensive stance. Of course this system can be strictly adhered to, or it can be incorporated into a more discretionary style of trading, and be combined with progressive exposure into (and out of) the market as positions gain (or lose) traction.
The IBME displays a straightforward action signal based on the combination of the 3 separate signals:
Green 🟢 Full size-longs permitted
Yellow 🟡 Pilot positions permitted
Red 🔴 No longs allowed
So let's get into the signals used:
McClellan Summation Index
Net New Highs/Lows
Net New Highs Crossover
McClellan Summation Index (MSI)
The McClellan Summation Index is a long-term version of the McClellan Oscillator, which is a market breadth indicator based on stock advances and declines. Interpretation is similar to that of the McClellan Oscillator, except that it is more suited to intermediate to major trends and related reversals. The McClellan Summation Index can be calculated as the sum of all the daily values of the McClellan Oscillator. This is used along with the 10-sma to watch for a crossover indicating an uptrend or downtrend beginning.
Net New Highs/Lows
This is the net number of stocks making 52-week highs or lows. For instance, if there are 60 new 52-week highs and 20 new 52-week lows, the net number will be 40 net new 52 week highs. This signal is particularly useful in gauging breadth.
Net New Highs Crossover
This is the description of NNHC from the original separate version of this indicator created by HikoStory: "Net New Highs can guide you to increase or decrease your exposure based on the current market health. They are calculated by subtracting the new highs from the new lows, based on all stocks of the...NASDAQ. A positive value shows that the market is doing good, since more stocks are making new highs compared to new lows. A negative value shows that the market is doing bad, since more stocks are making new lows compared to new highs. Combined with a moving average you can see crossovers that can warn you early when there is a change in the current market health."
The default index for the IBME is the Nasdaq.
The IBME is meant to be used on a daily time frame chart, therefore the signal will only show on a daily time frame chart.
Display options include:
Show/hide individual signals
Table background/font color
Table size/placement
在腳本中搜尋"泰国一寺庙被曝藏有40多具尸体"

All Candlestick Patterns Screener [By MUQWISHI]▋ INTRODUCTION :
The Candlestick Patterns Screener has been designed to offer an advanced monitoring solution for up to 40 symbols. Utilizing a log screener style, it efficiently gathers information on confirmed candlestick pattern occurrences and presents it in an organized table. This table includes essential details such as the symbol name, signal price, and the corresponding candlestick pattern name.
_______________________
▋ OVERVIEW:
_______________________
▋ CREDIT:
Credit to public technical “*All Candlestick Patterns*” indicator.
_______________________
▋ USAGE:
_______________________
▋ Final Comments:
For best performance, add the Candlestick Patterns Screener on active symbol chart like QQQ, SPY, AAPL, BTCUSDT, ES, EURUSD or …etc.
Candlestick patterns are not a major concept to build a trading decision.
Personally, I see candlestick patterns as a means to comprehend the psychology of the market, and help to follow the price action.
Please let me know if you have any questions.
Thank you.

RSI Momentum Trend ScreenerIntroducing The RSI Momentum Trend Screener, to have the ability to scan 40 symbols at once
The screener is based on RSI Momentum Trend Indicator
It will show Positive Or Negative based on the symbol condition.
You can change the values on the screener, symbols, activate/disable symbols and change table position and color

Fair Value Gap (FVG) UnderlayBy analyzing the size and characteristics of candlestick patterns, the Fair Value Gap indicator helps traders spot potential opportunities where the price of a currency or financial asset deviates from its fair value. The FVG is represented as a percentage and displayed as columns in an underlay on the chart.
Calculation and Interpretation:
The calculation of the FVG involves evaluating the body-to-wick ratio of a candlestick. This ratio compares the size of the body (the difference between the open and close prices) to the length of the wicks (the high and low prices). A high body-to-wick ratio indicates a significant price move within the candlestick, potentially signaling a strong market sentiment. The FVG indicator compares the size of the current candlestick with the previous candlesticks over a specified lookback period, typically the last 20 to 40 candlesticks. If the current candlestick meets the criteria for a fair value gap, it is classified as either a Bearish FVG or Bullish FVG, depending on the direction of the price movement.
Interpreting the FVG is relatively straightforward. When a Bearish FVG is detected, it suggests that the price is currently lower than its fair value, indicating a potential upward price movement in the future. This could be an opportunity to consider long positions or buying opportunities. On the other hand, when a Bullish FVG is identified, it implies that the price is higher than its fair value, signaling a possible downward price correction. Traders may consider short-selling or taking profits on long positions in such scenarios.
Coloration:
The coloration of the Fair Value Gap (FVG) indicator plays a crucial role in enhancing its visual representation and aiding interpretation. When a Bearish FVG is identified, the indicator utilizes the color scheme of lime green. This color signifies the potential for an upward price movement as the current price is considered lower than its fair value. On the other hand, a Bullish FVG is represented by the vibrant color of fuchsia, indicating a potential downward price correction as the price exceeds its fair value. The coloration serves as a visual cue, making it easier for traders to quickly identify and differentiate between different types of fair value gaps on the chart. Additionally, the barcolor is aligned with the respective FVG color, providing a comprehensive view of price inefficiencies and aiding traders in their decision-making process.
Potential Applications/Strategies:
The FVG indicator can be applied in various trading strategies and situations. One possible application is in price reversion strategies. Traders can use the FVG to identify overbought or oversold conditions in the market. When a Bullish FVG occurs, it may indicate an opportunity to consider short-selling or taking profits on long positions. Similarly, a Bearish FVG can suggest a potential buying opportunity, expecting the price to revert back to its fair value.
Another application is in confirming existing trends. The FVG can act as a confirmation tool for trends identified by other indicators or analysis techniques. When a Bullish FVG aligns with an uptrend, it may strengthen the bullish bias and provide more confidence in the upward momentum. Conversely, a Bearish FVG in conjunction with a downtrend may reinforce the bearish sentiment and support the idea of further downside potential.
Parameters:
Adjusting the parameters of the FVG indicator can be beneficial based on the trader's trading style and time frame. The body-to-wick ratio threshold and lookback period can be modified to capture different types of fair value gaps and adapt to different market conditions. Shorter lookback periods may help identify more recent FVGs, which could be suitable for short-term traders, while longer periods may capture larger price inefficiencies and cater to longer-term traders.
Limitations:
However, it's important to note that the FVG indicator, like any technical analysis tool, has its limitations. It relies on historical price patterns and may not always accurately predict future price movements. The interpretation of FVGs requires careful analysis and should be used in conjunction with other indicators, technical analysis tools, and fundamental factors to make well-informed trading decisions. Traders should also exercise proper risk management and consider the overall market context when using the FVG indicator.
In conclusion, the Fair Value Gap (FVG) indicator provides traders with valuable insights into price inefficiencies and deviations from fair value. By identifying Bearish and Bullish FVGs, traders can potentially uncover trading opportunities and make more informed decisions. However, it is crucial to combine the FVG indicator with other analysis tools, conduct thorough analysis, and exercise proper risk management to achieve consistent trading success.

ICT Silver Bullet [LuxAlgo]The ICT Silver Bullet indicator is inspired from the lectures of "The Inner Circle Trader" (ICT) and highlights the Silver Bullet (SB) window which is a specific 1-hour interval where a Fair Value Gap (FVG) pattern can be formed.
When a FVG is formed during the Silver Bullet window, Support & Resistance lines will be drawn at the end of the SB session.
There are 3 different Silver Bullet windows (New York local time):
The London Open Silver Bullet (3 AM — 4 AM ~ 03:00 — 04:00)
The AM Session Silver Bullet (10 AM — 11 AM ~ 10:00 — 11:00)
The PM Session Silver Bullet (2 PM — 3 PM ~ 14:00 — 15:00)
🔶 USAGE
The ICT Silver Bullet indicator aims to provide users a comprehensive display as similar as possible to how anyone would manually draw the concept on their charts.
It's important to use anything below the 15-minute timeframe to ensure proper setups can display. In this section, we are purely using the 3-minute timeframe.
In the image below, we can see a bullish setup whereas a FVG was successfully retested during the Silver Bullet session. This was then followed by a move upwards to liquidity as our target.
Alternatively, you can also see below a bearish setup utilizing the ICT Silver Bullet indicator outlined.
At this moment, the indicator has removed all other FVGs within the Silver Bullet session & has confirmed this FVG as the retested one.
There is also a support level marked below to be used as a liquidity target as per the ICT Silver Bullet concept suggests.
In the below chart we can see 4 separate consecutive examples of bullish & bearish setups on the 3-minute chart.
🔶 CONCEPTS
This technique can visualize potential support/resistance lines, which can be used as targets.
The script contains 2 main components:
• forming of a Fair Value Gap (FVG)
• drawing support/resistance (S/R) lines
🔹 Forming of FVG
1 basic principle: when a FVG at the end of the SB session is not retraced, it will be made invisible.
Dependable on the settings, different FVG's will be shown.
• 'All FVG': all FVG's are shown, regardless the trend
• 'Only FVG's in the same direction of trend': Only FVG's are shown that are similar to the trend at that moment (trend can be visualized by enabling ' Show ' -> ' Trend ')
-> only bearish FVG when the trend is bearish vs. bullish FVG when trend is bullish
• 'strict': Besides being similar to the trend, only FVG's are shown when the closing price at the end of the SB session is:
– below the top of the FVG box (bearish FVG)
– above bottom of the FVG box (bullish FVG)
• 'super-strict': Besides being similar to the trend, only FVG's are shown when the FVG box is NOT broken
in the opposite direction AND the closing price at the end of the SB session is:
– below bottom of the FVG box (bearish FVG)
– above the top of the FVG box (bullish FVG)
' Super-Strict ' mode resembles ICT lectures the most.
🔹 Drawing support/resistance lines
When the SB session has ended, the script draws potential support/resistance lines, again, dependable on the settings.
• Previous session (any): S/R lines are fetched between current and previous session.
For example, when current session is ' AM SB Session (10 AM — 11 AM) ', then previous session is
' London Open SB (3 AM — 4 AM) ', S/R lines between these 2 sessions alone will be included.
• Previous session (similar): S/R lines are fetched between current and previous - similar - session.
For example, when current session is ' London Open SB (3 AM — 4 AM)' , only S/R lines between
current session and previous ' London Open SB (3 AM — 4 AM) ' session are included.
When a new session starts, S/R lines will be removed, except when enabling ' Keep lines (only in strict mode) '
This is not possible in ' All FVG ' or ' Only FVG's in the same direction of trend ' mode, since the chart would be cluttered.
Note that in ' All FVG ' or ' Only FVG's in the same direction of trend ' mode, both, Support/Resistance lines will be shown,
while in Strict/Super-Strict mode:
• only Support lines will be shown if a bearish FVG appears
• only Resistance lines if a bullish FVG is shown
The lines will still be drawn the the end of the SB session, when a valid FVG appears,
but the S/R lines will remain visible and keep being updated until price reaches that line.
This publication contains a "Minimum Trade Framework (mTFW)", which represents the best-case expected price delivery, this is not your actual trade entry - exit range.
• 40 ticks for index futures or indices
• 15 pips for Forex pairs.
When on ' Strict/Super-Strict ' mode, only S/R lines will be shown which are:
• higher than the lowest FVG bottom + mTFW, in a bullish scenario
• lower than the highest FVG bottom - mTFW, in a bearish scenario
When on ' All FVG/Only FVG's in the same direction of trend ' mode, or on non-Forex/Futures/Indices symbols, S/R needs to be higher/lower than SB session high/low.
🔶 SETTINGS
(Check CONCEPTS for deeper insights and explanation)
🔹 Swing settings (left): Sets the length, which will set the lookback period/sensitivity of the Zigzag patterns (which directs the trend)
🔹 Silver Bullet Session; Show SB session: show lines and labels of SB session
Labels can be disabled separately in the ' Style ' section, color is set at the ' Inputs ' section.
🔹 FVG
– Mode
• All FVG
• Only FVG's in the same direction of trend
• Strict
• Super-Strict
– Colors
– Extend: extend till last bar of SB session
🔹 Targets – support/resistance lines
– Previous session (any): S/R lines fetched between current and previous SB session
– Previous session (similar): S/R lines fetched between current and previous similar SB session
– Colors
– Keep lines (only in strict mode)
🔹 Show
– MSS ~ Session: Show Market Structure Shift , only when this happens during a SB session
– Trend: Show trend (Zigzag, colored ~ trend)

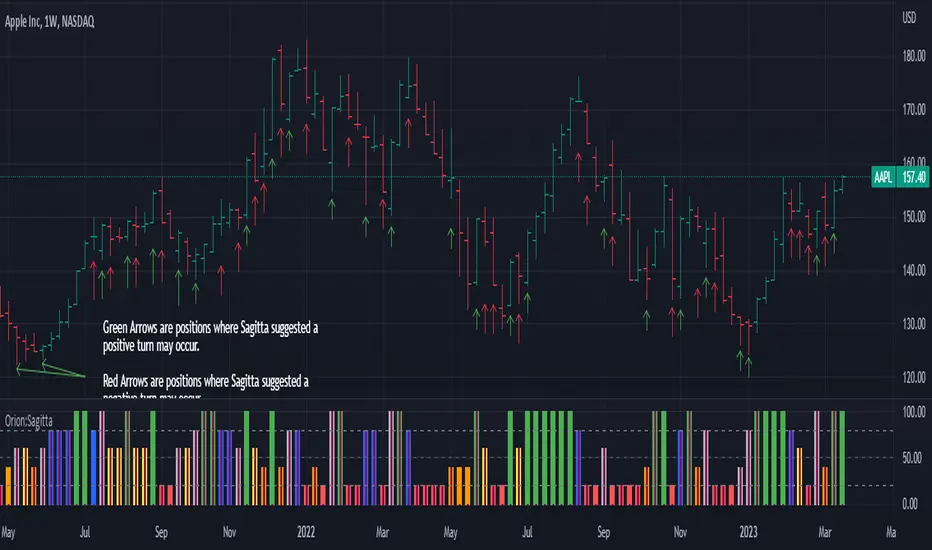
Price Exhaustion IndicatorThe Price Exhaustion Indicator (PE) is a powerful tool designed to identify trends weakening and strengthening in the financial markets. It combines the concepts of Average True Range (ATR), Moving Average Convergence Divergence (MACD), and Stochastic Oscillator to provide a comprehensive assessment of trend exhaustion levels. By analyzing these multiple indicators together, traders and investors can gain valuable insights into potential price reversals and long-term market highs and lows.
The aim of combining the ATR, MACD, and Stochastic Oscillator, is to provide a comprehensive analysis of trend exhaustion. The ATR component helps assess the volatility and range of price movements, while the MACD offers insights into the convergence and divergence of moving averages. The Stochastic Oscillator measures the current price in relation to its range, providing further confirmation of trend exhaustion. The exhaustion value is derived by combining the MACD, ATR, and Stochastic Oscillator. The MACD value is divided by the ATR value, and then multiplied by the Stochastic Oscillator value. This calculation results in a single exhaustion value that reflects the combined influence of these three indicators.
Application
The Price Exhaustion Indicator utilizes a unique visual representation by incorporating a gradient color scheme. The exhaustion line dynamically changes color, ranging from white when close to the midline (40) to shades of purple as it approaches points of exhaustion (overbought at 100 and oversold at -20). As the exhaustion line approaches the color purple, this represents extreme market conditions and zones of weakened trends where reversals may occur. This color gradient serves as a visual cue, allowing users to quickly gauge the strength or weakness of the prevailing trend.
To further enhance its usability, the Price Exhaustion Indicator also includes circle plots that signify potential points of trend reversion. These plots appear when the exhaustion lines cross or enter the overbought and oversold zones. Red circle plots indicate potential short entry points, suggesting a weakening trend and the possibility of a downward price reversal. Conversely, green circle plots represent potential long entry points, indicating a strengthening trend and the potential for an upward price reversal.
Traders and investors can leverage the Price Exhaustion Indicator in various ways. It can be utilized as a trend-following tool, or a mean reversion tool. When the exhaustion line approaches the overbought or oversold zones, it suggests a weakening trend and the possibility of a price reversal, helping identify potential market tops and bottoms. This can guide traders in timing their entries or exits in anticipation of a trend shift.
Utility
The Price Exhaustion Indicator is particularly useful for long-term market analysis, as it focuses on identifying long-term market highs and lows. By capturing the gradual weakening or strengthening of a trend, it assists investors in making informed decisions about portfolio allocation, trend continuation, or potential reversals.
In summary, the Price Exhaustion Indicator is a comprehensive and visually intuitive tool that combines ATR, MACD, and Stochastic Oscillator to identify trend exhaustion levels. By utilizing a gradient color scheme and circle plots, it offers traders and investors valuable insights into potential trend reversals and long-term market highs and lows. Its unique features make it a valuable addition to any trader's toolkit, providing a deeper understanding of market dynamics and assisting in decision-making processes. Please note that future performance of any trading strategy is fundamentally unknowable, and past results do not guarantee future performance.

Divergence Screener [Mr_Zed]Divergence Screener
This script allows you to scan multiple assets and timeframes for bullish and bearish divergences based on the RSI (Relative Strength Index) indicator.
Features
Supports up to 40 different assets and timeframes for simultaneous scanning.
Customizable settings for RSI period and source.
Adjustable lookback periods for identifying pivot highs and pivot lows.
Flexible range limits for filtering divergences based on the number of bars since the last pivot point.
Alerts for bullish and bearish divergences on confirmed bars.

QFL Screener [ ZCrypto ]The QFL Screener is a robust tool inspired by Quickfingersluc's trading strategy.
Known as the Base Strategy or Mean Reversals, QFL focuses on identifying moments of panic selling and buying , presenting opportunities to enter trades at deeply discounted prices.
The QFL Screener is designed to enhance your trading efficiency by simultaneously scanning 40 symbols.
You have the flexibility to enable or disable specific symbols from the screening process, allowing you to tailor the screener to your preferred markets and instruments.
The Screener has a built-in alerts system . As soon as the QFL conditions align for any of the scanned symbols, you'll receive instant notifications, empowering you to take prompt action and seize potential trading opportunities.
In addition, I've incorporated a visual element to complement the alerts. Once the conditions are true, a green arrow shape will appear directly on the chart, providing a clear and intuitive signal of the QFL opportunity.
To provide a clear overview, our screener presents a comprehensive table that highlights when the QFL condition becomes true for each symbol. This table acts as a visual guide, enabling you to monitor the status of multiple symbols at a glance, streamlining your trading decision-making process.
With the QFL Screener, you gain an edge in identifying profitable trade setups based on Quickfingersluc's renowned approach. Experience the convenience of simultaneous screening, real-time alerts, and an intuitive table display, all in one user-friendly tool.

120x ticker screener (composite tickers)In specific circumstances, it is possible to extract data, far above the 40 `request.*()` call limit for 1 single script .
The following technique uses composite tickers . Changing tickers needs to be done in the code itself as will be explained further.
⎯⎯⎯⎯⎯⎯⎯⎯⎯⎯⎯⎯⎯⎯⎯⎯⎯⎯⎯⎯⎯⎯⎯⎯⎯⎯⎯⎯⎯⎯⎯⎯⎯⎯⎯⎯⎯⎯⎯⎯⎯⎯⎯⎯⎯⎯⎯⎯⎯⎯⎯⎯⎯⎯⎯
🔶 PRINCIPLE
Standard example:
c1 = request.security('MTLUSDT' , 'D', close)
This will give the close value from 1 ticker (MTLUSDT); c1 for example is 1.153
Now let's add 2 tickers to MTLUSDT; XMRUSDT and ORNUSDT with, for example, values of 1.153 (I), 143.4 (II) and 0.8242 (III) respectively.
Just adding them up 'MTLUSDT+XMRUSDT+ORNUSDT' would give 145.3772 as a result, which is not something we can use...
Let's multiply ORNUSDT by 100 -> 14340
and multiply MTLUSDT by 1000000000 -> 1153000000 (from now, 10e8 will be used instead of 1000000000)
Then we make the sum.
When we put this in a security call (just the close value) we get:
c1 = request.security('MTLUSDT*10e8+XMRUSDT*100+ORNUSDT', 'D', close)
'MTLUSDT*10e8+XMRUSDT*100+ORNUSDT' -> 1153000000 + 14340 + 0.8242 = 1153014340.8242 (a)
This (a) will be split later on, for example:
1153014330.8242 / 10e8 = 1.1530143408242 -> round -> in this case to 1.153 (I), multiply again by 10e8 -> 1153000000.00 (b)
We subtract this from the initial number:
1153014340.8242 (a)
- 1153000000.0000 (b)
–––––––––––––––––
14340.8242 (c)
Then -> 14340.8242 / 100 = 143.408242 -> round -> 143.4 (II) -> multiply -> 14340.0000 (d)
-> subtract
14340.8242 (c)
- 14340.0000 (d)
––––––––––––
0.8242 (III)
Now we have split the number again into 3 tickers: 1.153 (I), 143.4 (II) and 0.8242 (III)
⎯⎯⎯⎯⎯⎯⎯⎯⎯⎯⎯⎯⎯⎯⎯⎯⎯⎯⎯⎯⎯⎯⎯⎯⎯⎯⎯⎯⎯⎯⎯⎯⎯⎯⎯⎯⎯⎯⎯⎯⎯⎯⎯⎯⎯⎯⎯⎯⎯⎯⎯⎯⎯⎯⎯
In this publication the function compose_3_() will make a composite ticker of 3 tickers, and the split_3_() function will split these 3 tickers again after passing 1 request.security() call.
In this example:
t46 = 'BINANCE:MTLUSDT', n46 = 10e8 , r46 = 3, t47 = 'BINANCE:XMRUSDT', n47 = 10e1, r47 = 1, t48 = 'BINANCE:ORNUSDT', r48 = 4 // T16
•••
T16= compose_3_(t48, t47, n47, t46, n46)
•••
= request.security(T16, res, )
•••
= split_3_(c16, n46, r46, n47, r47, r48)
🔶 CHANGING TICKERS
If you need to change tickers, you only have to change the first part of the script, USER DEFINED TICKERS
Back to our example, at line 26 in the code, you'll find:
t46 = 'BINANCE:MTLUSDT', n46 = 10e8 , r46 = 3, t47 = 'BINANCE:XMRUSDT', n47 = 10e1, r47 = 1, t48 = 'BINANCE:ORNUSDT', r48 = 4 // T16
( t46 , T16 ,... will be explained later)
You need to figure out how much you need to multiply each ticker, and the number for rounding, to get a good result.
In this case:
'BINANCE:MTLUSDT', multiply number = 10e8, round number is 3 (example value 1.153)
'BINANCE:XMRUSDT', multiply number = 10e1, round number is 1 (example value 143.4)
'BINANCE:ORNUSDT', NO multiply number, round number is 4 (example value 0.8242)
The value with most digits after the decimal point by preference is placed to the right side (ORNUSDT)
If you want to change these 3, how would you do so?
First pick your tickers and look for the round values, for example:
'MATICUSDT', example value = 0.5876 -> round -> 4
'LTCUSDT' , example value = 77.47 -> round -> 2
'ARBUSDT' , example value = 1.0231 -> round -> 4
Value with most digits after the decimal point -> MATIC or ARB, let's pick ARB to go on the right side, LTC at the left of ARB, and MATIC at the most left side.
-> 'MATICUSDT', LTCUSDT', ARBUSDT'
Then check with how much 'LTCUSDT' and 'MATICUSDT' needs to be multiplied to get this: 5876 0 7747 0 1.0231
'MATICUSDT' -> 10e10
'LTCUSDT' -> 10e3
Replace:
t46 = 'BINANCE:MTLUSDT', n46 = 10e8 , r46 = 3, t47 = 'BINANCE:XMRUSDT', n47 = 10e1, r47 = 1, t48 = 'BINANCE:ORNUSDT', r48 = 4 // T16
->
t46 = 'BINANCE:MATICUSDT', n46 = 10e10 , r46 = 4, t47 = 'BINANCE:LTCUSDT', n47 = 10e3, r47 = 2, t48 = 'BINANCE:ARBUSDT', r48 = 4 // T16
DO NOT change anything at t46, n46,... if you don't know what you're doing!
Only
• tickers ('BINANCE:MTLUSDT', 'BINANCE:XMRUSDT', 'BINANCE:ORNUSDT', ...),
• multiply numbers (10e8, 10e1, ...) and
• round numbers (3, 1, 4, ...)
should be changed.
There you go!
🔶 LIMITATIONS
🔹 The composite ticker fails when 1 of the 3 isn't in market in the weekend, while the other 2 are.
That is the reason all tickers are crypto. I think it is possible to combine stock,... tickers, but they have to share the same market hours.
🔹 The number cannot be as large as you want, the limit lays around 15-16 digits.
This means when you have for example 123, 45.67 and 0.000000000089, you'll get issues when composing to this:
-> 123045670.000000000089 (21 digits)
Make sure the numbers are close to each other as possible, with 1 zero (or 2) in between:
-> 1.230045670089 (13 digits by doing -> (123 * 10e-3) + (45.67 * 10e-7) + 0.000000000089)
🔹 This script contains examples of calculated values, % change, SMA, RMA and RSI.
These values need to be calculated from HTF close data at current TF (timeframe).
This gives challenges. For example the SMA / %change is not a problem (same values at 1h TF from Daily data).
RMA , RSI is not so easy though...
Daily values are rather similar on a 2-3h TF, but 1h TF and lower is quite different.
At the moment I haven't figured out why, if someone has an idea, don't hesitate to share.
The main goal of this publication is 'composite tickers ~ request.security()' though.
🔹 When a ticker value changes substantially (x10, x100), the multiply number needs to be adjusted accordingly.
🔶 SETTINGS
SHOW SETS
SET
• Length : length of SMA, RMA and RSI
• HTF : Higher TimeFrame (default Daily)
TABLE
• Size table : \ _ Self-explanatory
• Include exchange name : /
• Sort : If exchange names are shown, the exchanges will be sorted first
COLOURS
• CH%
• RSI
• SMA (RMA)
DEBUG
Remember t46 , T16 ,... ?
This can be used for debugging/checking
ALWAYS DISABLE " sort " when doing so.
Example:
Set string -> T1 (tickers FIL, CAKE, SOL)
(Numbers are slightly different due to time passing by between screen captures)
Placing your tickers at the side panel makes it easy to compare with the printed label below the table (right side, 332201415014.45 ),
together with the line T1 in the script:
t1 = 'BINANCE:FILUSDT' , n1 = 10e10, r1 = 4, t2 = 'BINANCE:CAKEUSDT' , n2 = 10e5 , r2 = 3, t3 = 'BINANCE:SOLUSDT' , r3 = 2 // T1
FIL : 3.322
CAKE: 1.415
SOL : 14.56
Now it is easy to check whether the tickers are placed close enough to each other, with 1-2 zero's in between.
If you want to check a specific ticker, use " Show Ticker" , see out initial example:
Set string -> T16
Show ticker -> 46 (in the code -> t46 = 'BINANCE:MTLUSDT')
(Set at 0 to disable " check string " and NONE to disable " Set string ")
-> Debug/check/set away! 😀
🔶 OTHER TECHNIQUES
• REGEX ( Regular expression ) and str.match() is used to delete the exchange name from the ticker, in other words, everything before ":" is deleted by following regex:
exch(t) => incl_exch ? t : str.match(t, "(?<=:) +")
• To sort, array.sort_indices() is used (line 675 in the code), just as in my first "sort" publication Sort array alphabetically - educational
aSort = arrT.copy()
sort_Indices = array.sort_indices(id= aSort, order= order.ascending)
• Numbers and text colour will adjust automatically when switching between light/dark mode by using chart.fg_color / chart.bg_color
🔹 DISCLAIMER
Please don't ask me for custom screeners, thank you.

Open Interest Chart [LuxAlgo]The Open Interest Chart displays Commitments of Traders %change of futures open interest , with a unique circular plotting technique, inspired from this publication Periodic Ellipses .
🔶 USAGE
Open interest represents the total number of contracts that have been entered by market participants but have not yet been offset or delivered. This can be a direct indicator of market activity/liquidity, with higher open interest indicating a more active market.
Increasing open interest is highlighted in green on the circular plot, indicating money coming into the market, while decreasing open interests highlighted in red indicates money coming out of the market.
You can set up to 6 different Futures Open interest tickers for a quick follow up:
🔶 DETAILS
Circles are drawn, using plot() , with the functions createOuterCircle() (for the largest circle) and createInnerCircle() (for inner circles).
Following snippet will reload the chart, so the circles will remain at the right side of the chart:
if ta.change(chart.left_visible_bar_time ) or
ta.change(chart.right_visible_bar_time)
n := bar_index
Here is a snippet which will draw a 39-bars wide circle that will keep updating its position to the right.
//@version=5
indicator("")
n = bar_index
barsTillEnd = last_bar_index - n
if ta.change(chart.left_visible_bar_time ) or
ta.change(chart.right_visible_bar_time)
n := bar_index
createOuterCircle(radius) =>
var int end = na
var int start = na
var basis = 0.
barsFromNearestEdgeCircle = 0.
barsTillEndFromCircleStart = radius
startCylce = barsTillEnd % barsTillEndFromCircleStart == 0 // start circle
bars = ta.barssince(startCylce)
barsFromNearestEdgeCircle := barsTillEndFromCircleStart -1
basis := math.min(startCylce ? -1 : basis + 1 / barsFromNearestEdgeCircle * 2, 1) // 0 -> 1
shape = math.sqrt(1 - basis * basis)
rad = radius / 2
isOK = barsTillEnd <= barsTillEndFromCircleStart and barsTillEnd > 0
hi = isOK ? (rad + shape * radius) - rad : na
lo = isOK ? (rad - shape * radius) - rad : na
start := barsTillEnd == barsTillEndFromCircleStart ? n -1 : start
end := barsTillEnd == 0 ? start + radius : end
= createOuterCircle(40)
plot(h), plot(l)
🔶 LIMITATIONS
Due to the inability to draw between bars, from time to time, drawings can be slightly off.
Bar-replay can be demanding, since it has to reload on every bar progression. We don't recommend using this script on bar-replay. If you do, please choose the lowest speed and from time to time pause bar-replay for a second. You'll see the script gets reloaded.
🔶 SETTINGS
🔹 TICKERS
Toggle :
• Enabled -> uses the first column with a pre-filled list of Futures Open Interest tickers/symbols
• Disabled -> uses the empty field where you can enter your own ticker/symbol
Pre-filled list : the first column is filled with a list, so you can choose your open interest easily, otherwise you would see COT:088691_F_OI aka Gold Futures Open Interest for example.
If applicable, you will see 3 different COT data:
• COT: Legacy Commitments of Traders report data
• COT2: Disaggregated Commitments of Traders report data
• COT3: Traders in Financial Futures report data
Empty field : When needed, you can pick another ticker/symbol in the empty field at the right and disable the toggle.
Timeframe : Commitments of Traders (COT) data is tallied by the Commodity Futures Trading Commission (CFTC) and is published weekly. Therefore data won't change every day.
Default set TF is Daily
🔹 STYLE
From middle:
• Enabled (default): Drawings start from the middle circle -> towards outer circle is + %change , towards middle of the circle is - %change
• Disabled: Drawings start from the middle POINT of the circle, towards outer circle is + OR -
-> in both options, + %change will be coloured green , - %change will be coloured red .
-> 0 %change will be coloured blue , and when no data is available, this will be coloured gray .
Size circle : options tiny, small, normal, large, huge.
Angle : Only applicable if "From middle" is disabled!
-> sets the angle of the spike:
Show Ticker : Name of ticker, as seen in table, will be added to labels.
Text - fill
• Sets colour for +/- %change
Table
• Sets 2 text colours, size and position
Circles
• Sets the colour of circles, style can be changed in the Style section.
You can make it as crazy as you want:

Consensio Allocation ToolOriginally created and taught by Taylor Jenks, this indicator provides portfolio allocation suggestions based on the behaviour of price and 3 simple moving averages (4/10/40 by default)
(ie. when short & medium term SMAs are above the long term then allocation is to be 100%).
This percentage allocated to the stock/commodity is to be reduced as it passes below the SMA's, particularly as each moving average crosses.
Consensio is useful for scaling in and out of a position as the portfolio allocation will change according to the momentum of the asset.
The rules below are my own based on understanding of the trading system developed by Jenks and his online content.
This script has the following rules:
if fastAboveSlowMA and not mediumAboveSlowMA
allocation := 30.0
else if longAboveFastMA
allocation := 0.0
else if fastAboveMediumMA and fastAboveSlowMA
allocation := 100.0
else if not fastAboveMediumMA and fastAboveSlowMA
allocation := 80.0
else if not fastAboveMediumMA and not fastAboveSlowMA
allocation := 50.0
else if not mediumAboveSlowMA and fastAboveSlowMA
allocation := 50.0
// Calculate adjusted allocation percentage based on crossing moving averages
allocation := allocation + (priceAboveFastMA ? 10.0 : -10.0)
allocation := allocation + (priceAboveMediumMA ? 10.0 : -10.0)

TASC 2023.06 Stochastic Distance Oscillator█ OVERVIEW
This script implements the stochastic distance oscillator (SDO) , a momentum indicator introduced by Vitali Apirine in an article featured in TASC's June 2023 edition of Traders' Tips . The SDO is a variation of the classic stochastic oscillator and is designed to identify overbought and oversold levels, as well as detect bull and bear trend changes.
█ CONCEPTS
Unlike the classic stochastic oscillator, which compares an asset's price to its past price range, the SDO measures the size of the current distance relative to the maximum-minimum distance range over a set number of periods. The current distance is defined as the distance between the current price and the price n periods ago.
The readings of the SDO can be used to identify the following states of the asset price:
Uptrend state: the oscillator crosses over 50 from a non-uptrend state.
Downtrend state: the oscillator crosses under -50 from a non-downtrend state.
Overbought state: the oscillator is in an uptrend and crosses -50 for the first time.
Oversold state: the oscillator is in a downtrend and crosses 50 for the first time.
Trend continuity: the oscillator crosses 0 in the direction of the current trend.
The script indicates these five conditions using on-chart signals and background coloring.
█ CALCULATIONS
The SDO is calculated as follows:
1. Calculate the distance between the current price and the price n periods ago, as well as the maximum and minimum distances for the selected lookback period. The author recommends using one of two values of n , 14 or 40 bars.
2. Calculate the time series % D that represents the relation between the asset's current distance and its distance range over a loockback period:
% D = (Abs(current distance) − Abs(minimum distance)) / (Abs(maximum distance) − Abs(minimum distance)) * 100
3. Use the calculated % D to obtain the SDO:
If the closing price is above the close n periods ago, SDO = % D
If the closing price is below the close n periods ago, SDO = −% D
If the closing price equals the close n periods ago or the current distance equals the minimum distance, SDO = 0
4. Smooth the SDO using an exponential moving average (EMA). The author recommends using an EMA in the range from 3 to 6 .
Adjustable input parameters include the number of periods n , the lookback period for calculating % D , the smoothing EMA length, and the overbought/oversold threshold level.

ICT Macros [LuxAlgo]The ICT Macros indicator aims to highlight & classify ICT Macros, which are time intervals where algorithmic trading takes place to interact with existing liquidity or to create new liquidity.
🔶 SETTINGS
🔹 Macros
Macro Time options (such as '09:50 AM 10:10'): Enable specific macro display.
Top Line , Mid Line , Bottom Line and Extending Lines options: Controls the lines for the specific macro.
🔹 Macro Classification
Length : A length to detect Market Structure Brakes and classify macro type based on detection.
Swing Area : Swing or Liquidity Area selection, highest/lowest of the wick or the candle bodies.
Accumulation , Manipulation and Expansion color options for the classified macros.
🔹 Others
Macro Texts : Controls both the size and the visibility of the macro text.
Alert Macro Times in Advance (Minutes) : This option will plot a vertical line presenting the start of the next macro time. The line will not appear all the time, but it will be there based on remaining minutes specified in the option.
Daylight Saving Time (DST) : Adjust time appropriate to Daylight Saving Time of the specific region.
🔶 USAGE
A macro is a way to automate a task or procedure which you perform on a regular basis.
In the context of ICT's teachings, a macro is a small program or set of instructions that unfolds within an algorithm, which influences price movements in the market. These macros operate at specific times and can be related to price runs from one level to another or certain market behaviors during specific time intervals. They help traders anticipate market movements and potential setups during specific time intervals.
To trade these effectively, it is important to understand the time of day when certain macros come into play, and it is strongly advised to introduce the concept of liquidity in your analysis.
Macros can be classified into three categories where the Macro classification is calculated based on the Market Structure prior to macro and the Market Structure during the macro duration:
Manipulation Macro
Manipulation macros are characterized by liquidity being swept both on the buyside and sellside.
Expansion Macro
Expansion macros are characterized by liquidity being swept only on the buyside or sellside. Prices within these macros are highly correlated with the overall trend.
Accumulation Macro
Accumulation macros are characterized by an accumulation of liquidity. Prices within these macros tend to range.
The script returns the maximum/minimum price values reached during the macro interval alongside the average between the maximum/minimum and extends them until a new macro starts. These levels can act as supports and resistances.
🔶 DETAILS
All required data for the macro detection and classification is retrieved using 1 minute data sets, this includes candles as well as pivot/swing highs and lows. This approach guarantees the visually presented objects are same (same highs/lows) on higher timeframes as well as the macro classification remain same as it is in 1 min charts.
8 Macros can be displayed by the script (4 are enabled by default):
02:33 AM 03:00 London Macro
04:03 AM 04:30 London Macro
08:50 AM 09:10 New York Macro
09:50 AM 10:10 New York Macro
10:50 AM 11:10 New York Macro
11:50 AM 12:10 New York Launch Macro
13:10 PM 13:40 New York Macro
15:15 PM 15:45 New York Macro
🔶 ALERTS
When an alert is configured, the user will have the ability to be notified in advance of the next Macro time, where the value specified in 'Alert Macro Times in Advance (Minutes)' option indicates how early to be notified.
🔶 LIMITATIONS
The script is supported on 1 min, 3 mins and 5 mins charts.
🔶 RELATED SCRIPTS

Open Interest All ExchangesThe indicator collects data from available exchanges based on open interest. The indicators are calculated in the amount of Bitcoin.
Below are the tickers of the exchanges that provide the data:
- BITFINEX:BTCUSD
- BITFINEX:BTCUST
- KRAKEN:BTCUSDPERP
- BITMEX:XBTUSD
- BITMEX:XBTUSDT
- BINANCE:BTCUSDTPERP
- BINANCE:BTCUSDPERP (due to low volumes and limitations of 40 requests of the request.security function, the code contains data without using the calculation)
For me, Open Interest indicators play an important role in the trading system, for this reason I share with you. I am not a financial advisor.
**Open for cooperation**
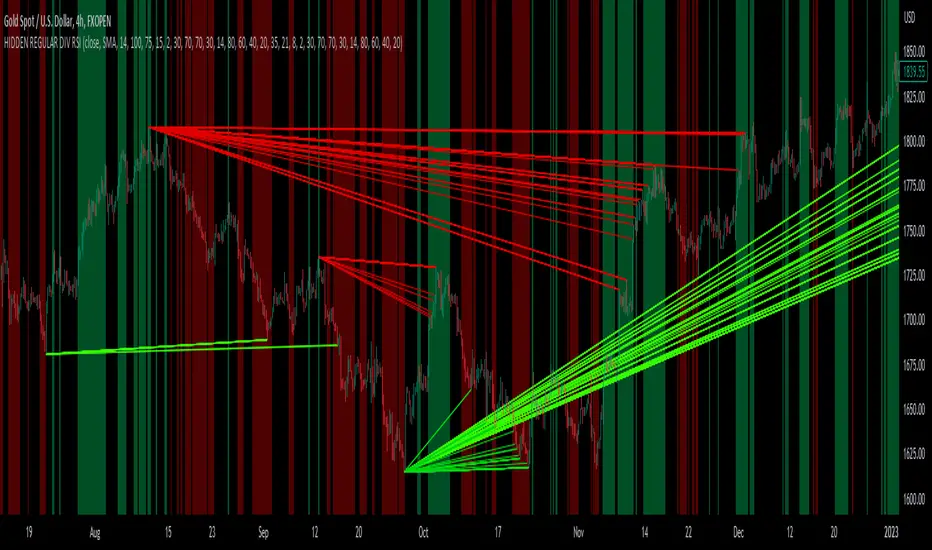
hidden & regular rsi divergenceThis is a divergence indicator that draws regular and hidden divergences based on the Zigzag indicator and RSI indicator. There are two degrees of Zigzag. So, in each Zigzag degree, there are two types of regular divergences and one type of hidden divergence.
👉(The logic is written in case of a bearish regular divergence. The opposite will apply for a bullish one.)
Type 1 of regular divergence (Logic 1):
Zigzag has to form a higher high. The highest RSI within both Zigzag legs must form lower highs, but the RSI values which are exactly at the Zigzag highs should not form lower highs.
Type 2 of regular divergence (Logic 2):
Zigzag has to form a higher high. The highest RSI within both Zigzag legs must form lower highs, and the RSI values which are exactly at the Zigzag highs should form lower highs.
👉(The logic is written in case of a bearish hidden divergence. The opposite will apply for a bullish one.)
Zigzag has to form a lower high. The highest RSI within both Zigzag legs must form higher highs.
👉There is also a filter that will be applied to all the divergences. It only shows the divergences whose corresponding RSI value was above/below a level (overbought level/oversold level).
Logic for regular divergences:
Bearish regular divergence's first high's (leftmost) RSI value should be greater than or equal to 70.
Bullish regular divergence's first low's (leftmost) RSI value should be less than or equal to 30.
Logic for hidden divergences:
Bearish hidden divergence's second high's (rightmost) RSI value should be greater than or equal to 70.
Bullish hidden divergence's second low's (rightmost) RSI value should be less than or equal to 30.
👉There is another feature also. This indicator colors the background based on whether the RSI is in a bullish or bearish range.
If it's within 80-60, the background will be colored green (this means that RSI is in a bullish range).
If it's within 40-20, the background will be colored red (this means that RSI is in a bearish range).
RSI TrueLevel StrategyThis strategy is a momentum-based strategy that uses the Relative Strength Index (RSI) indicator and a TrueLevel envelope to generate trade signals.
The strategy uses user-defined input parameters to calculate TrueLevel envelopes for 14 different lengths. The TrueLevel envelope is a volatility-based technical indicator that consists of upper and lower bands. The upper band is calculated by adding a multiple of the standard deviation to a linear regression line of the price data, while the lower band is calculated by subtracting a multiple of the standard deviation from the same regression line.
The strategy generates long signals when the RSI crosses above the oversold level or when the price crosses above the selected lower band of the TrueLevel envelope. It generates short signals when the RSI crosses below the overbought level or when the price crosses below the selected upper band of the TrueLevel envelope.
The strategy allows for long and short trades and sets the trade size as a percentage of the account equity. The colors of the bands and fills are also customizable through user-defined input parameters.
In this strategy, the 12th TrueLevel band was chosen due to its ability to capture significant price movements while still providing a reasonable level of noise reduction. The strategy utilizes a total of 14 TrueLevel bands, each with varying lengths. The 12th band, with a length of 2646, strikes a balance between sensitivity to market changes and reducing false signals, making it a suitable choice for this strategy.
RSI Parameters:
In this strategy, the RSI overbought and oversold levels are set at 65 and 40, respectively. These values were chosen to filter out more noise in the market and focus on stronger trends. Traditional RSI overbought and oversold levels are set at 70 and 30, respectively. By raising the oversold level and lowering the overbought level, the strategy aims to identify more significant trend reversals and potential trade opportunities.
Of course, the parameters can be adjusted to suit individual preferences.

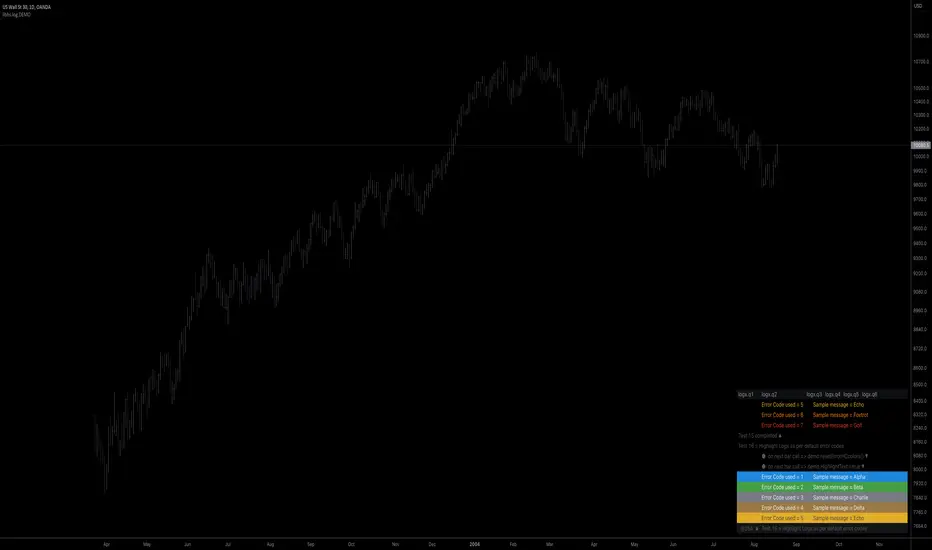
libhs.log.DEMO◼ Overview
This is a demonstration of dual logging library I have ported from my personal use for public use. Please start bar replay from Bar#4, and progress automatically slowly or manually.You would need to go through 450+ bars to see the full capability.
Logger=A dual logging library for developers. Tradingview lacks logging capability. This library provided logging while developing your scripts and is to be used by developers when developing and debugging their scripts.
Using this library would potentially slow down you scripts. Hence, use this for debugging only. Once your code is as you would like it to be, remove the logging code.
◼︎ Usage (Console):
Console = A sleek single cell logging with a limit of 4096 characters. When you dont need a large logging capability.
//@version=5
indicator("demo.Console", overlay=true)
plot(na)
import GETpacman/log/2 as logger
var console = logger.log.new()
console.init() // init() should be called as first line after variable declaration
console.FrameColor:=color.green
console.log('\n')
console.log('\n')
console.log('Hello World')
console.log('\n')
console.log('\n')
console.ShowStatusBar:=true
console.StatusBarAtBottom:=true
console.FrameColor:=color.blue //settings can be changed anytime before show method is called. Even twice. The last call will set the final value
console.ShowHeader:=false //this wont throw error but is not used for console
console.show(position=position.bottom_right) //this should be the last line of your code, after all methods and settings have been dealt with.
◼︎ Usage (Logx):
Logx = Multiple columns logging with a limit of 4096 characters each message. When you need to log large number of messages.
//@version=5
indicator("demo.Logx", overlay=true)
plot(na)
import GETpacman/log/2 as logger
var logx = logger.log.new()
logx.init() // init() should be called as first line after variable declaration
logx.FrameColor:=color.green
logx.log('\n')
logx.log('\n')
logx.log('Hello World')
logx.log('\n')
logx.log('\n')
logx.ShowStatusBar:=true
logx.StatusBarAtBottom:=true
logx.ShowQ3:=false
logx.ShowQ4:=false
logx.ShowQ5:=false
logx.ShowQ6:=false
logx.FrameColor:=color.olive //settings can be changed anytime before show method is called. Even twice. The last call will set the final value
logx.show(position=position.top_right) //this should be the last line of your code, after all methods and settings have been dealt with.
◼︎ Fields (with default settings)
▶︎ IsConsole = True Log will act as Console if true, otherwise it will act as Logx
▶︎ ShowHeader = True (Log only) Will show a header at top or bottom of logx.
▶︎ HeaderAtTop = True (Log only) Will show the header at the top, or bottom if false, if ShowHeader is true.
▶︎ ShowStatusBar = True Will show a status bar at the bottom
▶︎ StatusBarAtBottom = True Will show the status bar at the bottom, or top if false, if ShowHeader is true.
▶︎ ShowMetaStatus = True Will show the meta info within status bar (Current Bar, characters left in console, Paging On Every Bar, Console dumped data etc)
▶︎ ShowBarIndex = True Logx will show column for Bar Index when the message was logged. Console will add Bar index at the front of logged messages
▶︎ ShowDateTime = True Logx will show column for Date/Time passed with the logged message logged. Console will add Date/Time at the front of logged messages
▶︎ ShowLogLevels = True Logx will show column for Log levels corresponding to error codes. Console will log levels in the status bar
▶︎ ReplaceWithErrorCodes = True (Log only) Logx will show error codes instead of log levels, if ShowLogLevels is switched on
▶︎ RestrictLevelsToKey7 = True Log levels will be restricted to Ley 7 codes - TRACE, DEBUG, INFO, WARNING, ERROR, CRITICAL, FATAL
▶︎ ShowQ1 = True (Log only) Show the column for Q1
▶︎ ShowQ2 = True (Log only) Show the column for Q2
▶︎ ShowQ3 = True (Log only) Show the column for Q3
▶︎ ShowQ4 = True (Log only) Show the column for Q4
▶︎ ShowQ5 = True (Log only) Show the column for Q5
▶︎ ShowQ6 = True (Log only) Show the column for Q6
▶︎ ColorText = True Log/Console will color text as per error codes
▶︎ HighlightText = True Log/Console will highlight text (like denoting) as per error codes
▶︎ AutoMerge = True (Log only) Merge the queues towards the right if there is no data in those queues.
▶︎ PageOnEveryBar = True Clear data from previous bars on each new bar, in conjuction with PageHistory setting.
▶︎ MoveLogUp = True Move log in up direction. Setting to false will push logs down.
▶︎ MarkNewBar = True On each change of bar, add a marker to show the bar has changed
▶︎ PrefixLogLevel = True (Console only) Prefix all messages with the log level corresponding to error code.
▶︎ MinWidth = 40 Set the minimum width needed to be seen. Prevents logx/console shrinking below these number of characters.
▶︎ TabSizeQ1 = 0 If set to more than one, the messages on Q1 or Console messages will indent by this size based on error code (Max 4 used)
▶︎ TabSizeQ2 = 0 If set to more than one, the messages on Q2 will indent by this size based on error code (Max 4 used)
▶︎ TabSizeQ3 = 0 If set to more than one, the messages on Q2 will indent by this size based on error code (Max 4 used)
▶︎ TabSizeQ4 = 0 If set to more than one, the messages on Q2 will indent by this size based on error code (Max 4 used)
▶︎ TabSizeQ5 = 0 If set to more than one, the messages on Q2 will indent by this size based on error code (Max 4 used)
▶︎ TabSizeQ6 = 0 If set to more than one, the messages on Q2 will indent by this size based on error code (Max 4 used)
▶︎ PageHistory = 0 Used with PageOnEveryBar. Determines how many historial pages to keep.
▶︎ HeaderQbarIndex = 'Bar#' (Logx only) The header to show for Bar Index
▶︎ HeaderQdateTime = 'Date' (Logx only) The header to show for Date/Time
▶︎ HeaderQerrorCode = 'eCode' (Logx only) The header to show for Error Codes
▶︎ HeaderQlogLevel = 'State' (Logx only) The header to show for Log Level
▶︎ HeaderQ1 = 'h.Q1' (Logx only) The header to show for Q1
▶︎ HeaderQ2 = 'h.Q2' (Logx only) The header to show for Q2
▶︎ HeaderQ3 = 'h.Q3' (Logx only) The header to show for Q3
▶︎ HeaderQ4 = 'h.Q4' (Logx only) The header to show for Q4
▶︎ HeaderQ5 = 'h.Q5' (Logx only) The header to show for Q5
▶︎ HeaderQ6 = 'h.Q6' (Logx only) The header to show for Q6
▶︎ Status = '' Set the status to this text.
▶︎ HeaderColor Set the color for the header
▶︎ HeaderColorBG Set the background color for the header
▶︎ StatusColor Set the color for the status bar
▶︎ StatusColorBG Set the background color for the status bar
▶︎ TextColor Set the color for the text used without error code or code 0.
▶︎ TextColorBG Set the background color for the text used without error code or code 0.
▶︎ FrameColor Set the color for the frame around Logx/Console
▶︎ FrameSize = 1 Set the size of the frame around Logx/Console
▶︎ CellBorderSize = 0 Set the size of the border around cells.
▶︎ CellBorderColor Set the color for the border around cells within Logx/Console
▶︎ SeparatorColor = gray Set the color of separate in between Console/Logx Attachment
◼︎ Methods (summary)
● init ▶︎ Initialise the log
● log ▶︎ Log the messages. Use method show to display the messages
● page ▶︎ Clear messages from previous bar while logging messages on this bar.
● show ▶︎ Shows a table displaying the logged messages
● clear ▶︎ Clears the log of all messages
● resize ▶︎ Resizes the log. If size is for reduction then oldest messages are lost first.
● turnPage ▶︎ When called, all messages marked with previous page, or from start are cleared
● dateTimeFormat ▶︎ Sets the date time format to be used when displaying date/time info.
● resetTextColor ▶︎ Reset Text Color to library default
● resetTextBGcolor ▶︎ Reset Text BG Color to library default
● resetHeaderColor ▶︎ Reset Header Color to library default
● resetHeaderBGcolor ▶︎ Reset Header BG Color to library default
● resetStatusColor ▶︎ Reset Status Color to library default
● resetStatusBGcolor ▶︎ Reset Status BG Color to library default
● setColors ▶︎ Sets the colors to be used for corresponding error codes
● setColorsBG ▶︎ Sets the background colors to be used for corresponding error codes. If not match of error code, then text color used.
● setColorsHC ▶︎ Sets the highlight colors to be used for corresponding error codes.If not match of error code, then text bg color used.
● resetColors ▶︎ Reset the colors to library default (Total 36, not including error code 0)
● resetColorsBG ▶︎ Reset the background colors to library default
● resetColorsHC ▶︎ Reset the highlight colors to library default
● setLevelNames ▶︎ Set the log level names to be used for corresponding error codes. If not match of error code, then empty string used.
● resetLevelNames ▶︎ Reset the log level names to library default. (Total 36) 1=TRACE, 2=DEBUG, 3=INFO, 4=WARNING, 5=ERROR, 6=CRITICAL, 7=FATAL
● attach ▶︎ Attaches a console to an existing Logx, allowing to have dual logging system independent of each other
● detach ▶︎ Detaches an already attached console from Logx
loggerLibrary "logger"
◼ Overview
A dual logging library for developers. Tradingview lacks logging capability. This library provides logging while developing your scripts and is to be used by developers when developing and debugging their scripts.
Using this library would potentially slow down you scripts. Hence, use this for debugging only. Once your code is as you would like it to be, remove the logging code.
◼︎ Usage (Console):
Console = A sleek single cell logging with a limit of 4096 characters. When you dont need a large logging capability.
//@version=5
indicator("demo.Console", overlay=true)
plot(na)
import GETpacman/logger/1 as logger
var console = logger.log.new()
console.init() // init() should be called as first line after variable declaration
console.FrameColor:=color.green
console.log('\n')
console.log('\n')
console.log('Hello World')
console.log('\n')
console.log('\n')
console.ShowStatusBar:=true
console.StatusBarAtBottom:=true
console.FrameColor:=color.blue //settings can be changed anytime before show method is called. Even twice. The last call will set the final value
console.ShowHeader:=false //this wont throw error but is not used for console
console.show(position=position.bottom_right) //this should be the last line of your code, after all methods and settings have been dealt with.
◼︎ Usage (Logx):
Logx = Multiple columns logging with a limit of 4096 characters each message. When you need to log large number of messages.
//@version=5
indicator("demo.Logx", overlay=true)
plot(na)
import GETpacman/logger/1 as logger
var logx = logger.log.new()
logx.init() // init() should be called as first line after variable declaration
logx.FrameColor:=color.green
logx.log('\n')
logx.log('\n')
logx.log('Hello World')
logx.log('\n')
logx.log('\n')
logx.ShowStatusBar:=true
logx.StatusBarAtBottom:=true
logx.ShowQ3:=false
logx.ShowQ4:=false
logx.ShowQ5:=false
logx.ShowQ6:=false
logx.FrameColor:=color.olive //settings can be changed anytime before show method is called. Even twice. The last call will set the final value
logx.show(position=position.top_right) //this should be the last line of your code, after all methods and settings have been dealt with.
◼︎ Fields (with default settings)
▶︎ IsConsole = True Log will act as Console if true, otherwise it will act as Logx
▶︎ ShowHeader = True (Log only) Will show a header at top or bottom of logx.
▶︎ HeaderAtTop = True (Log only) Will show the header at the top, or bottom if false, if ShowHeader is true.
▶︎ ShowStatusBar = True Will show a status bar at the bottom
▶︎ StatusBarAtBottom = True Will show the status bar at the bottom, or top if false, if ShowHeader is true.
▶︎ ShowMetaStatus = True Will show the meta info within status bar (Current Bar, characters left in console, Paging On Every Bar, Console dumped data etc)
▶︎ ShowBarIndex = True Logx will show column for Bar Index when the message was logged. Console will add Bar index at the front of logged messages
▶︎ ShowDateTime = True Logx will show column for Date/Time passed with the logged message logged. Console will add Date/Time at the front of logged messages
▶︎ ShowLogLevels = True Logx will show column for Log levels corresponding to error codes. Console will log levels in the status bar
▶︎ ReplaceWithErrorCodes = True (Log only) Logx will show error codes instead of log levels, if ShowLogLevels is switched on
▶︎ RestrictLevelsToKey7 = True Log levels will be restricted to Ley 7 codes - TRACE, DEBUG, INFO, WARNING, ERROR, CRITICAL, FATAL
▶︎ ShowQ1 = True (Log only) Show the column for Q1
▶︎ ShowQ2 = True (Log only) Show the column for Q2
▶︎ ShowQ3 = True (Log only) Show the column for Q3
▶︎ ShowQ4 = True (Log only) Show the column for Q4
▶︎ ShowQ5 = True (Log only) Show the column for Q5
▶︎ ShowQ6 = True (Log only) Show the column for Q6
▶︎ ColorText = True Log/Console will color text as per error codes
▶︎ HighlightText = True Log/Console will highlight text (like denoting) as per error codes
▶︎ AutoMerge = True (Log only) Merge the queues towards the right if there is no data in those queues.
▶︎ PageOnEveryBar = True Clear data from previous bars on each new bar, in conjuction with PageHistory setting.
▶︎ MoveLogUp = True Move log in up direction. Setting to false will push logs down.
▶︎ MarkNewBar = True On each change of bar, add a marker to show the bar has changed
▶︎ PrefixLogLevel = True (Console only) Prefix all messages with the log level corresponding to error code.
▶︎ MinWidth = 40 Set the minimum width needed to be seen. Prevents logx/console shrinking below these number of characters.
▶︎ TabSizeQ1 = 0 If set to more than one, the messages on Q1 or Console messages will indent by this size based on error code (Max 4 used)
▶︎ TabSizeQ2 = 0 If set to more than one, the messages on Q2 will indent by this size based on error code (Max 4 used)
▶︎ TabSizeQ3 = 0 If set to more than one, the messages on Q2 will indent by this size based on error code (Max 4 used)
▶︎ TabSizeQ4 = 0 If set to more than one, the messages on Q2 will indent by this size based on error code (Max 4 used)
▶︎ TabSizeQ5 = 0 If set to more than one, the messages on Q2 will indent by this size based on error code (Max 4 used)
▶︎ TabSizeQ6 = 0 If set to more than one, the messages on Q2 will indent by this size based on error code (Max 4 used)
▶︎ PageHistory = 0 Used with PageOnEveryBar. Determines how many historial pages to keep.
▶︎ HeaderQbarIndex = 'Bar#' (Logx only) The header to show for Bar Index
▶︎ HeaderQdateTime = 'Date' (Logx only) The header to show for Date/Time
▶︎ HeaderQerrorCode = 'eCode' (Logx only) The header to show for Error Codes
▶︎ HeaderQlogLevel = 'State' (Logx only) The header to show for Log Level
▶︎ HeaderQ1 = 'h.Q1' (Logx only) The header to show for Q1
▶︎ HeaderQ2 = 'h.Q2' (Logx only) The header to show for Q2
▶︎ HeaderQ3 = 'h.Q3' (Logx only) The header to show for Q3
▶︎ HeaderQ4 = 'h.Q4' (Logx only) The header to show for Q4
▶︎ HeaderQ5 = 'h.Q5' (Logx only) The header to show for Q5
▶︎ HeaderQ6 = 'h.Q6' (Logx only) The header to show for Q6
▶︎ Status = '' Set the status to this text.
▶︎ HeaderColor Set the color for the header
▶︎ HeaderColorBG Set the background color for the header
▶︎ StatusColor Set the color for the status bar
▶︎ StatusColorBG Set the background color for the status bar
▶︎ TextColor Set the color for the text used without error code or code 0.
▶︎ TextColorBG Set the background color for the text used without error code or code 0.
▶︎ FrameColor Set the color for the frame around Logx/Console
▶︎ FrameSize = 1 Set the size of the frame around Logx/Console
▶︎ CellBorderSize = 0 Set the size of the border around cells.
▶︎ CellBorderColor Set the color for the border around cells within Logx/Console
▶︎ SeparatorColor = gray Set the color of separate in between Console/Logx Attachment
◼︎ Methods (summary)
● init ▶︎ Initialise the log
● log ▶︎ Log the messages. Use method show to display the messages
● page ▶︎ Clear messages from previous bar while logging messages on this bar.
● show ▶︎ Shows a table displaying the logged messages
● clear ▶︎ Clears the log of all messages
● resize ▶︎ Resizes the log. If size is for reduction then oldest messages are lost first.
● turnPage ▶︎ When called, all messages marked with previous page, or from start are cleared
● dateTimeFormat ▶︎ Sets the date time format to be used when displaying date/time info.
● resetTextColor ▶︎ Reset Text Color to library default
● resetTextBGcolor ▶︎ Reset Text BG Color to library default
● resetHeaderColor ▶︎ Reset Header Color to library default
● resetHeaderBGcolor ▶︎ Reset Header BG Color to library default
● resetStatusColor ▶︎ Reset Status Color to library default
● resetStatusBGcolor ▶︎ Reset Status BG Color to library default
● setColors ▶︎ Sets the colors to be used for corresponding error codes
● setColorsBG ▶︎ Sets the background colors to be used for corresponding error codes. If not match of error code, then text color used.
● setColorsHC ▶︎ Sets the highlight colors to be used for corresponding error codes.If not match of error code, then text bg color used.
● resetColors ▶︎ Reset the colors to library default (Total 36, not including error code 0)
● resetColorsBG ▶︎ Reset the background colors to library default
● resetColorsHC ▶︎ Reset the highlight colors to library default
● setLevelNames ▶︎ Set the log level names to be used for corresponding error codes. If not match of error code, then empty string used.
● resetLevelNames ▶︎ Reset the log level names to library default. (Total 36) 1=TRACE, 2=DEBUG, 3=INFO, 4=WARNING, 5=ERROR, 6=CRITICAL, 7=FATAL
● attach ▶︎ Attaches a console to an existing Logx, allowing to have dual logging system independent of each other
● detach ▶︎ Detaches an already attached console from Logx
method clear(this)
Clears all the queue, including bar_index and time queues, of existing messages
Namespace types: log
Parameters:
this (log)
method resize(this, rows)
Resizes the message queues. If size is decreased then removes the oldest messages
Namespace types: log
Parameters:
this (log)
rows (int) : The new size needed for the queues. Default value is 40.
method dateTimeFormat(this, format)
Re/set the date time format used for displaying date and time. Default resets to dd.MMM.yy HH:mm
Namespace types: log
Parameters:
this (log)
format (string)
method resetTextColor(this)
Resets the text color of the log to library default.
Namespace types: log
Parameters:
this (log)
method resetTextColorBG(this)
Resets the background color of the log to library default.
Namespace types: log
Parameters:
this (log)
method resetHeaderColor(this)
Resets the color used for Headers, to library default.
Namespace types: log
Parameters:
this (log)
method resetHeaderColorBG(this)
Resets the background color used for Headers, to library default.
Namespace types: log
Parameters:
this (log)
method resetStatusColor(this)
Resets the text color of the status row, to library default.
Namespace types: log
Parameters:
this (log)
method resetStatusColorBG(this)
Resets the background color of the status row, to library default.
Namespace types: log
Parameters:
this (log)
method resetFrameColor(this)
Resets the color used for the frame around the log table, to library default.
Namespace types: log
Parameters:
this (log)
method resetColorsHC(this)
Resets the color used for the highlighting when Highlight Text option is used, to library default
Namespace types: log
Parameters:
this (log)
method resetColorsBG(this)
Resets the background color used for setting the background color, when the Color Text option is used, to library default
Namespace types: log
Parameters:
this (log)
method resetColors(this)
Resets the color used for respective error codes, when the Color Text option is used, to library default
Namespace types: log
Parameters:
this (log)
method setColors(this, c)
Sets the colors corresponding to error codes
Index 0 of input array c is color is reserved for future use.
Index 1 of input array c is color for debug code 1.
Index 2 of input array c is color for debug code 2.
There are 2 modes of coloring
1 . Using the Foreground color
2 . Using the Foreground color as background color and a white/black/gray color as foreground color
This is denoting or highlighting. Which effectively puts the foreground color as background color
Namespace types: log
Parameters:
this (log)
c (color ) : Array of colors to be used for corresponding error codes. If the corresponding code is not found, then text color is used
method setColorsHC(this, c)
Sets the highlight colors corresponding to error codes
Index 0 of input array c is color is reserved for future use.
Index 1 of input array c is color for debug code 1.
Index 2 of input array c is color for debug code 2.
There are 2 modes of coloring
1 . Using the Foreground color
2 . Using the Foreground color as background color and a white/black/gray color as foreground color
This is denoting or highlighting. Which effectively puts the foreground color as background color
Namespace types: log
Parameters:
this (log)
c (color ) : Array of highlight colors to be used for corresponding error codes. If the corresponding code is not found, then text color BG is used
method setColorsBG(this, c)
Sets the highlight colors corresponding to debug codes
Index 0 of input array c is color is reserved for future use.
Index 1 of input array c is color for debug code 1.
Index 2 of input array c is color for debug code 2.
There are 2 modes of coloring
1 . Using the Foreground color
2 . Using the Foreground color as background color and a white/black/gray color as foreground color
This is denoting or highlighting. Which effectively puts the foreground color as background color
Namespace types: log
Parameters:
this (log)
c (color ) : Array of background colors to be used for corresponding error codes. If the corresponding code is not found, then text color BG is used
method resetLevelNames(this, prefix, suffix)
Resets the log level names used for corresponding error codes
With prefix/suffix, the default Level name will be like => prefix + Code + suffix
Namespace types: log
Parameters:
this (log)
prefix (string) : Prefix to use when resetting level names
suffix (string) : Suffix to use when resetting level names
method setLevelNames(this, names)
Resets the log level names used for corresponding error codes
Index 0 of input array names is reserved for future use.
Index 1 of input array names is name used for error code 1.
Index 2 of input array names is name used for error code 2.
Namespace types: log
Parameters:
this (log)
names (string ) : Array of log level names be used for corresponding error codes. If the corresponding code is not found, then an empty string is used
method init(this, rows, isConsole)
Sets up data for logging. It consists of 6 separate message queues, and 3 additional queues for bar index, time and log level/error code. Do not directly alter the contents, as library could break.
Namespace types: log
Parameters:
this (log)
rows (int) : Log size, excluding the header/status. Default value is 50.
isConsole (bool) : Whether to init the log as console or logx. True= as console, False = as Logx. Default is true, hence init as console.
method log(this, ec, m1, m2, m3, m4, m5, m6, tv, log)
Logs messages to the queues , including, time/date, bar_index, and error code
Namespace types: log
Parameters:
this (log)
ec (int) : Error/Code to be assigned.
m1 (string) : Message needed to be logged to Q1, or for console.
m2 (string) : Message needed to be logged to Q2. Not used/ignored when in console mode
m3 (string) : Message needed to be logged to Q3. Not used/ignored when in console mode
m4 (string) : Message needed to be logged to Q4. Not used/ignored when in console mode
m5 (string) : Message needed to be logged to Q5. Not used/ignored when in console mode
m6 (string) : Message needed to be logged to Q6. Not used/ignored when in console mode
tv (int) : Time to be used. Default value is time, which logs the start time of bar.
log (bool) : Whether to log the message or not. Default is true.
method page(this, ec, m1, m2, m3, m4, m5, m6, tv, page)
Logs messages to the queues , including, time/date, bar_index, and error code. All messages from previous bars are cleared
Namespace types: log
Parameters:
this (log)
ec (int) : Error/Code to be assigned.
m1 (string) : Message needed to be logged to Q1, or for console.
m2 (string) : Message needed to be logged to Q2. Not used/ignored when in console mode
m3 (string) : Message needed to be logged to Q3. Not used/ignored when in console mode
m4 (string) : Message needed to be logged to Q4. Not used/ignored when in console mode
m5 (string) : Message needed to be logged to Q5. Not used/ignored when in console mode
m6 (string) : Message needed to be logged to Q6. Not used/ignored when in console mode
tv (int) : Time to be used. Default value is time, which logs the start time of bar.
page (bool) : Whether to log the message or not. Default is true.
method turnPage(this, turn)
Set the messages to be on a new page, clearing messages from previous page.
This is not dependent on PageHisotry option, as this method simply just clears all the messages, like turning old pages to a new page.
Namespace types: log
Parameters:
this (log)
turn (bool)
method show(this, position, hhalign, hvalign, hsize, thalign, tvalign, tsize, show, attach)
Display Message Q, Index Q, Time Q, and Log Levels
All options for postion/alignment accept TV values, such as position.bottom_right, text.align_left, size.auto etc.
Namespace types: log
Parameters:
this (log)
position (string) : Position of the table used for displaying the messages. Default is Bottom Right.
hhalign (string) : Horizontal alignment of Header columns
hvalign (string) : Vertical alignment of Header columns
hsize (string) : Size of Header text Options
thalign (string) : Horizontal alignment of all messages
tvalign (string) : Vertical alignment of all messages
tsize (string) : Size of text across the table
show (bool) : Whether to display the logs or not. Default is true.
attach (log) : Console that has been attached via attach method. If na then console will not be shown
method attach(this, attach, position)
Attaches a console to Logx, or moves already attached console around Logx
All options for position/alignment accept TV values, such as position.bottom_right, text.align_left, size.auto etc.
Namespace types: log
Parameters:
this (log)
attach (log) : Console object that has been previously attached.
position (string) : Position of Console in relation to Logx. Can be Top, Right, Bottom, Left. Default is Bottom. If unknown specified then defaults to bottom.
method detach(this, attach)
Detaches the attached console from Logx.
All options for position/alignment accept TV values, such as position.bottom_right, text.align_left, size.auto etc.
Namespace types: log
Parameters:
this (log)
attach (log) : Console object that has been previously attached.
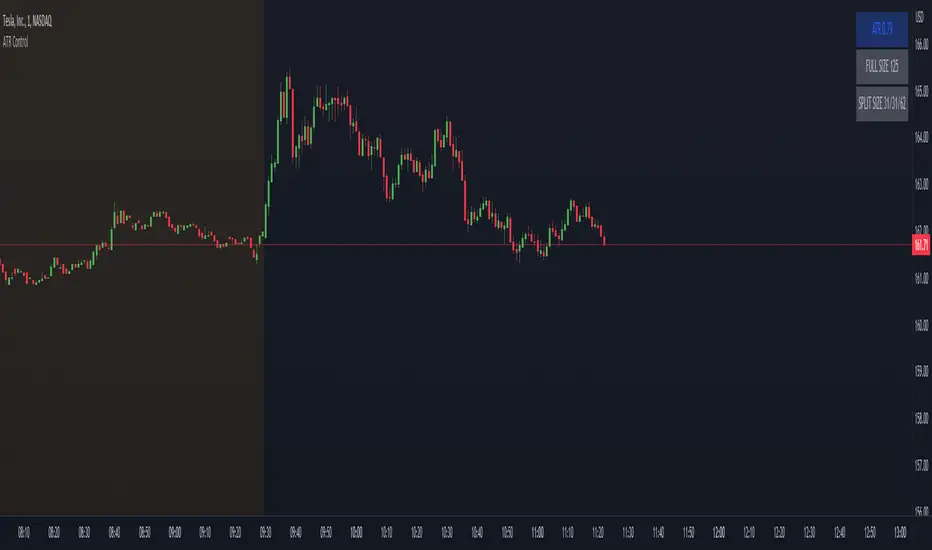
ATR ControlThis indicator shows the following values:
ATR value of the current symbol
Size of the full position based on the maximum risk set
Three sizes that are percents of the full size already present in this indicator
Customizable settings are:
Show/hide single rows
ATR Timeframe
ATR Lenght
First percent of the split to apply
Second percent of the split to apply
Maximum risk
The last percent is automatically calculated using the first two.
Example:
Full size: 500
First percent: 10
Second percent: 40
The third percent is calculated as 100 - first percent - second percent = 50
The split sizes shown are: 50/200/250
God's Little FingerThe "God's Little Finger" indicator uses several technical analysis tools to provide information about the direction of the market and generate buy/sell signals. These tools include a 200-period exponential moving average (EMA), Moving Average Convergence Divergence (MACD), Bollinger Bands, and the Relative Strength Index (RSI).
EMA is used to determine if prices are trending. MACD measures the speed and momentum of the trend. Bollinger Bands are used to determine if prices are staying within a range and to measure the strength of the trend. RSI shows overbought/oversold levels and can be used to determine if the trend will continue.
The indicator generates buy/sell signals based on market conditions. A buy signal is generated when the MACD line is below zero, the price is below the lower boundary of the Bollinger Bands, the price is above the 200-period EMA, and the RSI is in oversold levels (usually below 40). A sell signal is generated when the MACD line is above zero, the price is above the upper boundary of the Bollinger Bands, the price is below the 200-period EMA, and the RSI is in overbought levels (usually above 60).
However, it should be noted that indicators can be used to predict market conditions, but they do not guarantee results and any changes or unexpected events in the market can affect predictions. Therefore, they should always be used in conjunction with other analysis methods and risk management strategies.

ICT Macros by CryptoforICT Macros by Cryptofor
Time periods in which the price is most volatile. At this time, the algorithm is programmed to attack liquidity or fill a significant FVG from which the OF can continue.
Plots of macros:
1. London Macros:
02:33 - 03:00
04:03 - 04:30
2. New York AM Macros:
08:50 - 09:10
09:50 - 10:10
10:50 - 11:10
3. New York Lunch + PM Macros:
11:50 - 12:10
13:10 - 13:40
15:15 - 15:45
Features:
Flexible line settings
Flexible text settings
Display data for all time or for the last 24 hours
Switch for each type of macro
Macro background color settings

Momentum PlayTraders always need a confirmation of momentum in price action to ride the swings.
Momentum Play Indicator consists of the below:
Bullish Conditions :
1)EMA 8 above EMA 34 and rising
2)Candle close above 5 candle high
3) RSI above 60
4) Volume above 5 candles avg. volume
5) ADX above 20
Bearish Conditions :
1)EMA 8 below EMA 34 and falling
2)Candle close below 5 candle low
3) RSI below 40
4) Volume above 5 candles avg. volume
5) ADX above 20
Traders can change the inputs as per their liking to adjust as per their comfortable timeframe.
Credits: Special Thanks to Mr. DTBHAT for sharing the above conditions.

Orion:SagittaSagitta
Sagitta is an indicator the works to assist in the validation of potential long entries and to place stop-loss orders. Sagitta is not a "golden indicator" but more of a confirmation indicator of what prices might be suggesting.
The concept is that while stocks can turn in one bar, it usually takes two bars or more to signal a turn. So, using a measurement of two bars help determine the potential turning of prices.
Behind the scenes, Sagitta is nothing more than a 2 period stochastic which has had its values divided into five specific zones.
Dividing the range of the two bars in five sections, the High is equal to 100 and the Low is equal to 0.
The zones are:
20 = bearish (red) – This is when the close is the lower 20% of the two bars
40 = bearish (orange) – This is when the close is between the lower 20% and 40% of the two bars.
60 = neutral (yellow) – This is when the close is between the middle 40% - 60% of the two bars.
80 = bullish (blue) – This is when the close is between the upper 60% - 80% of the two bars.
100 = bullish (green) – This is when the close is above the upper 80% of the bar.
The general confirmation concept works as such:
When the following bar is of a higher value than the previous bar, there is potential for further upward price movement. Conversely when the following bar is lower than the previous bar, there is potential for further downward movement.
Going from a red bar to orange bar Might be an indication of a positive turn in direction of prices.
Going from a green bar to an orange bar would also be considered a negative directional turn of prices.
When the follow on bar decreases (ie, green to blue, blue to yellow, etc) placing a stop-loss would be prudent.
Maroon lines in the middle of a bar is an indication that prices are currently caught in consolidation.
Silver/Gray bars indicate that a high potential exists for a strong upward turn in prices exists.
Consolidation is calculated by determining if the close of one bar is between the high and low of another bar. This then establishes the range high and low. As long as closes continue with this range, the high and low of the range can expand. When the close is outside of the range, the consolidation is reset.
Signals in areas of consolidation (maroon center bar) should be looked upon as if the prices are going to challenge the high of the consolidation range and not necessarily break through.
The entry technique used is:
The greater of the following two calculations:
High of signal bar * 1.002 or High of signal bar + .03
The stop-loss technique used is:
The lesser of the following two calculations:
Low of signal bar * .998 or Low of signal bar - .03
IF an entry signal is generated and the price doesn’t reach the entry calculation. It is considered a failed entry and is not considered a negative or that you missed out on something. This has saved you from losing money since the prices are not ready to commit to the direction.
When placing a stop-loss, it is never suggested that you lower the value of a stop-loss. Always move your stop-losses higher in order to lock in profit in case of a negative turn.