Dynamic 5DMA/EMA with Color for Multiple Products🔹 Dynamic 5DMA/EMA with Slope-Based Coloring (All Timeframes)
This indicator plots a dynamic 5-period moving average that adapts intelligently to your chart's timeframe and product type — giving you a clean, slope-sensitive visual edge across intraday, daily, and weekly views.
✅ Key Features:
📈 Dynamic MA Length Scaling:
On intraday timeframes, the MA adjusts for your selected market session (RTH, ETH, VIX, or Futures), calculating a true 5-day average based on actual session length — not just a flat bar count.
🔄 Automatic Timeframe Detection:
Daily Chart: Uses standard 5DMA or 5EMA.
Weekly Chart: Applies a true 5-week MA.
Intraday Charts: Converts 5 days into bar-length equivalent dynamically.
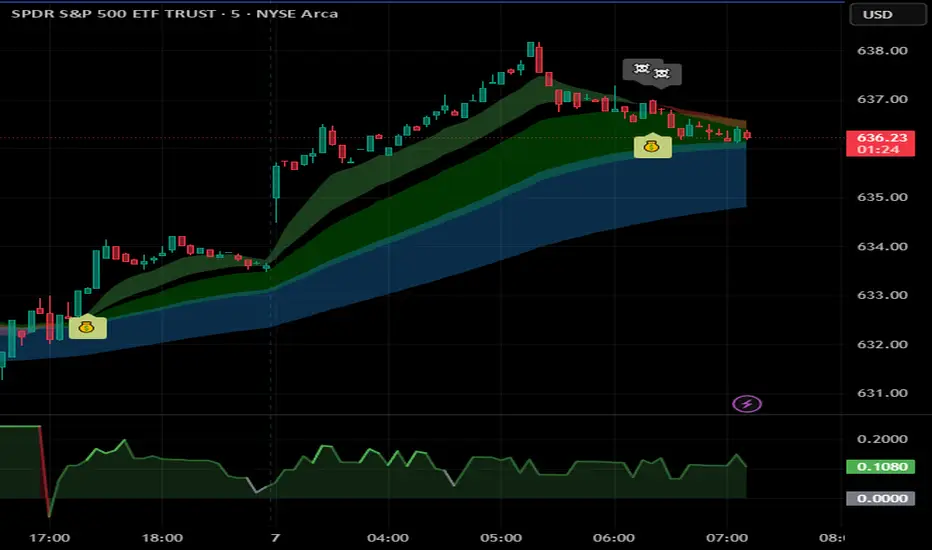
🎨 Color-Coded Slope Logic:
Green = Rising MA (bullish slope)
Red = Falling MA (bearish slope)
Neutral slope = previous color held for visual continuity
No more guessing — direction is instantly clear.
⚠️ Built-In Slope Flip Alerts:
Set alerts when the slope of the MA turns up or down. Ideal for timing pullback entries or exits across any product.
⚙️ Session Settings for Proper Scaling:
Choose your product's market structure to ensure accurate 5-day conversion on intraday charts:
Stocks - RTH: 390 mins/day
Stocks - ETH: 780 mins/day
VIX: 855 mins/day
Futures: 1440 mins/day
This ensures the MA reflects 5 full trading days, regardless of session irregularities or bar interval.
📌 Why Use This Indicator?
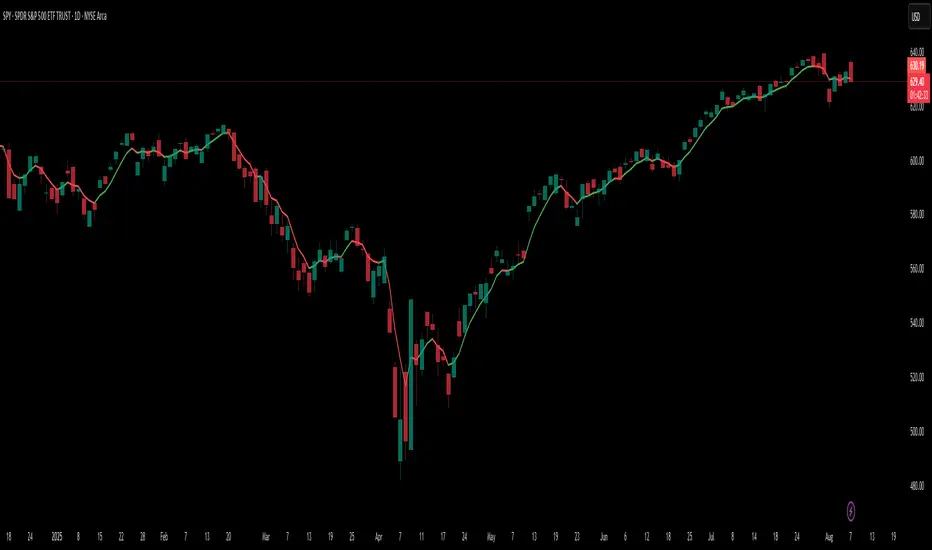
Most MAs misrepresent trend direction on intraday charts because they assume static daily bar counts. This tool corrects that, then adds slope-based coloring to give you a fast, visual read on short-term momentum. Whether you’re swing trading SPY, scalping VIX, or position trading futures, this indicator keeps your view aligned with how institutions see moving averages across timeframes.
🔧 Best For:
VIX & volatility traders
Short-term SPY/SPX traders
Swing traders who value clean setups
Anyone wanting a true 5-day trend anchor on any chart
在腳本中搜尋"港股央企红利etf"
thors_forex_factory_utilityLibrary "forex_factory_utility"
Supporting Utility Library for the Live Economic Calendar by toodegrees Indicator; responsible for data handling, and plotting news event data.
isLeapYear()
Finds if it's currently a leap year or not.
Returns: Returns True if the current year is a leap year.
daysMonth(M)
Provides the days in a given month of the year, adjusted during leap years.
Parameters:
M (int) : Month in numerical integer format (i.e. Jan=1).
Returns: Days in the provided month.
MMM(M)
Converts a month from a numerical integer format to a MMM format (i.e. 'Jan').
Parameters:
M (int) : Month in numerical integer format (i.e. Jan=1).
Returns: Month in MMM format (i.e. 'Jan').
dow(D)
Converts a numbered day of the week string in format to 'DDD' format (i.e. "1" = Sun).
Parameters:
D (string) : Numbered day of the week from 1 to 7, starting on Sunday.
Returns: Returns the day of the week in 'DDD' format (i.e. "Fri").
size(S, N)
Converts a size string into the corresponding Pine Script v5 format, or N times smaller/bigger.
Parameters:
S (string) : Size string: "Tiny", "Small", "Normal", "Large", or "Huge".
N (int) : Size variation, can be positive (larger than S), or negative (smaller than S).
Returns: Size string in Pine Script v5 format.
lineStyle(S)
Converts a line style string into the corresponding Pine Script v5 format.
Parameters:
S (string) : Line style string: "Dashed", "Dotted" or "Solid".
Returns: Line style string in Pine Script v5 format.
lineTrnsp(S)
Converts a transparency style string into the corresponding integer value.
Parameters:
S (string) : Line style string: "Light", "Medium" or "Heavy".
Returns: Transparency integer.
boxLoc(X, Y)
Converts position strings of X and Y into a table position in Pine Script v5 format.
Parameters:
X (string) : X-axis string: "Left", "Center", or "Right".
Y (string) : Y-axis string: "Top", "Middle", or "Bottom".
Returns: Table location string in Pine Script v5 format.
method bubbleSort_NewsTOD(N)
Performs bubble sort on a Forex Factory News array of all news from the same date, ordering them in ascending order based on the time of the day.
Namespace types: array
Parameters:
N (array) : Forex Factory News array.
Returns: void
bubbleSort_News(N)
Performs bubble sort on a Forex Factory News array, ordering them in ascending order based on the time of the day, and date.
Parameters:
N (array) : Forex Factory News array.
Returns: Sorted Forex Factory News array.
weekNews(N, C, I)
Creates a Forex Factory News array containing the current week's Forex Factory News.
Parameters:
N (array) : Forex Factory News array containing this week's unfiltered Forex Factory News.
C (array) : Currency filter array (string array).
I (array) : Impact filter array (color array).
Returns: Forex Factory News array containing the current week's Forex Factory News.
todayNews(W, D, M)
Creates a Forex Factory News array containing the current day's Forex Factory News.
Parameters:
W (array) : Forex Factory News array containing this week's Forex Factory News.
D (array) : Forex Factory News array for the current day's Forex Factory News.
M (bool) : Boolean that marks whether the current chart has a Day candle-switch at Midnight New York Time.
Returns: Forex Factory News array containing the current day's Forex Factory News.
adjustTimezone(N, TZH, TZM)
Transposes the Time of the Day, and Date, in the Forex Factory News Table to a custom Timezone.
Parameters:
N (array) : Forex Factory News array.
TZH (int) : Custom Timezone hour.
TZM (int) : Custom Timezone minute.
Returns: Reformatted Forex Factory News array.
NewsAMPM_TOD(N)
Reformats the Time of the Day in the Forex Factory News Table to AM/PM format.
Parameters:
N (array) : Forex Factory News array.
Returns: Reformatted Forex Factory News array.
impFilter(X, L, M, H)
Creates a filter array from the User's desired Forex Facory News to be shown based on Impact.
Parameters:
X (bool) : Boolean - if True Holidays listed on Forex Factory will be shown.
L (bool) : Boolean - if True Low Impact listed on Forex Factory News will be shown.
M (bool) : Boolean - if True Medium Impact listed on Forex Factory News will be shown.
H (bool) : Boolean - if True High Impact listed on Forex Factory News will be shown.
Returns: Color array with the colors corresponding to the Forex Factory News to be shown.
curFilter(A, C1, C2, C3, C4, C5, C6, C7, C8, C9)
Creates a filter array from the User's desired Forex Facory News to be shown based on Currency.
Parameters:
A (bool) : Boolean - if True News related to the current Chart's symbol listed on Forex Factory will be shown.
C1 (bool) : Boolean - if True News related to the Australian Dollar listed on Forex Factory will be shown.
C2 (bool) : Boolean - if True News related to the Canadian Dollar listed on Forex Factory will be shown.
C3 (bool) : Boolean - if True News related to the Swiss Franc listed on Forex Factory will be shown.
C4 (bool) : Boolean - if True News related to the Chinese Yuan listed on Forex Factory will be shown.
C5 (bool) : Boolean - if True News related to the Euro listed on Forex Factory will be shown.
C6 (bool) : Boolean - if True News related to the British Pound listed on Forex Factory will be shown.
C7 (bool) : Boolean - if True News related to the Japanese Yen listed on Forex Factory will be shown.
C8 (bool) : Boolean - if True News related to the New Zealand Dollar listed on Forex Factory will be shown.
C9 (bool) : Boolean - if True News related to the US Dollar listed on Forex Factory will be shown.
Returns: String array with the currencies corresponding to the Forex Factory News to be shown.
FF_OnChartLine(N, T, S)
Plots vertical lines where a Forex Factory News event will occur, or has already occurred.
Parameters:
N (array) : News-type array containing all the Forex Factory News.
T (int) : Transparency integer value (0-100) for the lines.
S (string) : Line style in Pine Script v5 format.
Returns: void
method updateStringMatrix(M, P, V)
Updates a string Matrix containing the tooltips for Forex Factory News Event information for a given candle.
Namespace types: matrix
Parameters:
M (matrix) : String matrix.
P (int) : Position (row) of the Matrix to update based on the impact.
V (string) : information to push to the Matrix.
Returns: void
FF_OnChartLabel(N, Y, S, O)
Plots labels where a Forex Factory News has already occurred based on its/their impact.
Parameters:
N (array) : News-type array containing all the Forex Factory News.
Y (string) : String that gives direction on where to plot the label (options= "Above", "Below", "Auto").
S (string) : Label size in Pine Script v5 format.
O (bool) : Show outline of labels?
Returns: void
historical(T, D, W, X)
Deletes Forex Factory News drawings which are ourside a specific Time window.
Parameters:
T (int) : Number of days input used for Forex Factory News drawings' history.
D (bool) : Boolean that when true will only display Forex Factory News drawings of the current day.
W (bool) : Boolean that when true will only display Forex Factory News drawings of the current week.
X (string) : String that gives direction on what lines to plot based on Time (options= "Future", "Both").
Returns: void
newTable(P, B)
Creates a new Table object with parameters tailored to the Forex Factory News Table.
Parameters:
P (string) : Position string for the Table, in Pine Script v5 format.
B (color) : Border and frame color for the News Table.
Returns: Empty Forex Factory News Table.
resetTable(P, S, headTextC, headBgC, B)
Resets a Table object with parameters and headers tailored to the Forex Factory News Table.
Parameters:
P (string) : Position string for the Table, in Pine Script v5 format.
S (string) : Size string for the Table's text, in Pine Script v5 format.
headTextC (color)
headBgC (color)
B (color) : Border and frame color for the News Table.
Returns: Empty Forex Factory News Table.
logNews(N, TBL, R, S, rowTextC, rowBgC)
Adds an event to the Forex Factory News Table.
Parameters:
N (News) : News-type object.
TBL (table) : Forex Factory News Table object to add the News to.
R (int) : Row to add the event to in the Forex Factory News Table.
S (string) : Size string for the event's text, in Pine Script v5 format.
rowTextC (color)
rowBgC (color)
Returns: void
FF_Table(N, P, S, headTextC, headBgC, rowTextC, rowBgC, B)
Creates the Forex Factory News Table.
Parameters:
N (array) : News-type array containing all the Forex Factory News.
P (string) : Position string for the Table, in Pine Script v5 format.
S (string) : Size string for the Table's text, in Pine Script v5 format.
headTextC (color)
headBgC (color)
rowTextC (color)
rowBgC (color)
B (color) : Border and frame color for the News Table.
Returns: Forex Factory News Table.
timeline(N, T, F, TZH, TZM, D)
Shades Forex Factory News events in the Forex Factory News Table after they occur.
Parameters:
N (array) : News-type array containing all the Forex Factory News.
T (table) : Forex Facory News table object.
F (color) : Color used as shading once the Forex Factory News has occurred.
TZH (int) : Custom Timezone hour, if any.
TZM (int) : Custom Timezone minute, if any.
D (bool) : Daily Forex Factory News flag.
Returns: Forex Factory News Table.
News
Custom News type which contains informatino about a Forex Factory News Event.
Fields:
dow (series string) : Day of the week, in DDD format (i.e. 'Mon').
dat (series string) : Date, in MMM D format (i.e. 'Jan 1').
_t (series int)
tod (series string) : Time of the day, in hh:mm 24-Hour format (i.e 17:10).
cur (series string) : Currency, in CCC format (i.e. "USD").
imp (series color) : Impact, the respective impact color for Forex Factory News Events.
ttl (series string) : Title, encoded in a custom number mapping (see the toodegrees/toodegrees_forex_factory library to learn more).
tmst (series int)
ln (series line)

Green Arrow Signal: Close > EMA9 and EMA9 of RSI123 > 100Plot a green arrow below the bar when:
Close price > EMA9
EMA9 of RSI(123) > 100

ai quant oculusAI QUANT OCULUS
Version 1.0 | Pine Script v6
Purpose & Innovation
AI QUANT OCULUS integrates four distinct technical concepts—exponential trend filtering, adaptive smoothing, momentum oscillation, and Gaussian smoothing—into a single, cohesive system that delivers clear, objective buy and sell signals along with automatically plotted stop-loss and three profit-target levels. This mash-up goes beyond a simple EMA crossover or standalone TRIX oscillator by requiring confluence across trend, adaptive moving averages, momentum direction, and smoothed price action, reducing false triggers and focusing on high‐probability turning points.
How It Works & Why Its Components Matter
Trend Filter: EMA vs. Adaptive MA
EMA (20) measures the prevailing trend with fixed sensitivity.
Adaptive MA (also EMA-based, length 10) approximates a faster-responding moving average, standing in for a KAMA-style filter.
Bullish bias requires AMA > EMA; bearish bias requires AMA < EMA. This ensures signals align with both the underlying trend and a more nimble view of recent price action.
Momentum Confirmation: TRIX
Calculates a triple-smoothed EMA of price over TRIX Length (15), then converts it to a percentage rate-of-change oscillator.
Positive TRIX reinforces bullish entries; negative TRIX reinforces bearish entries. Using TRIX helps filter whipsaws by focusing on sustained momentum shifts.
Gaussian Price Smoother
Applies two back-to-back 5-period EMAs to the price (“gaussian” smoothing) to remove short-term noise.
Price above the smoothed line confirms strength for longs; below confirms weakness for shorts. This layer avoids entries on erratic spikes.
Confluence Signals
Buy Signal (isBull) fires only when:
AMA > EMA (trend alignment)
TRIX > 0 (momentum support)
Close > Gaussian (price strength)
Sell Signal (isBear) fires under the inverse conditions.
Requiring all three conditions simultaneously sharply reduces false triggers common to single-indicator systems.
Automatic Risk & Reward Plotting
On each new buy or sell signal (edge detection via not isBull or not isBear ), the script:
Stores entryPrice at the signal bar’s close.
Draws a stop-loss line at entry minus ATR(14) × Stop Multiplier (1.5) by default.
Plots three profit-target lines at entry plus ATR × Target Multiplier (1×, 1.5×, and 2×).
All previous labels and lines are deleted on each new signal, keeping the chart uncluttered and focusing only on the current trade.
Inputs & Customization
Input Description Default
EMA Length Period for the main trend EMA 20
Adaptive MA Length Period for the faster adaptive EM A substitute 10
TRIX Length Period for the triple-smoothed momentum oscillator 15
Dominant Cycle Length (Reserved) 40
Stop Multiplier ATR multiple for stop-loss distance 1.5
Target Multiplier ATR multiple for first profit target 1.5
Show Buy/Sell Signals Toggle on-chart labels for entry signals On
How to Use
Apply to Chart: Best on 15 m–1 h timeframes for swing entries or 5 m for agile scalps.
Wait for Full Confluence:
Look for the AMA to cross above/below the EMA and verify TRIX and Gaussian conditions on the same bar.
A bright “LONG” or “SHORT” label marks your entry.
Manage the Trade:
Place your stop where the red or green SL line appears.
Scale or exit at the three yellow TP1/TP2/TP3 lines, automatically drawn by volatility.
Repeat Cleanly: Each new signal clears prior annotations, ensuring you only track the active setup.
Why This Script Stands Out
Multi-Layer Confluence: Trend, momentum, and noise-reduction must all align, addressing the weaknesses of single-indicator strategies.
Automated Trade Management: No manual plotting—stop and target lines appear seamlessly with each signal.
Transparent & Customizable: All logic is open, adjustable, and clearly documented, allowing traders to tweak lengths and multipliers to suit different instruments.
Disclaimer
No indicator guarantees profit. Always backtest AI QUANT OCULUS extensively, combine its signals with your own analysis and risk controls, and practice sound money management before trading live.


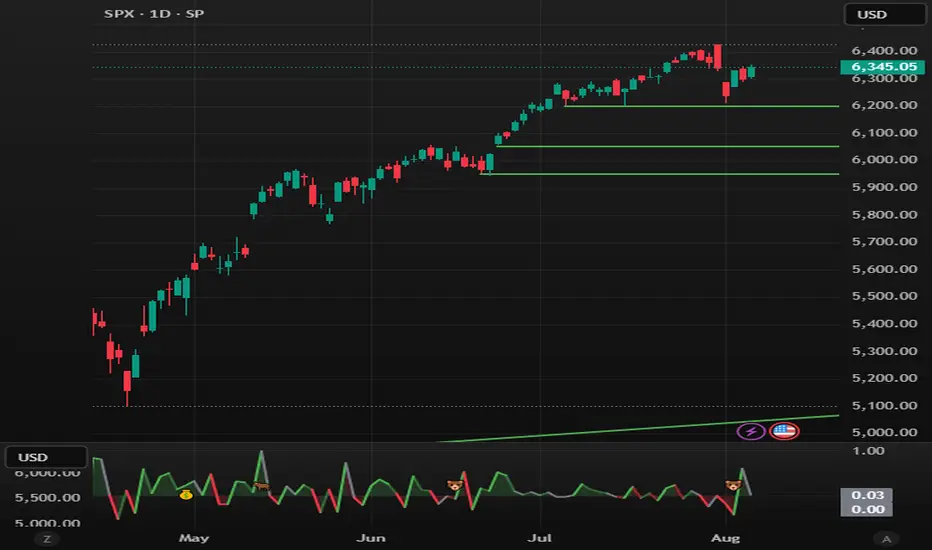
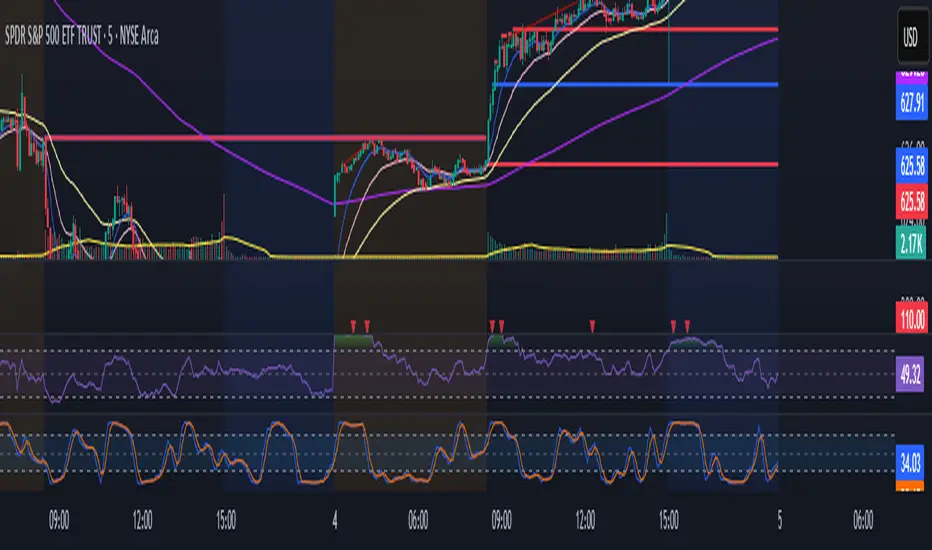
RSI Cloud Zones (by AButterfly)RSI instruction: Uptrend market only. LONG only. Should use only when SPY and QQQ are above 50 SMA and 200 SMA, and the 50sma is above 200sma, and RSI(14) is above 50 ............... BUY only in the GREEN area. Do NOT buy above GREEN green area. That would be chase (after a train, a ship that left). Take profit in the RED area, preferably on a green candle. This does not encourage SHORT-ing. LONG only. Disclaimer: This is an entertainment. If you lose money, don't blame this indicator or the creator. You have to pay attention to whether the market is on uptrend.

Daily Levels3 simple daily levels
Todays Open will label any historical points an yesterdays close
There are plenty of these available but they all seemed overly complex so I adapted this to suit my needs
This indicator plots customizable daily session levels (Today's Open, Previous High/Low/Close) on intraday charts, with options for historical days back, session start/close times, labels, colours, and visibility. Ideal for forex and stock traders analysing prior sessions.

Dollar Volume + SD [ZTD]### So, What's the Big Deal with SD Dollar Volume?
TL:DR
What you see:
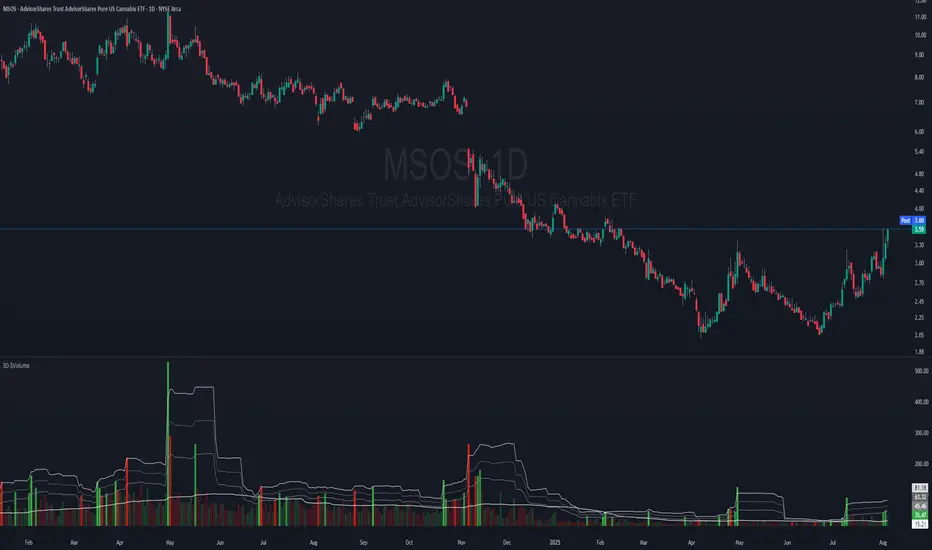
1. $ Volume = (Price * Volume) / 1M (we divide it by 1M by default so you don't have to look at 12 digits but you can select between 100k/1M/10M)
2. User selected M.A. period with difference sources
3. Up to 4 Standard Deviation from that M.A.
4. Color coded (explained below)
That's it, no fancy useless multi color rainbows. Functional, bringing depth and clarity to your analysis based on reality not optical illusion.
--------------
The Long version
You know how we've always looked at volume? It's a classic, but it's got a blind spot. A million shares traded when a stock is at $10 is a completely different ballgame from a million shares traded when it's at $200. The first is $10M in action; the second is $200M. Traditional volume treats them the same, but they are not the same story.
That's the whole idea behind the **Dollar Volume Standard Deviation (SD $VVOLUME)** indicator. Instead of just counting shares, it tracks the **actual dollar amount** ( also refered as Dollar Volume) changing hands. This gives you a much clearer picture of the real financial power behind a price move. It helps you see when the "big money" is truly stepping in or backing off.
Think about it this way: after a 20% drop on earnings, you might see a 10% volume increase and think, "Wow, buyers are stepping in!" But if you look at the *value traded*, it might actually be lower than the day before because the share price is so much cheaper. This indicator cuts through that noise.
What about that smaller stock you bought that suddenly doubles in prices in a matter of months. Do you really thing the volume you are looking at carries any meaning anymore?
On longer time frame? Think about Volume traded vs Value Traded on NVDA for example. Looking at volume alone on those charts is absolutely meaningless. I even wonder why volume alone ever existed in the first place as an indicator.
### How to Use It in Your Trading
This isn't just theory; here’s how you can actually use it to make better decisions.
#### Reading the Indicator
The indicator is designed to be visual and intuitive. Here’s what you're looking at:
* **The Bars:** Each bar on the indicator represents the total dollar value traded during that period. Bigger bar, more money moved.
* **The White Line:** This is your baseline—the moving average of the value traded. It shows you the normal level of money flow for that stock.
* **Bar Colors (The Important Part):**
* **Direction:** **Green** means the stock closed higher in that period. **Red** means it closed lower. Simple enough.
* **Intensity:** This is the real magic. The brightness or intensity of the color tells you how significant that money flow was. A dull, faded bar means the value traded was pretty average. A **bright, intense bar** means the value was way above normal (usually 1 or 2 standard deviations away from the average). *That's* when you need to pay attention.
#### Actionable Signals for Your Strategy
* **Spotting High-Conviction Moves:** When you see a bright, intense red or green bar that towers over the others, that's a signal of major conviction. Big players are making a decisive move, either buying up everything in sight or dumping their positions. This is your cue that something significant is happening.
* **Confirming a Trend's Strength:** Are you in a strong uptrend? Look for a consistent pattern of bright green bars. This tells you that significant capital is flowing in to support the rising price. It's confirmation that the trend has legs.
* **Catching a Weakening Trend (Divergence):** This is a powerful one. Imagine the stock price is grinding out new highs, but on the SD
V
VOLUME
indicator, the bars are getting smaller and less intense. That's a major red flag. It shows that even though the price is inching up, the real money isn't following. There's no conviction, and the trend could be about to reverse.
* **Gauging Liquidity:** If the bars are consistently low and dull, it's a sign that interest in the stock is drying up. It's a good way to spot illiquid conditions and avoid getting trapped in a stock that's hard to get out of.
Ultimately, SD SEED_YASHALGO_NSE_BREADTH:VOLUME helps you see the market from a different angle. It's not just about the noise of shares being traded; it's about following the money.
Options Strategy V2.0📈 Options Strategy V2.0 – Intraday Reversal-Resilient Momentum System
Overview:
This strategy is designed specifically for intraday SPY, TSLA, MSFT, etc. options trading (0DTE or 1DTE), using high-probability signals derived from a confluence of technical indicators: EMA crossovers, RSI thresholds, ATR-based risk control, and volume spikes. The strategy aims to capture strong directional moves while avoiding overtrading, thanks to a built-in cooldown logic and optional time/session filters.
⚙️ Core Concept
The strategy executes trades only in the direction of the prevailing trend, determined by short- and long-term Exponential Moving Averages (EMA). Entry signals are generated when the Relative Strength Index (RSI) confirms momentum in the direction of the trend, and volume spikes suggest institutional activity.
To increase adaptability and user control, it includes a highly customizable parameter set for both long and short entries independently.
📌 Key Features
✅ Trend-Following Logic
Long entries are only allowed when EMA(short) > EMA(long)
Short entries are only allowed when EMA(short) < EMA(long)
✅ RSI Confirmation
Long: Requires RSI crossover above a configurable threshold
Short: Requires RSI crossunder below a configurable threshold
Optional rejection filters: Entry blocked above/below specific RSI extremes
✅ Volume Spike Filter
Confirms institutional participation by comparing current volume to an average multiplied by a user-defined factor.
✅ ATR-Based Risk Management
Both Stop Loss (SL) and Take Profit (TP) are dynamically calculated using ATR × a multiplier.
TP/SL ratio is fully configurable.
✅ Cooldown Control
After every trade, the system waits for a set number of bars before allowing new entries.
This prevents overtrading and increases signal quality.
Optionally, cooldown is ignored for reversal trades, ensuring the system can react immediately to a confirmed trend change.
✅ Candle Body Filter (Noise Control)
Avoids trades on candles with too small bodies relative to wicks (often noise or indecision candles).
✅ VWAP Confirmation (Optional)
Ensures price is trading above VWAP for long entries, or below for short entries.
✅ Time & Session Filters
Trades only during regular market hours (09:30–16:00 EST).
No-trade zone (e.g., 14:15–15:45 EST) to avoid low-liquidity traps or late-day whipsaws.
✅ End-of-Day Auto Close
All open positions are force-closed at 15:55 EST, protecting against overnight risk (especially relevant for 0DTE options).
📊 Visual Aids
EMA plots show trend direction
VWAP line provides real-time mean-reversion context
Stop Loss and Take Profit lines appear dynamically with each trade
Alerts notify of entry signals and exit triggers
🔧 Customization Panel
Nearly every element of the strategy can be tailored:
EMA lengths (short and long, for both sides)
RSI thresholds and length
ATR length, SL multiplier, and TP/SL ratio
Volume spike sensitivity
Minimum EMA distance filter
Candle body ratio filter
Session restrictions
Cooldown logic (duration + reversal exception)
This makes the strategy extremely versatile, allowing both conservative and aggressive configurations depending on the trader’s profile and the market context.
📌 Example Use Case: SPY Options (0DTE or 1DTE)
This system was designed and tested specifically for SPY and other intraday options trading, where:
Delta is around 0.50 or higher
Trades are short-lived (often 1–5 candles)
You aim to trade 1–3 signals per day, filtering out weak entries
🚫 Important Notes
It is not a scalping strategy; it relies on confirmed breakouts with trend support
No pyramiding or re-entries without cooldown to preserve risk integrity
Should be used with real-time alerts and manual broker execution
📈 Alerts Included
📈 Long Entry Signal
📉 Short Entry Signal
⚠️ Auto-closed all positions at 15:55 EST
✅ Proven Settings – Real Trades + Backtest Results
The current version of the strategy includes the optimal settings I’ve arrived at through extensive backtesting, as well as 3 months of real trading with consistent profitability. These results reflect real-world execution under live market conditions using 0DTE SPY options, with disciplined trade management and risk control.
🧠 Final Thoughts
Options Strategy V2.0 is a robust, highly tunable intraday strategy that blends momentum, trend-following, and volume confirmation. It is ideal for disciplined traders focused on SPY or other 0DTE/1DTE options, and it includes guardrails to reduce false signals and improve execution timing.
Perfect for those who seek precision, flexibility, and risk-defined setups—not blind automation.

Current Day High/Low and Mid- Made by IshaanThis TradingView indicator plots the current day's high, low, and mid (50%) levels, based on the daily timeframe, and displays them on any intraday chart (e.g., 15m, 1h, etc.).
Lines begin at the official market open time (default: 9:30 AM exchange time).
Lines extend right indefinitely so they’re visible throughout the day.
Values are updated live during the trading session using daily high and low data.
The mid line is calculated as the average of the current day’s high and low.
You can customize:
Line colors (high, low, mid)
Line thickness
Market open time
This tool is helpful for traders looking to monitor intraday interaction with key daily levels.

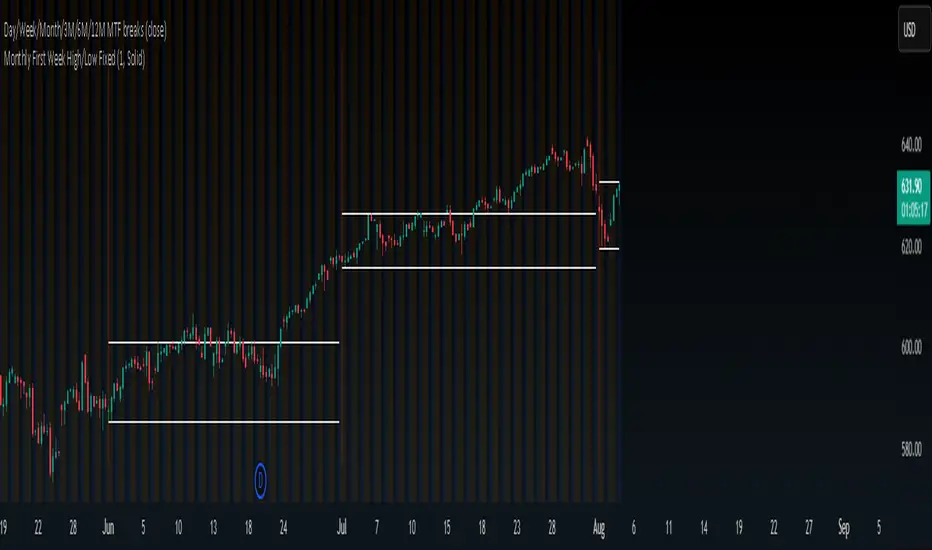
First week high/low of the monthThis is a simple indicator that draws two customizable horizontal lines representing the first week of the month.
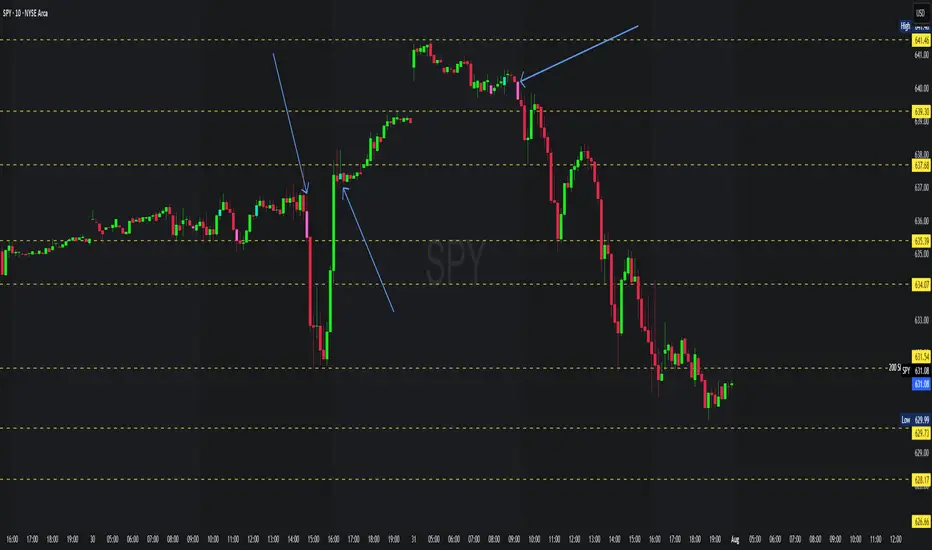
First Candle Low Break SignalTheory: If the SPY (or anything really) starts the day with a green candle, it never breaks below that candle on that day.
This indicator was quickly made to check that theory with some interesting results.
Requirement: The Symbol must be set to "extended trading hours", otherwise the script cannot see the changes between days.

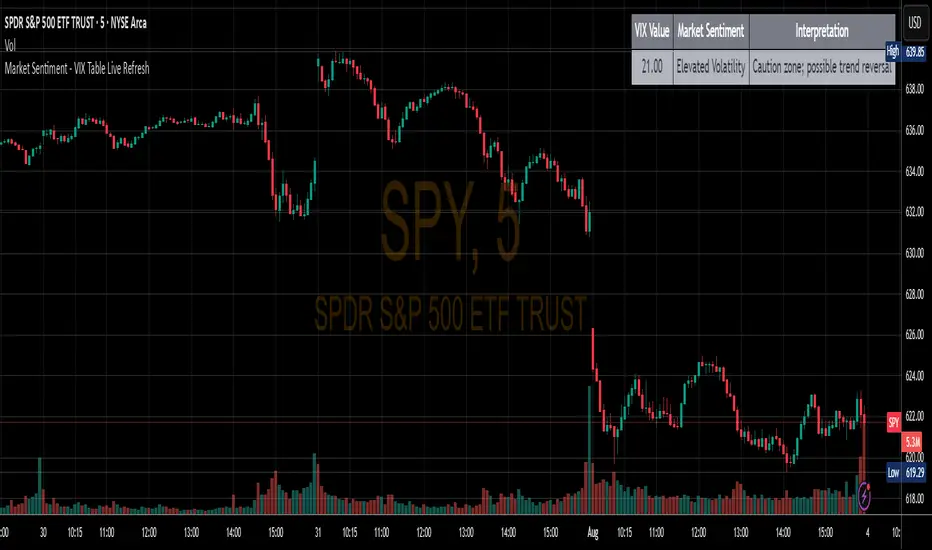
Market Sentiment - VIX Table Live RefreshProvides Market sentiment visual representation for easy understanding - using CBOE:VIX values
The VIX Sentiment Table provides an at-a-glance assessment of market mood by visualizing live data from the CBOE Volatility Index (VIX). Updated in sync with your chart’s resolution, this intuitive tool breaks down the current VIX level into clear sentiment zones—ranging from “Complacency” to “Panic”—paired with concise interpretations to guide your trading decisions.
4 Anchored VWAPs This indicator shows 4 periods of Anchored VWAPs according to specific dates the user chose.

EMA 10/20/60/120// This script plots four Exponential Moving Averages (10, 20, 60, 120)
// for trend-following analysis. Crossovers and the order of the EMAs can
// help identify the strength and direction of the trend.


EMA 8 & 21 crossover change EMA 8 & 21 crossover change Indicator This custom TradingView indicator highlights trend shifts by changing candle colors when the 8 EMA crosses the 21 EMA. Bullish crossovers turn candles different color, while bearish crossovers turns different as well—making it easy to visually identify emerging trends and momentum shifts in real time.
Pre-Market & Previous Day Levels 300here is the indicator pre market high low and prev day hihg low levels

Intra Bullish Strategy - Profit Ping v4.0ProfitPing 4.0 is a high-precision intraday swing trading strategy designed for global equity markets, including the US, South Africa, and Australia. The system identifies high-probability BUY and EXIT signals using a confluence of technical indicators and real-time volume dynamics.
🧠 Key Features:
Dual EMA Crossover (7 & 14) for short-term trend confirmation
Volume Spike Detection based on 20-period moving average
RSI Momentum Filter (ideal zone: 55–65) to avoid overbought entries
MACD Histogram & Signal Line Sync for trend momentum validation
Candlestick Pattern Filtering (e.g. bullish engulfing, flags, breakout candles)
Multi-Timeframe Confirmation (optional) for intraday trend alignment
Dynamic Risk-to-Reward Logic built into alert framework
Webhook-compatible JSON alerts for automation to Google Sheets, Power BI, and IBKR
🛠️ Alert System:
BUY alert triggers when all bullish conditions align
EXIT alert triggers only if a previous BUY exists for that ticker
Trade status is updated live in Google Sheets and integrated with Power BI dashboards
Orphaned EXITs (no matched BUY) are tracked separately for accuracy review
🔄 Ideal For:
Traders seeking 1:2 to 1:5 risk/reward setups
Automation-focused workflows (via TradingView → Google Sheets → Power BI)
Swing traders wanting clean visual logs, automated P&L tracking, and optional IBKR execution
