EMA20 Entry with Lei Teacher Strategy_Trend_Follow_RuleEMA20 Entry with Lei Teacher Strategy Trend Follow Entry Alert
在腳本中搜尋"港股央企红利etf"
Volatility Forecast/*==============================================================================
Volatility Forecast — Publishable Documentation
Author: @BB_9791
License: Mozilla Public License 2.0
WHAT THIS INDICATOR SHOWS
- A daily volatility estimate in percent points, called sigma_day.
- A slow volatility anchor, the 10-year EMA of sigma_day.
- A blended volatility series in percent points:
sigma_blend = (1 − p) * sigma_day + p * EMA_10y(sigma_day)
where p is the Slow weight %, default 30.
- Optional annualization by multiplying by 16, this is a daily-to-annual
conversion used by Robert Carver in his writings.
METHODOLOGY, CREDIT
The estimator follows the approach popularized by Robert Carver
("Systematic Trading", "Advanced Futures Trading Strategies", blog qoppac).
Current daily volatility is computed as an exponentially weighted standard
deviation of daily percent returns, with alpha = 2 / (span + 1).
The slow leg is a long EMA of that volatility series, about 10 years.
The blend uses fixed weights. This keeps the slow leg meaningful through
large price level changes, since the blend is done in percent space first.
MATH DETAILS
Let r_t be daily percent return:
r_t = 100 * (Close_t / Close_{t−1} − 1)
EWMA mean and variance:
m_t = α * r_t + (1 − α) * m_{t−1}
v_t = α * (r_t − m_t)^2 + (1 − α) * v_{t−1}
where α = 2 / (span_current + 1)
Current daily sigma in percent points:
sigma_day = sqrt(v_t)
Slow leg:
sigma_10y = EMA(sigma_day, span_long)
Blend:
sigma_blend = (1 − p) * sigma_day + p * sigma_10y
Annualized option:
sigma_ann = 16 * sigma_blend
INPUTS
- Threshold (percent points): horizontal guide level on the chart.
- Short term span (days): EW stdev span for sigma_day.
- Long term span (days): EMA span for the slow leg, choose about 2500 for 10 years.
- Slow weight %: p in the blend.
- Annualize (x16): plot daily or annualized values.
- Show components: toggles Current and 10y EMA lines.
- The script uses the chart symbol by default.
PLOTS
- Blended σ% as the main line.
- Optional Current σ% and 10y EMA σ%.
- Editable horizontal threshold line in the same units as the plot
(percent points per day or per year).
- Optional EMA 9 and EMA 20 cloud on the blended series, green for uptrend
when EMA 9 is above EMA 20, red otherwise. Opacity is configurable.
HOW TO READ
- Values are percent points of movement per day when not annualized,
for example 1.2 means about 1.2% typical daily move.
- With annualize checked, values are percent points per year, for example 18
means about 18% annualized volatility.
- Use the threshold and the EMA cloud to mark high or low volatility regimes.
NOTES
- All calculations use daily data via request.security at the chart symbol.
- The blend is done in percent space, then optionally annualized, which avoids
bias from the price level.
- This script does not produce trading signals by itself, it is a risk and
regime indicator.
CREDITS
Volatility forecasting method and scaling convention credited to Robert Carver.
See his books and blog for background and parameter choices.
VERSION
v1.0 Initial public release.
==============================================================================*/
ATR Extension from Moving Average, with Robust Sigma Bands
# ATR Extension from Moving Average, with Robust Sigma Bands
**What it does**
This indicator measures how far price is from a selected moving average, expressed in **ATR multiples**, then overlays **robust sigma bands** around the long run central tendency of that extension. Positive values mean price is extended above the MA, negative values mean price is extended below the MA. The signal adapts to volatility through ATR, which makes comparisons consistent across symbols and regimes.
**Why it can help**
* Normalizes distance to an MA by ATR, which controls for changing volatility
* Uses the **bar’s extreme** against the MA, not just the close, so it captures true stretch
* Computes a **median** and **standard deviation** of the extension over a multi-year window, which yields simple, intuitive bands for trend and mean-reversion decisions
---
## Inputs
* **MA length**: default 50, options 200, 64, 50, 20, 9, 4, 3
* **MA timeframe**: Daily or Weekly. The MA is computed on the chosen higher timeframe through `request.security`.
* **MA type**: EMA or SMA
* **Years lookback**: 1 to 10 years, default 5. This sets the sample for the median and sigma calculation, `years * 365` bars.
* **Line width**: visual width of the plotted extension series
* **Table**: optional on-chart table that displays the current long run **median** and **sigma** of the extension, with selectable text size
**Fixed parameters in this release**
* **ATR length**: 20 on the daily timeframe
* **ATR type**: classic ATR. ADR percent is not enabled in this version.
---
## Plots and colors
* **Main plot**: “Extension from 50d EMA” by default. Value is in **ATR multiples**.
* **Reference lines**:
* `median` line, black dashed
* +2σ orange, +3σ red
* −2σ blue, −3σ green
---
## How it is calculated
1. **Moving average** on the selected higher timeframe: EMA or SMA of `close`.
2. **Extreme-based distance** from MA, as a percent of price:
* If `close > MA`, use `(high − MA) / close * 100`
* Else, use `(low − MA) / close * 100`
3. **ATR percent** on the daily timeframe: `ATR(20) / close * 100`
4. **ATR multiples**: extension percent divided by ATR percent
5. **Robust center and spread** over the chosen lookback window:
* Center: **median** of the ATR-multiple series
* Spread: **standard deviation** of that series
* Bands: center ± 1σ, 2σ, 3σ, with 2σ and 3σ drawn
This design yields an intuitive unit scale. A value of **+2.0** means price is about 2 ATR above the selected MA by the most stretched side of the current bar. A value of **−3.0** means roughly 3 ATR below.
---
## Practical use
* **Trend continuation**
* Sustained readings near or above **+1σ** together with a rising MA often signal healthy momentum.
* **Mean reversion**
* Spikes into **±2σ** or **±3σ** can identify stretched conditions for fade setups in range or late-trend environments.
* **Regime awareness**
* The **median** moves slowly. When median drifts positive for many months, the market spends more time extended above the MA, which often marks bullish regimes. The opposite applies in bearish regimes.
**Notes**
* The MA can be set to Weekly while ATR remains Daily. This is deliberate, it keeps the normalization stable for most symbols.
* On very short intraday charts, the extension remains meaningful since it references the session’s extreme against a higher-timeframe MA and a daily ATR.
* Symbols with short histories may not fill the lookback window. Bands will adapt as data accrues.
---
## Table overlay
Enable **Table → Show** to see:
* “ATR from \”
* Current **median** and **sigma** of the extension series for your lookback
---
## Recommended settings
* **Swing equities**: 50 EMA on Daily, 5 to 7 years
* **Index trend work**: 200 EMA on Daily, 10 years
* **Position trading**: 20 or 50 EMA on Weekly MA, 5 to 10 years
---
## Interpretation examples
* Reading **+2.7** with price above a rising 50 EMA, near prior highs
* Strong trend extension, consider pyramiding in trend systems or waiting for a pullback if you are a mean-reverter.
* Reading **−2.2** into multi-month support with flattening MA
* Stretch to the downside that often mean-reverts, size entries based on your system rules.
---
## Credits
The concept of measuring stretch from a moving average in ATR units has a rich community history. This implementation and its presentation draw on ideas popularized by **Jeff Sun**, **SugarTrader**, and **Steve D Jacobs**. Thanks to each for their contributions to ATR-based extension thinking.
---
## License
This script and description are distributed under **MPL-2.0**, consistent with the header in the source code.
---
## Changelog
* **v1.0**: Initial public release. Daily ATR normalization, EMA or SMA on D or W timeframe, robust median and sigma bands, optional table.
---
## Disclaimer
This tool is for educational use only. It is not financial advice. Always test on your own data and strategies, then manage risk accordingly.

ORB with Golden Zone FIB targets, Any Timeframe by TenAMTraderDescription:
This indicator is designed to help traders identify key price levels using Fibonacci extensions and retracements based on the Opening Range Breakout (ORB). The levels are visualized as “Golden Zones”, which can serve as potential targets for trades.
Features:
Customizable ORB Timeframe: By default, the ORB is set from 9:30 AM to 9:45 AM EST, but any timeframe can be configured in the settings to fit your trading style.
Golden Zones as Targets: Fibonacci levels are intended to be used as potential profit-taking zones or areas to monitor for reversals, providing a structured framework for intraday and swing trading.
Adjustable Chart Settings: Color-coded levels make it easy to interpret at a glance, and all lines can be customized for personal preference.
Versatile Application: The indicator works across any timeframe, enabling traders to analyze both intraday and multi-day price action.
How to Use:
Ensure Regular Trading Hours (RTH) is enabled on your chart for accurate level calculation.
Observe price action near Golden Zones: a confirmed breakout may indicate continuation, while a pullback could signal a reversal opportunity.
Use the Golden Zones as reference targets for managing risk and planning exits.
Adjust the ORB timeframe and display settings to match your preferred trading style.
Legal Disclosure:
This indicator is provided for educational purposes only and is not financial advice. Trading carries a substantial risk of loss. Users should always perform their own analysis and consult a licensed financial professional before making any trading decisions. Past performance is not indicative of future results.

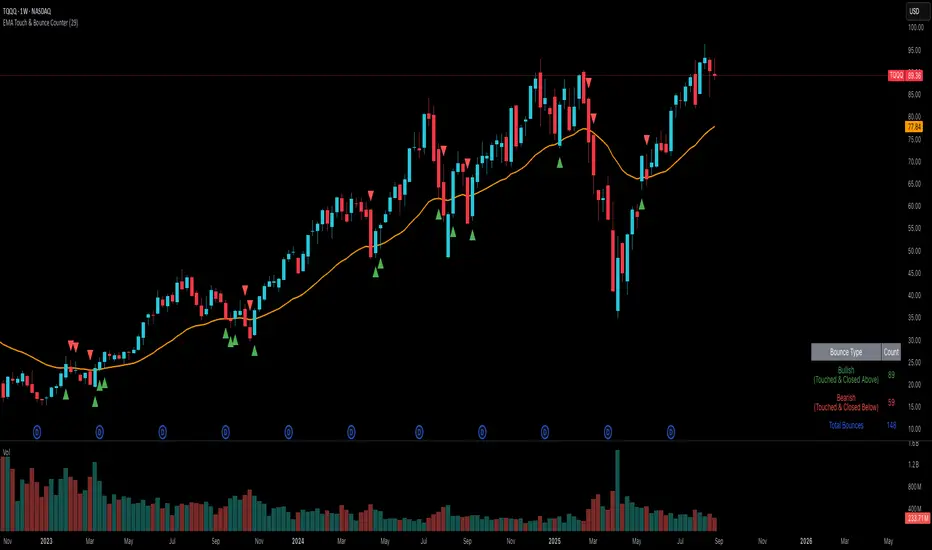
EMA Touch & Bounce Counter
Simple Indicator that allows you to see how many times price has touched an EMA line and bounced off of it without crossing it. The indicator tells you the amount of times it bounced off it in a bullish and bearish trend and also gives you the total amount of bounces to both trends.
This indicator was to just help you identify how respected a given EMA line is in case you decide to go long or short based on the trend.
How to avoid repainting when using security() - viewing optionsHow to avoid repainting when using the security() - Edited PineCoders FAQ with more viewing options
This may be of value to a limited few, but I've introduced a set of Boolean inputs to PineCoders' original script because viewing all the various security lines at once was giving me a brain cramp. I wanted to study each behavior one-by-one. This version (also updated to PineScript v6) will allow users to selectively display each, or any combination, of the security plots. Each plot was updated to include a condition tied to its corresponding input, ensuring it only appears when explicitly enabled. The label-rendering logic only displays when its related plot is active; however, I've also added an input that allows you to remove all labels, enabling you to see the price action more clearly (the labels can sometimes obscure what you want to see). Run this script in replay mode to view the nuanced differences between the 12 methods while selecting/deselecting the desired plots (selecting all at once can be overcrowded and confusing).
All thanks and credit to PineCoders--these changes I made only provide more control over what’s shown on the chart without altering the core structure or intent of the original script. It helped me, so I thought I should share it. If I inadvertently messed something up, please let me know, and I will try to fix it.
I set the defaults for viewing monthly security functions on the daily timeframe. Only the first 2 security functions plot with the default settings, so change the settings as needed. Be sure to read the original notes and detailed explanations in the PineCoders posting "How to avoid repainting when using security() - PineCoders FAQ."
Bottom line, you should use one of the two functions: f_secureSecurity or f_security, depending on what you are trying to do. Hopefully, this script will make it a little easier for the visual learner to understand why (use replay mode or watch live price action on a lower timeframe).
EMA Percentile Rank [SS]Hello!
Excited to release my EMA percentile Rank indicator!
What this indicator does
Plots an EMA and colors it by short-term trend.
When price crosses the EMA (up or down) and remains on that side for three subsequent bars, the cross is “confirmed.”
At the moment of the most recent cross, it anchors a reference price to the crossover point to ensure static price targets.
It measures the historical distance between price and the EMA over a lookback window, separately for bars above and below the EMA.
It computes percentile distances (25%, 50%, 85%, 95%, 99%) and draws target bands above/below the anchor.
Essentially what this indicator does, is it converts the raw “distance from EMA” behavior into probabilistic bands and historical hit rates you can use for targets, stop placement, or mean-reversion/continuation decisions.
Indicator Inputs
EMA length: Default is 21 but you can use any EMA you prefer.
Lookback: Default window is 500, this is length that the percentiles are calculated. You can increase or decrease it according to your preference and performance.
Show Accumulation Table: This allows you to see the table that shows the hits/price accumulation of each of the percentile ranges. UCL means upper confidence and LCL means lower confidence (so upper and lower targets).
About Percentiles
A percentile is a way of expressing the position of a value within a dataset relative to all the other values.
It tells you what percentage of the data points fall at or below that value.
For example:
The 25th percentile means 25% of the values are less than or equal to it.
The 50th percentile (also called the median) means half the values are below it and half are above.
The 99th percentile means only 1% of the values are higher.
Percentiles are useful because they turn raw measurements into context — showing how “extreme” or “typical” a value is compared to historical behavior.
In the EMA Percentile Rank indicator, this concept is applied to the distance between price and the EMA. By calculating percentile distances, the script can mark levels that have historically been reached often (low percentiles) or rarely (high percentiles), helping traders gauge whether current price action is stretched or within normal bounds.
Use Cases
The EMA Percentile Rank indicator is best suited for traders who want to quantify how far price has historically moved away from its EMA and use that context to guide decision-making.
One strong use case is target setting after trend shifts: when a confirmed crossover occurs, the percentile bands (25%, 50%, 85%, 95%, 99%) provide statistically grounded levels for scaling out profits or placing stops, based on how often price has historically reached those distances. This makes it valuable for traders who prefer data-driven risk/reward planning instead of arbitrary point targets. Another use case is identifying stretched conditions — if price rapidly tags the 95% or 99% band after a cross, that’s an unusually large move relative to history, which could signal exhaustion and prompt mean-reversion trades or protective actions.
Conversely, if the accumulation table shows price frequently resides in upper bands after bullish crosses, traders may anticipate continuation and hold positions longer . The indicator is also effective as a trend filter when combined with its EMA color-coding : only taking trades in the trend’s direction and using the bands as dynamic profit zones.
Additionally, it can support multi-timeframe confluence (if you align your chart to the timeframes of interest), where higher-timeframe trend direction aligns with lower-timeframe percentile behavior for higher-probability setups. Swing traders can use it to frame pullbacks — entering near lower percentile bands during an uptrend — while intraday traders might use it to fade extremes or ride breakouts past the median band. Because the anchor price resets only on EMA crosses, the indicator preserves a consistent reference for ongoing trades, which is especially helpful for managing swing positions through noise .
Overall, its strength lies in transforming raw EMA distance data into actionable, probability-weighted levels that adapt to the instrument’s own volatility and tendencies .
Summary
This indicator transforms a simple EMA into a distribution-aware framework: it learns how far price tends to travel relative to the EMA on either side, and turns those excursions into percentile bands and historical hit rates anchored to the most recent cross. That makes it a flexible tool for targets, stops, and regime filtering, and a transparent way to reason about “how stretched is stretched?”—with context from your chosen market and timeframe.
I hope you all enjoy!
And as always, safe trades!

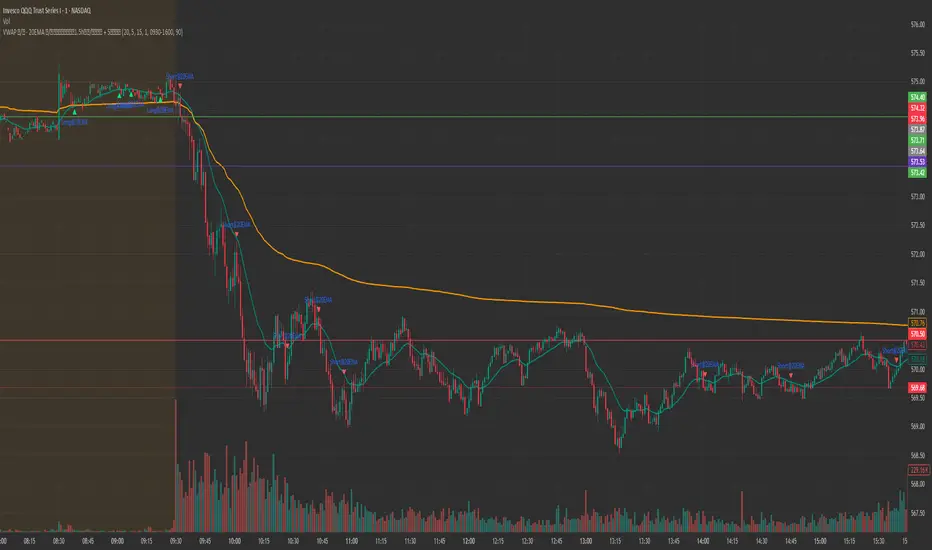
(Fixed-Range) Anchored VWAPThis "Fixed-Range Anchored VWAP" indicator allows traders full control over where the VWAP calculation begins and ends. VWAP combines both price and volume to reflect the true average price paid, often serving as a benchmark for gauging value, sentiment, and trend strength.
With this tool, traders can anchor VWAP to any candle, optionally define an end point, or keep it running forward with a single toggle. Up to three bands can be added around VWAP, either as standard deviations or percentage offsets.
How to Use
The indicator is particularly useful for analyzing VWAP around significant events, like earnings announcements or sharp price swings, to identify support, resistance, and mean-reversion opportunities.
Add the indicator and select a candle to set the Anchor.
Choose an End point or enable Cancel End for an open-ended VWAP.
Pick Std Dev or Percent for band mode.
Turn on up to three bands, adjust multipliers, and set fill colors.
Use VWAP and its bands to evaluate extensions, trend context, and fair value zones.
SMA-Based Candle Color 60The Trend SMA colors the moving average green when sloping upward and red when sloping downward. Candles are also colored based on whether price is above (green) or below (red) the SMA, making trends easy to spot.

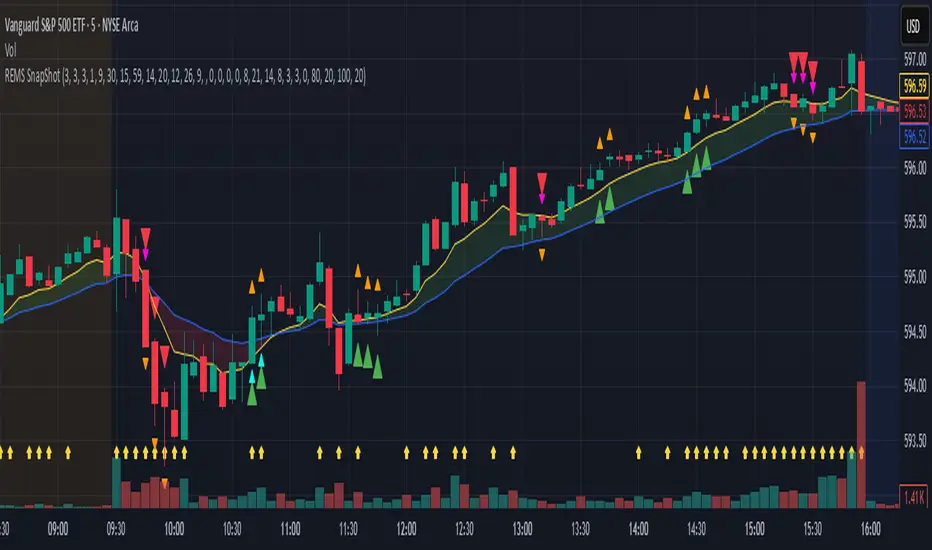
REMS Snap Shot OverlayThe REMS Snap Shot indicator is a multi-factor, confluence-based system that combines momentum (RSI, Stochastic RSI), trend (EMA, MACD), and optional filters (volume, MACD histogram, session time) to identify high-probability trade setups. Signals are only triggered when all enabled conditions align, giving the trader a filtered, visually clear entry signal.
This indicator uses an optional 'look-back' feature where in it will signal an entry based on the recency of specified cross events.
To use the indicator, select which technical indicators you wish to filter, the session you wish to apply (default is 9:30am - 4pm EST, based on your chart time settings), and if which cross events you wish to trigger a reset on the cooldown.
The default settings filter the 4 major technical indicators (RSI, EMAs, MACD, Stochastic RSI) but optional filters exist to further fine tune Stochastic Range, MACD momentum and strength, and volume, with optional visual cues for MACD position, Stochastic RSI position, and volume.
EMAs can be drawn on the chart from this indicator with optional shaded background.
This indicator is an alternative to REMS First Strike, which uses a recency filter instead of a cool down.
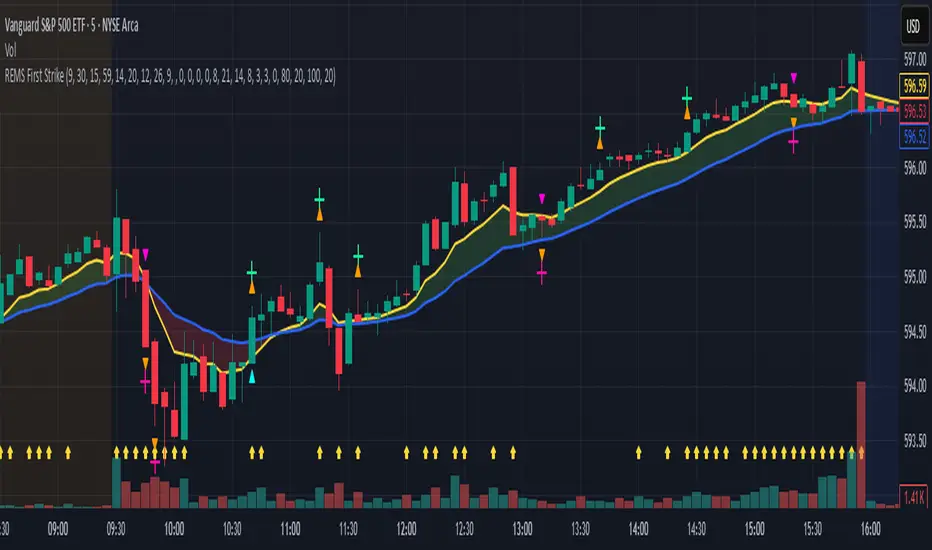
REMS First Strike OverlayThe REMS First Strike indicator is a multi-factor, confluence-based system that combines momentum (RSI, Stochastic RSI), trend (EMA, MACD), and optional filters (volume, MACD histogram, session time) to identify high-probability trade setups. Signals are only triggered when all enabled conditions align, giving the trader a filtered, visually clear entry signal.
This indicator uses an optional 'cool down' feature where in it will signal an entry only after any of the specified cross events occur.
To use the indicator, select which technical indicators you wish to filter, the session you wish to apply (default is 9:30am - 4pm EST, based on your chart time settings), and if which cross events you wish to trigger a reset on the cooldown.
The default settings filter the 4 major technical indicators (RSI, EMAs, MACD, Stochastic RSI) but optional filters exist to further fine tune Stochastic Range, MACD momentum and strength, and volume, with optional visual cues for MACD position, Stochastic RSI position, and volume.
EMAs can be drawn on the chart from this indicator with optional shaded background.
This indicator is an alternative to REMS Snap Shot, which uses a recency filter instead of a cool down.
Breadth Strategy: McClellan + ADn (with EMA Exit)This script uses only McClellan Oscillator + ADn Line, exactly as you specified.
Runs breadth calculations on daily timeframe by default (tf = D). You can change to weekly, etc.
Entries/exits are instant when conditions flip.
Both mcoWS and ADn are plotted for visualization.

Breadth Strategy: McClellan + ADnThis script uses only McClellan Oscillator + ADn Line, exactly as you specified.
Runs breadth calculations on daily timeframe by default (tf = D). You can change to weekly, etc.
Entries/exits are instant when conditions flip.
Both mcoWS and ADn are plotted for visualization.

Momentum Signals – Real-time (Repainting)This indicator generates real-time BUY/SELL signals using a confluence of VWMA trend, 3-bar momentum, and volume, then filters them by a strength score.
⚠️ **WARNING:** This version **repaints**; signals can appear and disappear before the bar closes.

Momentum Signals – Real-time (Repainting)This indicator generates real-time BUY/SELL signals using a confluence of VWMA trend, 3-bar momentum, and volume, then filters them by a strength score.
⚠️ WARNING: This version repaints; signals can appear and disappear before the bar closes.

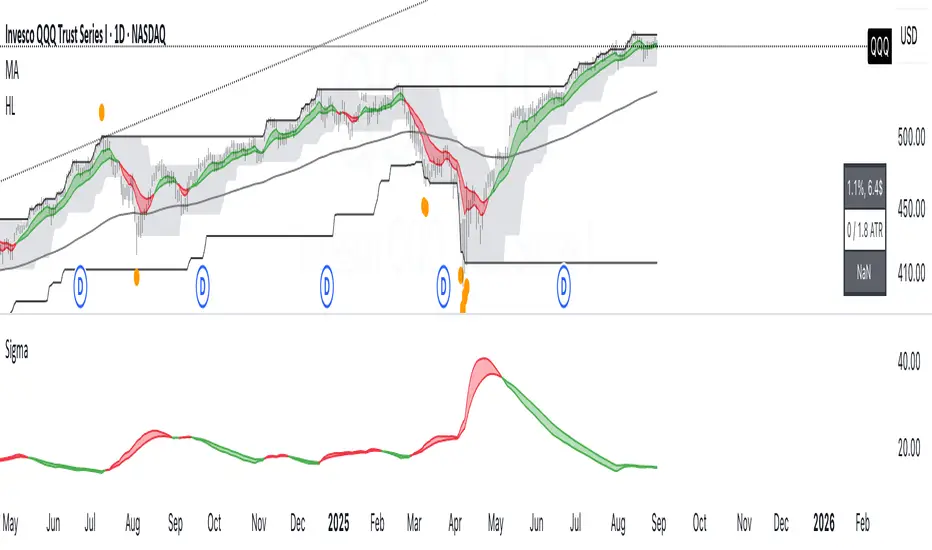
Big Mo’s Glaskugel — Macro Drawdown Risk (v1.1.2)What it does / what you see
An at-a-glance drawdown-risk oscillator that blends several macro US signals.
• A smooth, color-blended line (green→orange→red) shows the scaled risk score (0–100).
• Subtle shading marks “re-steepen warning windows” (starts when the yield curve re-steepens after an inversion; ends on normalization/cool-down).
• A compact status table summarizes: overall risk level, Yield Curve (10y–3m), Credit Stress (Baa–10y), Economy (LEI), and Valuation (CAPE).
Data used & why
Yield Curve (10y–3m) — FRED:T10Y3M. Inversions and subsequent re-steepens often precede recessions/equity drawdowns.
Credit Stress — FRED:BAA10Y vs its 1-year average (deviation in bps). Widening credit spreads flag tightening financial conditions.
Economy (LEI) — ECONOMICS:USLEI. 6-month annualized growth below a cutoff highlights macro deterioration.
Valuation (CAPE) — SHILLER_PE_RATIO_MONTH. Elevated valuations can amplify downside risk.
VIX spikes — optional boost that recognizes sudden risk repricings.
Important disclaimer
This is not a reliable or predictive indicator in all regimes. No guarantees or warranties of any kind are provided. It is not financial advice. Signals can be early, late, or wrong.
That said, it leans on well-studied warning factors (yield-curve dynamics, credit spreads, LEI weakness, valuation extremes) that have flagged major market downturns in the past.
Key customization / tweaks
Weights for each component (Yield, Credit, LEI, VIX, CAPE).
Thresholds: yield inversion months, re-steepen lookback, credit-stress bps, LEI cutoff, CAPE level, VIX spike levels.
Re-steepen boost: enable/disable, base points, half-life decay.
Shading behavior: cool-down bars to “unwarn,” max warning duration, only shade when risk ≠ green.
Scaling & smoothing: dynamic rolling max, EMA length, yellow/red thresholds.
Status table: position, and a snapshot mode to view values at a chosen historical time.

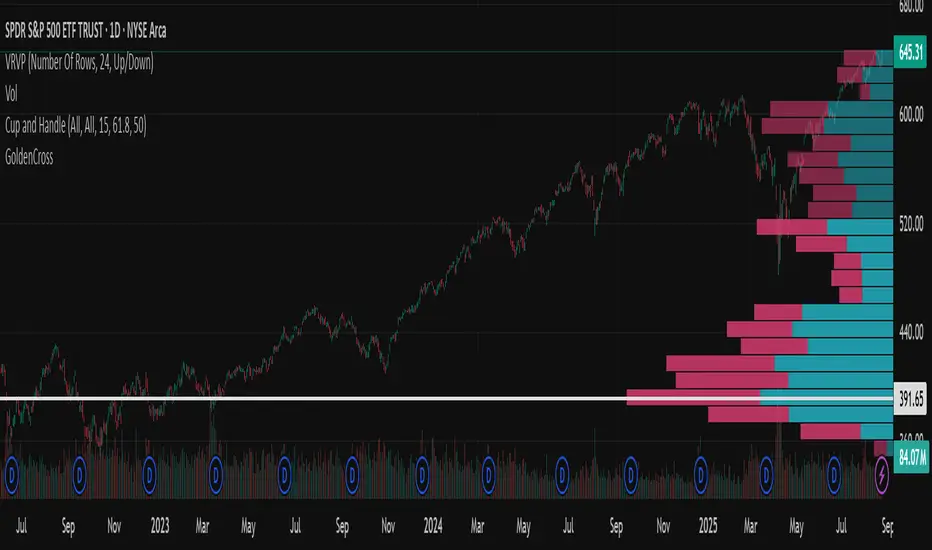
Volume Profile + VAH, VAL, and POCWhat it is
A clean, on-chart volume profile that approximates your visible range using a configurable Bars Back window. It builds a horizontal histogram of volume by price, splits each price bin into Buy vs Sell volume, draws POC, and computes Value Area High/Low (VAH/VAL). A Stealth Mode toggle switches to a subtle grayscale palette for low-key charts.
Why this instead of the built-in VPVR?
Buy/Sell split per bin: See which prices were defended by buyers vs sellers, not just total volume.
Value Area from POC outward: Classic expansion method until the selected % of total volume (default 70%).
Sleek borders & Stealth Mode: Crisp bin outlines and a one-click professional colorway.
Deterministic & fast: No sessions or anchors needed—set your Bars Back and go.
How it works (under the hood)
Window selection – Pine can’t read your viewport, so we approximate it with Bars Back (user input).
Binning – The window’s price range is divided into N bins.
Volume allocation – For each bar in the window:
Distribute Across Hi–Lo (optional): Spread volume across all bins the bar overlaps, weighted by overlap; or
Single-price mode: Assign all volume to one bin using a representative price (hlc3).
Buy/Sell split (two methods):
Body Proportional (recommended): Split by relative up/down body size (|close−open|).
Up/Down Candle: 100% buy if close ≥ open, else 100% sell.
POC & VA: Point of Control is the bin with max total volume. VAH/VAL expands from POC toward the higher-volume neighbor until the selected % of total volume is included.
Reading the visuals
Horizontal bars (right side): Total volume per price bin.
Left sub-segment = Sell volume
Right sub-segment = Buy volume
POC line: Price level with peak total volume.
VAH / VAL (dashed): Upper and lower bounds of the selected Value Area.
Borders: Each bin has a clean outer outline so the profile looks tight and organized.
Stealth Mode: Grayscale palette that preserves contrast without loud colors.
Key inputs (organized for clarity)
Theme
Stealth Mode: Toggles the grayscale look.
Core
Price Bins: Vertical resolution of the profile.
Lookback (Bars): Approximates your visible range.
Style
Profile Width (bars): How far the histogram extends to the right.
Bin Border Width: Outline thickness.
Markers & Lines
Show POC, Show VAH/VAL, Value Area %, VA line width.
Advanced
Distribute Volume Across Hi–Lo: More accurate, heavier compute.
Buy/Sell Split Method: Body Proportional (realistic) or Up/Down (simple).
Tips & best practices
Start with Body Proportional + Distribute Across ON for intraday accuracy.
If the chart lags, reduce Price Bins or Bars Back, or switch off distribution.
For small windows, fewer bins often looks cleaner (e.g., 30–60).
Stealth Mode plays nicely with both dark and light chart themes.
Limitations & notes
Viewport: Pine can’t access the actual visible bars; Bars Back is a practical stand-in.
Buy/Sell split: This is an approximation from candle bodies, not true bid/ask delta.
Designed for overlay; profile renders to the right of the latest bar.

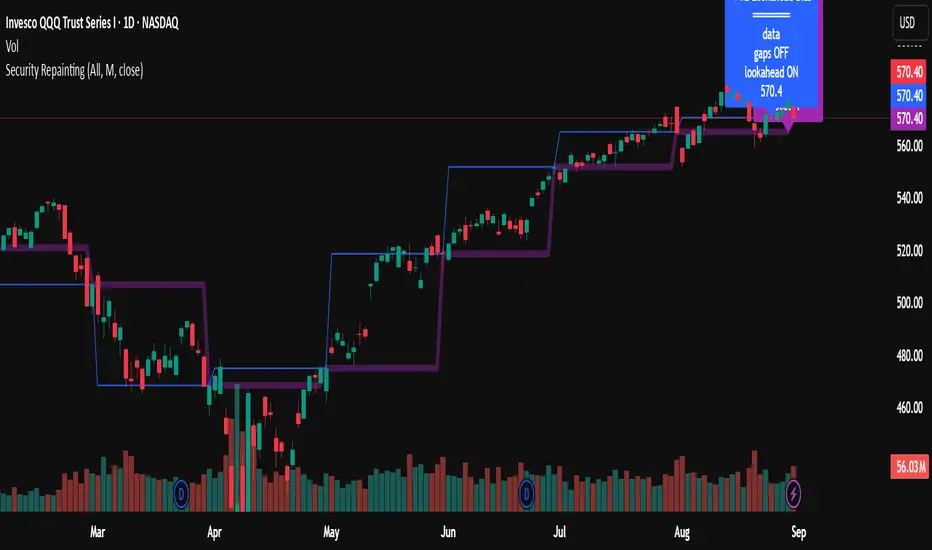
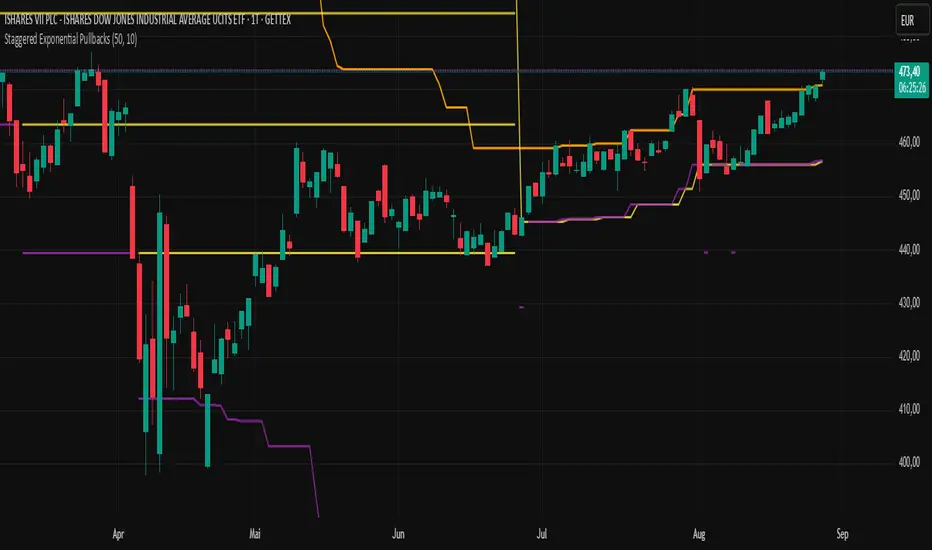
Staggered Exponential PullbacksIndicator Description: Staggered Exponential Pullbacks (Final)
Core Concept
This indicator is designed to dynamically track and visualize price pullbacks from a recent high. It serves as an intelligent alert system and a tool for visualizing potential support levels that follow a predefined, non-linear logic.
Instead of a fixed percentage interval, the indicator calculates the levels based on a fixed, exponentially increasing sequence of percentages. The distance between the levels increases as the price falls further. This models a strategy where larger price movements are tolerated as a pullback deepens before the next signal level is reached. The basis for this calculation is always the highest close of the last x candles.
Key Features
This indicator goes far beyond a simple calculation, offering a range of intelligent features for professional use:
Cascading, Fixed Levels: The levels are based on a fixed sequence of percentage distances (3.0%, 3.6%, 4.3%, etc.), where each new level is calculated from the previous level.
Persistent Support Levels ("Floors"): Once an alert level is breached, it transforms into a fixed support line ("floor"). This line will never move down, even if the market high subsequently drops.
Automatic Upward Adjustment: Established floors are automatically pulled upwards when the market shows new strength and makes higher highs. A once-reached -3% floor will therefore rise with the market.
Intelligent, Self-Cleaning Reset Logic: The indicator recognizes when a pullback sequence has ended and a new one has begun. "Ghost lines" from old, irrelevant price movements are automatically removed from the chart to ensure maximum clarity.
Cascade-Proof Alerts: Even during extremely fast sell-offs that break through multiple levels in a single candle, the indicator correctly captures every single level breach.
Customizable Visualization: All key parameters, such as the lookback period and the colors of the lines, can be easily adjusted in the settings.
Visual Elements on the Chart
The Orange Line (Highest Close): This is the reference line. It always shows the highest closing price within the defined lookback period and has a step-line shape.
The 'Floor' Lines (Default: Yellow): These are solid lines that indicate which percentage levels have already been breached in the current sequence. They function as established support levels.
The 'Next Due' Line (Default: Purple): This is a step-line that displays the next expected alert level. It moves dynamically with the calculation. As soon as the price crosses this line, an alert is triggered, and it transforms into a yellow "Floor" line.
Settings (Inputs)
Number of Candles (Lookback): Defines how many past candles are used to determine the highest closing price.
Displayed Alert Levels (Max 10): Determines the maximum number of levels the indicator will calculate and display.
Color of Floors: Allows you to freely choose the color for the solid, established support lines.
Color of Next Due Line: Allows you to freely choose the color for the next, untriggered alert line.
Setting Up Alerts (Important!)
Since the indicator uses dynamic alert messages, the alert must be set up as follows:
Add the indicator to the chart.
Click the clock icon ("Alert") in the top toolbar.
In the "Condition" field, select the name of this indicator: Staggered Exponential Pullbacks.
In the second dropdown menu, you must select the option "Any alert() function call".
Message: The message box can be left empty. The indicator automatically generates a detailed message (e.g., "Price Alert: Level 2 (3.6%) reached!").
Click "Create".
You only need one single alert to cover all 10 levels.
Important Disclaimer: Not Financial Advice
This indicator is purely a technical analysis tool for visualizing price movements. The displayed lines and triggered alerts do not constitute buy or sell recommendations and are not a form of financial or investment advice. They serve for informational and analytical purposes only.
Trading decisions based on the information from this indicator are made solely at your own risk and responsibility. The author and developer of this script assume no liability for any trading losses. Always conduct your own comprehensive analysis and, if necessary, consult a qualified financial advisor before making any trading decisions.

FibonacciRetracementHi all!
This library will help you draw Fibonacci retracement levels (zones). The code is from my indicator "Fibonacci retracement" (). You can see that description for more information about the behaviour and example of how to use this library. The code is almost the same with the addition of alerts. If the alert frequency is 'alert.freq_once_per_bar_close' alert messages will be concatenated and have a header saying how many messages it contains (if it's more than 1).
Hope this is of help!
Library "FibonacciRetracement"
ConcateAlerts(context)
Concatenates all alerts from the bar to one string (separated by new lines) and clears alert messages on the current bar.
Parameters:
context (Context)
AddAlert(context, message, unshiftInsteadOfPush)
Parameters:
context (Context)
message (string)
unshiftInsteadOfPush (bool)
Range(context, structure, settings)
Will return values if new levels/zones should be drawn.
Parameters:
context (Context) : The 'Context' for the Fibonacci retracement.
structure (Structure type from mickes/PriceAction/1) : The current 'Structure' from the 'MarketStructure' library.
settings (Settings) : The 'Settings' object for the 'Context'.
Returns: A tuple with the start and end pivot if new zones should be drawn, ' ' otherwise.
DrawAll(context, settings, start, end)
Draws lines and labels for the zone. It will also set the 'Price' value that will be used for absolute positions.
Parameters:
context (Context) : The 'Context' for the Fibonacci retracement.
settings (Settings) : The 'Settings' object for the 'Context'.
start (Pivot type from mickes/PriceAction/1)
end (Pivot type from mickes/PriceAction/1)
AlertActive(context, settings)
Will alert for all zones that are active. If multiple alert messages are added they will be concatenated (separated by a new line) with a header saying how many messages the alert contains.
Parameters:
context (Context) : The 'Context' for the Fibonacci retracement. This contains the zones that will be alerted if price (wick or close according to the settings) enters it.
settings (Settings) : The 'Settings' object for the 'Context'.
TrendlineSettings
Holds all the values for 'TrendlineSettings'.
Fields:
Enabled (series bool) : If the trendline should be visible or not.
Color (series color) : The color of the trendline.
Style (series string) : The style of the trendline (as a string).
GenericZonesSettings
Holds all the values for 'GenericZonesSettings', that will be applicable to all drawn objects.
Fields:
ExtendRight (series bool) : If all lines should extend to the right or not.
Style (series string) : The style of all drawn lines
Reverse (series bool) : If true, all lines will be reversed.
Prices (series bool) : If price levels should be shown or not.
Levels (series bool) : If levels should be shown or not.
LevelsValue (series string) : Either 'Value' or 'Percent'. Defined if value or percentage should be shown.
FontSize (series int) : The for size of the text in labels drawn.
LabelsPosition (series string) : Coul be 'Left', 'Rigth' or 'Adapt'. 'Adapt' will try to adapt the labels position to the prices.
ZoneSettings
Holds all the values for 'ZoneSettings'.
Fields:
Enabled (series bool) : If this zone is enabled or not.
Level (series float) : The level of the zone.
Color (series color) : The color that will be displayed.
Price (series float) : The price of the level. Will be set internally.
Settings
Holds all the values for 'Settings'.
Fields:
PivotLeftLength (series int) : The left length used to find pivots through the 'MarketStructure' library.
PivotRightLength (series int) : The right length used to find pivots through the 'MarketStructure' library.
Trendline (TrendlineSettings) : The settings for the 'Trendline' object.
GenericZonesSettings (GenericZonesSettings) : The setting applicable to all zones.
AlertFrequency (series string) : The frequency for the alerts. If 'alert.freq_once_per_bar_close', alert messages will be concatenated and have a header saying how many messages it contains (if it's more than 1).
AlertPrice (series string) : The price that has to enter a zone. Can be 'Close' (the closing price) or 'Wick' (the whole candle needs to be in the zone).
Zone1 (ZoneSettings) : The 'ZoneSettings' that represents this zone.
Zone2 (ZoneSettings) : The 'ZoneSettings' that represents this zone.
Zone3 (ZoneSettings) : The 'ZoneSettings' that represents this zone.
Zone4 (ZoneSettings) : The 'ZoneSettings' that represents this zone.
Zone5 (ZoneSettings) : The 'ZoneSettings' that represents this zone.
Zone6 (ZoneSettings) : The 'ZoneSettings' that represents this zone.
Zone7 (ZoneSettings) : The 'ZoneSettings' that represents this zone.
Zone8 (ZoneSettings) : The 'ZoneSettings' that represents this zone.
Zone9 (ZoneSettings) : The 'ZoneSettings' that represents this zone.
Zone10 (ZoneSettings) : The 'ZoneSettings' that represents this zone.
Zone11 (ZoneSettings) : The 'ZoneSettings' that represents this zone.
Zone12 (ZoneSettings) : The 'ZoneSettings' that represents this zone.
Zone13 (ZoneSettings) : The 'ZoneSettings' that represents this zone.
Zone14 (ZoneSettings) : The 'ZoneSettings' that represents this zone.
Zone15 (ZoneSettings) : The 'ZoneSettings' that represents this zone.
Zone16 (ZoneSettings) : The 'ZoneSettings' that represents this zone.
Zone17 (ZoneSettings) : The 'ZoneSettings' that represents this zone.
Zone18 (ZoneSettings) : The 'ZoneSettings' that represents this zone.
Zone19 (ZoneSettings) : The 'ZoneSettings' that represents this zone.
Zone20 (ZoneSettings) : The 'ZoneSettings' that represents this zone.
Zone21 (ZoneSettings) : The 'ZoneSettings' that represents this zone.
Zone22 (ZoneSettings) : The 'ZoneSettings' that represents this zone.
Zone23 (ZoneSettings) : The 'ZoneSettings' that represents this zone.
Zone24 (ZoneSettings) : The 'ZoneSettings' that represents this zone.
Context
Holds all the values for 'Context'.
Fields:
Lines (array) : All the drawn lines for the current 'Context'.
Labels (array) : All the drawn labels for the current 'Context'.
Boxes (array) : All the drawn boxes for the current 'Context'.
Alerts (array) : All the alert messages on the current tick.
Start (series int) : The start bar index of the current 'Context'.

Objective Doji Highlight (Range-Relative)This indicator highlights Doji candles using an objective, mathematics-based rule: a bar is Doji when the absolute difference between its open and close is less than or equal to a user-defined fraction (x) of that bar’s high–low range.
How it works:
Compute body size as the absolute difference between open and close.
Compute the bar’s range as high minus low.
Classify as Doji when body size ≤ x × range.
Only Doji candles are colored; non-Doji bars remain unchanged.
Inputs
Doji threshold (x of range): tolerance (0–1) controlling how small the body must be relative to the range.
Doji Candle Color: visual color for detected Doji candles.
Example:
If x = 0.10 and a candle has high = 100 and low = 90 (range = 10), the maximum allowed body is 1.
If the difference between open and close is ≤ 1, the candle is marked as Doji.
Why it can be useful
Doji candles are often studied as signs of market indecision. This tool provides a clear, parameter-based way to identify them consistently across any timeframe, without discretionary interpretation.
Notes & limitations
Works with standard candlesticks (not Heikin Ashi, Renko, or other synthetic bar types).
Visualization and research only: it does not produce buy/sell signals and makes no performance claims.
No repainting from future data; the logic uses only the current bar’s prices.

PriceActionLibrary "PriceAction"
Hi all!
This library will help you to plot the market structure and liquidity. By now, the only part in the price action section is liquidity, but I plan to add more later on. The market structure will be split into two parts, 'Internal' and 'Swing' with separate pivot lengths. For these two trends it will show you:
• Break of structure (BOS)
• Change of character (CHoCH/CHoCH+) (mandatory)
• Equal high/low (EQH/EQL)
It's inspired by "Smart Money Concepts (SMC) " by LuxAlgo.
This library is now the same code as the code in my library 'MarketStructure', but it has evolved into a more price action oriented library than just a market structure library. This is more accurate and I will continue working on this library to keep it growing.
This code does not provide any examples, but you can look at my indicators 'Market structure' () and 'Order blocks' (), where I use the 'MarketStructure' library (which is the same code).
Market structure
Both of these market structures can be enabled/disabled by setting them to 'na'. The pivots lengths can be configured separately. The pivots found will be the 'base' of and will show you when price breaks it. When that happens a break of structure or a change of character will be created. The latest 5 pivots found within the current trends will be kept to take action on. They are cleared on a change of character, so nothing (break of structures or change of characters) can happen on pivots before a trend change. The internal market structure is shown with dashed lines and swing market structure is shown with solid lines.
Labels for a change of character can have either the text 'CHoCH' or 'CHoCH+'. A Change of Character plus is formed when price fails to form a higher high or a lower low before reversing. Note that a pivot that is created after the change of character might have a higher high or a lower low, thus not making the break a 'CHoCH+'. This is not changed after the pivot is found but is kept as is.
A break of structure is removed if an earlier pivot within the same trend is broken, i.e. another break of structure (with a longer distance) is created. Like in the images below, the first pivot (in the first image) is removed when an earlier pivot's higher price within the same trend is broken (the second image):
[image [https://www.tradingview.com/x/PRP6YtPA/
Equal high/lows have a configurable color setting and can be configured to be extended to the right. Equal high/lows are only possible if it's not been broken by price. A factor (percentage of width) of the Average True Length (of length 14) that the pivot must be within to to be considered an Equal high/low. Equal highs/lows can be of 2 pivots or more.
You are able to show the pivots that are used. "HH" (higher high), "HL" (higher low), "LH" (lower high), "LL" (lower low) and "H"/"L" (for pivots (high/low) when the trend has changed) are the labels used. There are also labels for break of structures ('BOS') and change of characters ('CHoCH' or 'CHoCH+'). The size of these texts is set in the 'FontSize' setting.
When programming I focused on simplicity and ease of read. I did not focus on performance, I will do so if it's a problem (haven't noticed it is one yet).
You can set alerts for when a change of character, break of structure or an equal high/low (new or an addition to a previously found) happens. The alerts that are fired are on 'once_per_bar_close' to avoid repainting. This has the drawback to alert you when the bar closes.
Price action
The indicator will create lines and zones for spotted liquidity. It will draw a line (with dotted style) at the price level that was liquidated, but it will also draw a zone from that level to the bar that broke the pivot high or low price. If that zone is large the liquidation is big and might be significant. This can be disabled in the settings. You can also change the confirmation candles (that does not close above or below the pivot level) needed after a liquidation and how many pivots back to look at.
The lines and boxes drawn will look like this if the color is orange:
Hope this is of help!
Will draw out the market structure for the disired pivot length.
Liqudity(liquidity)
Will draw liquidity.
Parameters:
liquidity (Liquidity) : The 'PriceAction.Liquidity' object.
Pivot(structure)
Sets the pivots in the structure.
Parameters:
structure (Structure)
PivotLabels(structure)
Draws labels for the pivots found.
Parameters:
structure (Structure)
EqualHighOrLow(structure)
Draws the boxes for equal highs/lows. Also creates labels for the pivots included.
Parameters:
structure (Structure)
BreakOfStructure(structure)
Will create lines when a break of strycture occures.
Parameters:
structure (Structure)
Returns: A boolean that represents if a break of structure was found or not.
ChangeOfCharacter(structure)
Will create lines when a change of character occures. This line will have a label with "CHoCH" or "CHoCH+".
Parameters:
structure (Structure)
Returns: A boolean that represents if a change of character was found or not.
VisualizeCurrent(structure)
Will create a box with a background for between the latest high and low pivots. This can be used as the current trading range (if the pivots broke strucure somehow).
Parameters:
structure (Structure)
StructureBreak
Holds drawings for a structure break.
Fields:
Line (series line) : The line object.
Label (series label) : The label object.
Pivot
Holds all the values for a found pivot.
Fields:
Price (series float) : The price of the pivot.
BarIndex (series int) : The bar_index where the pivot occured.
Type (series int) : The type of the pivot (-1 = low, 1 = high).
Time (series int) : The time where the pivot occured.
BreakOfStructureBroken (series bool) : Sets to true if a break of structure has happened.
LiquidityBroken (series bool) : Sets to true if a liquidity of the price level has happened.
ChangeOfCharacterBroken (series bool) : Sets to true if a change of character has happened.
Structure
Holds all the values for the market structure.
Fields:
LeftLength (series int) : Define the left length of the pivots used.
RightLength (series int) : Define the right length of the pivots used.
Type (series Type) : Set the type of the market structure. Two types can be used, 'internal' and 'swing' (0 = internal, 1 = swing).
Trend (series int) : This will be set internally and can be -1 = downtrend, 1 = uptrend.
EqualPivotsFactor (series float) : Set how the limits are for an equal pivot. This is a factor of the Average True Length (ATR) of length 14. If a low pivot is considered to be equal if it doesn't break the low pivot (is at a lower value) and is inside the previous low pivot + this limit.
ExtendEqualPivotsZones (series bool) : Set to true if you want the equal pivots zones to be extended.
ExtendEqualPivotsStyle (series string) : Set the style of equal pivot zones.
ExtendEqualPivotsColor (series color) : Set the color of equal pivot zones.
EqualHighs (array) : Holds the boxes for zones that contains equal highs.
EqualLows (array) : Holds the boxes for zones that contains equal lows.
BreakOfStructures (array) : Holds all the break of structures within the trend (before a change of character).
Pivots (array) : All the pivots in the current trend, added with the latest first, this is cleared when the trend changes.
FontSize (series int) : Holds the size of the font displayed.
AlertChangeOfCharacter (series bool) : Holds true or false if a change of character should be alerted or not.
AlertBreakOfStructure (series bool) : Holds true or false if a break of structure should be alerted or not.
AlerEqualPivots (series bool) : Holds true or false if equal highs/lows should be alerted or not.
Liquidity
Holds all the values for liquidity.
Fields:
LiquidityPivotsHigh (array) : All high pivots for liquidity.
LiquidityPivotsLow (array) : All low pivots for liquidity.
LiquidityConfirmationBars (series int) : The number of bars to confirm that a liquidity is valid.
LiquidityPivotsLookback (series int) : A number of pivots to look back for.
FontSize (series int) : Holds the size of the font displayed.
PriceAction
Holds all the values for the general price action and the market structures.
Fields:
Liquidity (Liquidity)
Swing (Structure) : Placeholder for all objects used for the swing market structure.
Internal (Structure) : Placeholder for all objects used for the internal market structure.

GoldenCrossLibrary "GoldenCross"
get_signals(short_len, long_len)
Parameters:
short_len (int)
long_len (int)