Bar Index & TimeLibrary to convert a bar index to a timestamp and vice versa.
Utilizes runtime memory to store the 𝚝𝚒𝚖𝚎 and 𝚝𝚒𝚖𝚎_𝚌𝚕𝚘𝚜𝚎 values of every bar on the chart (and optional future bars), with the ability of storing additional custom values for every chart bar.
█ PREFACE
This library aims to tackle some problems that pine coders (from beginners to advanced) often come across, such as:
I'm trying to draw an object with a 𝚋𝚊𝚛_𝚒𝚗𝚍𝚎𝚡 that is more than 10,000 bars into the past, but this causes my script to fail. How can I convert the 𝚋𝚊𝚛_𝚒𝚗𝚍𝚎𝚡 to a UNIX time so that I can draw visuals using xloc.bar_time ?
I have a diagonal line drawing and I want to get the "y" value at a specific time, but line.get_price() only accepts a bar index value. How can I convert the timestamp into a bar index value so that I can still use this function?
I want to get a previous 𝚘𝚙𝚎𝚗 value that occurred at a specific timestamp. How can I convert the timestamp into a historical offset so that I can use 𝚘𝚙𝚎𝚗 ?
I want to reference a very old value for a variable. How can I access a previous value that is older than the maximum historical buffer size of 𝚟𝚊𝚛𝚒𝚊𝚋𝚕𝚎 ?
This library can solve the above problems (and many more) with the addition of a few lines of code, rather than requiring the coder to refactor their script to accommodate the limitations.
█ OVERVIEW
The core functionality provided is conversion between xloc.bar_index and xloc.bar_time values.
The main component of the library is the 𝙲𝚑𝚊𝚛𝚝𝙳𝚊𝚝𝚊 object, created via the 𝚌𝚘𝚕𝚕𝚎𝚌𝚝𝙲𝚑𝚊𝚛𝚝𝙳𝚊𝚝𝚊() function which basically stores the 𝚝𝚒𝚖𝚎 and 𝚝𝚒𝚖𝚎_𝚌𝚕𝚘𝚜𝚎 of every bar on the chart, and there are 3 more overloads to this function that allow collecting and storing additional data. Once a 𝙲𝚑𝚊𝚛𝚝𝙳𝚊𝚝𝚊 object is created, use any of the exported methods:
Methods to convert a UNIX timestamp into a bar index or bar offset:
𝚝𝚒𝚖𝚎𝚜𝚝𝚊𝚖𝚙𝚃𝚘𝙱𝚊𝚛𝙸𝚗𝚍𝚎𝚡(), 𝚐𝚎𝚝𝙽𝚞𝚖𝚋𝚎𝚛𝙾𝚏𝙱𝚊𝚛𝚜𝙱𝚊𝚌𝚔()
Methods to retrieve the stored data for a bar index:
𝚝𝚒𝚖𝚎𝙰𝚝𝙱𝚊𝚛𝙸𝚗𝚍𝚎𝚡(), 𝚝𝚒𝚖𝚎𝙲𝚕𝚘𝚜𝚎𝙰𝚝𝙱𝚊𝚛𝙸𝚗𝚍𝚎𝚡(), 𝚟𝚊𝚕𝚞𝚎𝙰𝚝𝙱𝚊𝚛𝙸𝚗𝚍𝚎𝚡(), 𝚐𝚎𝚝𝙰𝚕𝚕𝚅𝚊𝚛𝚒𝚊𝚋𝚕𝚎𝚜𝙰𝚝𝙱𝚊𝚛𝙸𝚗𝚍𝚎𝚡()
Methods to retrieve the stored data at a number of bars back (i.e., historical offset):
𝚝𝚒𝚖𝚎(), 𝚝𝚒𝚖𝚎𝙲𝚕𝚘𝚜𝚎(), 𝚟𝚊𝚕𝚞𝚎()
Methods to retrieve all the data points from the earliest bar (or latest bar) stored in memory, which can be useful for debugging purposes:
𝚐𝚎𝚝𝙴𝚊𝚛𝚕𝚒𝚎𝚜𝚝𝚂𝚝𝚘𝚛𝚎𝚍𝙳𝚊𝚝𝚊(), 𝚐𝚎𝚝𝙻𝚊𝚝𝚎𝚜𝚝𝚂𝚝𝚘𝚛𝚎𝚍𝙳𝚊𝚝𝚊()
Note: the library's strong suit is referencing data from very old bars in the past, which is especially useful for scripts that perform its necessary calculations only on the last bar.
█ USAGE
Step 1
Import the library. Replace with the latest available version number for this library.
//@version=6
indicator("Usage")
import n00btraders/ChartData/
Step 2
Create a 𝙲𝚑𝚊𝚛𝚝𝙳𝚊𝚝𝚊 object to collect data on every bar. Do not declare as `var` or `varip`.
chartData = ChartData.collectChartData() // call on every bar to accumulate the necessary data
Step 3
Call any method(s) on the 𝙲𝚑𝚊𝚛𝚝𝙳𝚊𝚝𝚊 object. Do not modify its fields directly.
if barstate.islast
int firstBarTime = chartData.timeAtBarIndex(0)
int lastBarTime = chartData.time(0)
log.info("First `time`: " + str.format_time(firstBarTime) + ", Last `time`: " + str.format_time(lastBarTime))
█ EXAMPLES
• Collect Future Times
The overloaded 𝚌𝚘𝚕𝚕𝚎𝚌𝚝𝙲𝚑𝚊𝚛𝚝𝙳𝚊𝚝𝚊() functions that accept a 𝚋𝚊𝚛𝚜𝙵𝚘𝚛𝚠𝚊𝚛𝚍 argument can additionally store time values for up to 500 bars into the future.
//@version=6
indicator("Example `collectChartData(barsForward)`")
import n00btraders/ChartData/1
chartData = ChartData.collectChartData(barsForward = 500)
var rectangle = box.new(na, na, na, na, xloc = xloc.bar_time, force_overlay = true)
if barstate.islast
int futureTime = chartData.timeAtBarIndex(bar_index + 100)
int lastBarTime = time
box.set_lefttop(rectangle, lastBarTime, open)
box.set_rightbottom(rectangle, futureTime, close)
box.set_text(rectangle, "Extending box 100 bars to the right. Time: " + str.format_time(futureTime))
• Collect Custom Data
The overloaded 𝚌𝚘𝚕𝚕𝚎𝚌𝚝𝙲𝚑𝚊𝚛𝚝𝙳𝚊𝚝𝚊() functions that accept a 𝚟𝚊𝚛𝚒𝚊𝚋𝚕𝚎𝚜 argument can additionally store custom user-specified values for every bar on the chart.
//@version=6
indicator("Example `collectChartData(variables)`")
import n00btraders/ChartData/1
var map variables = map.new()
variables.put("open", open)
variables.put("close", close)
variables.put("open-close midpoint", (open + close) / 2)
variables.put("boolean", open > close ? 1 : 0)
chartData = ChartData.collectChartData(variables = variables)
var fgColor = chart.fg_color
var table1 = table.new(position.top_right, 2, 9, color(na), fgColor, 1, fgColor, 1, true)
var table2 = table.new(position.bottom_right, 2, 9, color(na), fgColor, 1, fgColor, 1, true)
if barstate.isfirst
table.cell(table1, 0, 0, "ChartData.value()", text_color = fgColor)
table.cell(table2, 0, 0, "open ", text_color = fgColor)
table.merge_cells(table1, 0, 0, 1, 0)
table.merge_cells(table2, 0, 0, 1, 0)
for i = 1 to 8
table.cell(table1, 0, i, text_color = fgColor, text_halign = text.align_left, text_font_family = font.family_monospace)
table.cell(table2, 0, i, text_color = fgColor, text_halign = text.align_left, text_font_family = font.family_monospace)
table.cell(table1, 1, i, text_color = fgColor)
table.cell(table2, 1, i, text_color = fgColor)
if barstate.islast
for i = 1 to 8
float open1 = chartData.value("open", 5000 * i)
float open2 = i < 3 ? open : -1
table.cell_set_text(table1, 0, i, "chartData.value(\"open\", " + str.tostring(5000 * i) + "): ")
table.cell_set_text(table2, 0, i, "open : ")
table.cell_set_text(table1, 1, i, str.tostring(open1))
table.cell_set_text(table2, 1, i, open2 >= 0 ? str.tostring(open2) : "Error")
• xloc.bar_index → xloc.bar_time
The 𝚝𝚒𝚖𝚎 value (or 𝚝𝚒𝚖𝚎_𝚌𝚕𝚘𝚜𝚎 value) can be retrieved for any bar index that is stored in memory by the 𝙲𝚑𝚊𝚛𝚝𝙳𝚊𝚝𝚊 object.
//@version=6
indicator("Example `timeAtBarIndex()`")
import n00btraders/ChartData/1
chartData = ChartData.collectChartData()
if barstate.islast
int start = bar_index - 15000
int end = bar_index - 100
// line.new(start, close, end, close) // !ERROR - `start` value is too far from current bar index
start := chartData.timeAtBarIndex(start)
end := chartData.timeAtBarIndex(end)
line.new(start, close, end, close, xloc.bar_time, width = 10)
• xloc.bar_time → xloc.bar_index
Use 𝚝𝚒𝚖𝚎𝚜𝚝𝚊𝚖𝚙𝚃𝚘𝙱𝚊𝚛𝙸𝚗𝚍𝚎𝚡() to find the bar that a timestamp belongs to.
If the timestamp falls in between the close of one bar and the open of the next bar,
the 𝚜𝚗𝚊𝚙 parameter can be used to determine which bar to choose:
𝚂𝚗𝚊𝚙.𝙻𝙴𝙵𝚃 - prefer to choose the leftmost bar (typically used for closing times)
𝚂𝚗𝚊𝚙.𝚁𝙸𝙶𝙷𝚃 - prefer to choose the rightmost bar (typically used for opening times)
𝚂𝚗𝚊𝚙.𝙳𝙴𝙵𝙰𝚄𝙻𝚃 (or 𝚗𝚊) - copies the same behavior as xloc.bar_time uses for drawing objects
//@version=6
indicator("Example `timestampToBarIndex()`")
import n00btraders/ChartData/1
startTimeInput = input.time(timestamp("01 Aug 2025 08:30 -0500"), "Session Start Time")
endTimeInput = input.time(timestamp("01 Aug 2025 15:15 -0500"), "Session End Time")
chartData = ChartData.collectChartData()
if barstate.islastconfirmedhistory
int startBarIndex = chartData.timestampToBarIndex(startTimeInput, ChartData.Snap.RIGHT)
int endBarIndex = chartData.timestampToBarIndex(endTimeInput, ChartData.Snap.LEFT)
line1 = line.new(startBarIndex, 0, startBarIndex, 1, extend = extend.both, color = color.new(color.green, 60), force_overlay = true)
line2 = line.new(endBarIndex, 0, endBarIndex, 1, extend = extend.both, color = color.new(color.green, 60), force_overlay = true)
linefill.new(line1, line2, color.new(color.green, 90))
// using Snap.DEFAULT to show that it is equivalent to drawing lines using `xloc.bar_time` (i.e., it aligns to the same bars)
startBarIndex := chartData.timestampToBarIndex(startTimeInput)
endBarIndex := chartData.timestampToBarIndex(endTimeInput)
line.new(startBarIndex, 0, startBarIndex, 1, extend = extend.both, color = color.yellow, width = 3)
line.new(endBarIndex, 0, endBarIndex, 1, extend = extend.both, color = color.yellow, width = 3)
line.new(startTimeInput, 0, startTimeInput, 1, xloc.bar_time, extend.both, color.new(color.blue, 85), width = 11)
line.new(endTimeInput, 0, endTimeInput, 1, xloc.bar_time, extend.both, color.new(color.blue, 85), width = 11)
• Get Price of Line at Timestamp
The pine script built-in function line.get_price() requires working with bar index values. To get the price of a line in terms of a timestamp, convert the timestamp into a bar index or offset.
//@version=6
indicator("Example `line.get_price()` at timestamp")
import n00btraders/ChartData/1
lineStartInput = input.time(timestamp("01 Aug 2025 08:30 -0500"), "Line Start")
chartData = ChartData.collectChartData()
var diagonal = line.new(na, na, na, na, force_overlay = true)
if time <= lineStartInput
line.set_xy1(diagonal, bar_index, open)
if barstate.islastconfirmedhistory
line.set_xy2(diagonal, bar_index, close)
if barstate.islast
int timeOneWeekAgo = timenow - (7 * timeframe.in_seconds("1D") * 1000)
// Note: could also use `timetampToBarIndex(timeOneWeekAgo, Snap.DEFAULT)` and pass the value directly to `line.get_price()`
int barsOneWeekAgo = chartData.getNumberOfBarsBack(timeOneWeekAgo)
float price = line.get_price(diagonal, bar_index - barsOneWeekAgo)
string formatString = "Time 1 week ago: {0,number,#}\n - Equivalent to {1} bars ago\n\n𝚕𝚒𝚗𝚎.𝚐𝚎𝚝_𝚙𝚛𝚒𝚌𝚎(): {2,number,#.##}"
string labelText = str.format(formatString, timeOneWeekAgo, barsOneWeekAgo, price)
label.new(timeOneWeekAgo, price, labelText, xloc.bar_time, style = label.style_label_lower_right, size = 16, textalign = text.align_left, force_overlay = true)
█ RUNTIME ERROR MESSAGES
This library's functions will generate a custom runtime error message in the following cases:
𝚌𝚘𝚕𝚕𝚎𝚌𝚝𝙲𝚑𝚊𝚛𝚝𝙳𝚊𝚝𝚊() is not called consecutively, or is called more than once on a single bar
Invalid 𝚋𝚊𝚛𝚜𝙵𝚘𝚛𝚠𝚊𝚛𝚍 argument in the 𝚌𝚘𝚕𝚕𝚎𝚌𝚝𝙲𝚑𝚊𝚛𝚝𝙳𝚊𝚝𝚊() function
Invalid 𝚟𝚊𝚛𝚒𝚊𝚋𝚕𝚎𝚜 argument in the 𝚌𝚘𝚕𝚕𝚎𝚌𝚝𝙲𝚑𝚊𝚛𝚝𝙳𝚊𝚝𝚊() function
Invalid 𝚕𝚎𝚗𝚐𝚝𝚑 argument in any of the functions that accept a number of bars back
Note: there is no runtime error generated for an invalid 𝚝𝚒𝚖𝚎𝚜𝚝𝚊𝚖𝚙 or 𝚋𝚊𝚛𝙸𝚗𝚍𝚎𝚡 argument in any of the functions. Instead, the functions will assign 𝚗𝚊 to the returned values.
Any other runtime errors are due to incorrect usage of the library.
█ NOTES
• Function Descriptions
The library source code uses Markdown for the exported functions. Hover over a function/method call in the Pine Editor to display formatted, detailed information about the function/method.
//@version=6
indicator("Demo Function Tooltip")
import n00btraders/ChartData/1
chartData = ChartData.collectChartData()
int barIndex = chartData.timestampToBarIndex(timenow)
log.info(str.tostring(barIndex))
• Historical vs. Realtime Behavior
Under the hood, the data collector for this library is declared as `var`. Because of this, the 𝙲𝚑𝚊𝚛𝚝𝙳𝚊𝚝𝚊 object will always reflect the latest available data on realtime updates. Any data that is recorded for historical bars will remain unchanged throughout the execution of a script.
//@version=6
indicator("Demo Realtime Behavior")
import n00btraders/ChartData/1
var map variables = map.new()
variables.put("open", open)
variables.put("close", close)
chartData = ChartData.collectChartData(variables)
if barstate.isrealtime
varip float initialOpen = open
varip float initialClose = close
varip int updateCount = 0
updateCount += 1
float latestOpen = open
float latestClose = close
float recordedOpen = chartData.valueAtBarIndex("open", bar_index)
float recordedClose = chartData.valueAtBarIndex("close", bar_index)
string formatString = "# of updates: {0}\n\n𝚘𝚙𝚎𝚗 at update #1: {1,number,#.##}\n𝚌𝚕𝚘𝚜𝚎 at update #1: {2,number,#.##}\n\n"
+ "𝚘𝚙𝚎𝚗 at update #{0}: {3,number,#.##}\n𝚌𝚕𝚘𝚜𝚎 at update #{0}: {4,number,#.##}\n\n"
+ "𝚘𝚙𝚎𝚗 stored in memory: {5,number,#.##}\n𝚌𝚕𝚘𝚜𝚎 stored in memory: {6,number,#.##}"
string labelText = str.format(formatString, updateCount, initialOpen, initialClose, latestOpen, latestClose, recordedOpen, recordedClose)
label.new(bar_index, close, labelText, style = label.style_label_left, force_overlay = true)
• Collecting Chart Data for Other Contexts
If your use case requires collecting chart data from another context, avoid directly retrieving the 𝙲𝚑𝚊𝚛𝚝𝙳𝚊𝚝𝚊 object as this may exceed memory limits .
//@version=6
indicator("Demo Return Calculated Results")
import n00btraders/ChartData/1
timeInput = input.time(timestamp("01 Sep 2025 08:30 -0500"), "Time")
var int oneMinuteBarsAgo = na
// !ERROR - Memory Limits Exceeded
// chartDataArray = request.security_lower_tf(syminfo.tickerid, "1", ChartData.collectChartData())
// oneMinuteBarsAgo := chartDataArray.last().getNumberOfBarsBack(timeInput)
// function that returns calculated results (a single integer value instead of an entire `ChartData` object)
getNumberOfBarsBack() =>
chartData = ChartData.collectChartData()
chartData.getNumberOfBarsBack(timeInput)
calculatedResultsArray = request.security_lower_tf(syminfo.tickerid, "1", getNumberOfBarsBack())
oneMinuteBarsAgo := calculatedResultsArray.size() > 0 ? calculatedResultsArray.last() : na
if barstate.islast
string labelText = str.format("The selected timestamp occurs 1-minute bars ago", oneMinuteBarsAgo)
label.new(bar_index, hl2, labelText, style = label.style_label_left, size = 16, force_overlay = true)
• Memory Usage
The library's convenience and ease of use comes at the cost of increased usage of computational resources. For simple scripts, using this library will likely not cause any issues with exceeding memory limits. But for large and complex scripts, you can reduce memory issues by specifying a lower 𝚌𝚊𝚕𝚌_𝚋𝚊𝚛𝚜_𝚌𝚘𝚞𝚗𝚝 amount in the indicator() or strategy() declaration statement.
//@version=6
// !ERROR - Memory Limits Exceeded using the default number of bars available (~20,000 bars for Premium plans)
//indicator("Demo `calc_bars_count` parameter")
// Reduce number of bars using `calc_bars_count` parameter
indicator("Demo `calc_bars_count` parameter", calc_bars_count = 15000)
import n00btraders/ChartData/1
map variables = map.new()
variables.put("open", open)
variables.put("close", close)
variables.put("weekofyear", weekofyear)
variables.put("dayofmonth", dayofmonth)
variables.put("hour", hour)
variables.put("minute", minute)
variables.put("second", second)
// simulate large memory usage
chartData0 = ChartData.collectChartData(variables)
chartData1 = ChartData.collectChartData(variables)
chartData2 = ChartData.collectChartData(variables)
chartData3 = ChartData.collectChartData(variables)
chartData4 = ChartData.collectChartData(variables)
chartData5 = ChartData.collectChartData(variables)
chartData6 = ChartData.collectChartData(variables)
chartData7 = ChartData.collectChartData(variables)
chartData8 = ChartData.collectChartData(variables)
chartData9 = ChartData.collectChartData(variables)
log.info(str.tostring(chartData0.time(0)))
log.info(str.tostring(chartData1.time(0)))
log.info(str.tostring(chartData2.time(0)))
log.info(str.tostring(chartData3.time(0)))
log.info(str.tostring(chartData4.time(0)))
log.info(str.tostring(chartData5.time(0)))
log.info(str.tostring(chartData6.time(0)))
log.info(str.tostring(chartData7.time(0)))
log.info(str.tostring(chartData8.time(0)))
log.info(str.tostring(chartData9.time(0)))
if barstate.islast
result = table.new(position.middle_right, 1, 1, force_overlay = true)
table.cell(result, 0, 0, "Script Execution Successful ✅", text_size = 40)
█ EXPORTED ENUMS
Snap
Behavior for determining the bar that a timestamp belongs to.
Fields:
LEFT : Snap to the leftmost bar.
RIGHT : Snap to the rightmost bar.
DEFAULT : Default `xloc.bar_time` behavior.
Note: this enum is used for the 𝚜𝚗𝚊𝚙 parameter of 𝚝𝚒𝚖𝚎𝚜𝚝𝚊𝚖𝚙𝚃𝚘𝙱𝚊𝚛𝙸𝚗𝚍𝚎𝚡().
█ EXPORTED TYPES
Note: users of the library do not need to worry about directly accessing the fields of these types; all computations are done through method calls on an object of the 𝙲𝚑𝚊𝚛𝚝𝙳𝚊𝚝𝚊 type.
Variable
Represents a user-specified variable that can be tracked on every chart bar.
Fields:
name (series string) : Unique identifier for the variable.
values (array) : The array of stored values (one value per chart bar).
ChartData
Represents data for all bars on a chart.
Fields:
bars (series int) : Current number of bars on the chart.
timeValues (array) : The `time` values of all chart (and future) bars.
timeCloseValues (array) : The `time_close` values of all chart (and future) bars.
variables (array) : Additional custom values to track on all chart bars.
█ EXPORTED FUNCTIONS
collectChartData()
Collects and tracks the `time` and `time_close` value of every bar on the chart.
Returns: `ChartData` object to convert between `xloc.bar_index` and `xloc.bar_time`.
collectChartData(barsForward)
Collects and tracks the `time` and `time_close` value of every bar on the chart as well as a specified number of future bars.
Parameters:
barsForward (simple int) : Number of future bars to collect data for.
Returns: `ChartData` object to convert between `xloc.bar_index` and `xloc.bar_time`.
collectChartData(variables)
Collects and tracks the `time` and `time_close` value of every bar on the chart. Additionally, tracks a custom set of variables for every chart bar.
Parameters:
variables (simple map) : Custom values to collect on every chart bar.
Returns: `ChartData` object to convert between `xloc.bar_index` and `xloc.bar_time`.
collectChartData(barsForward, variables)
Collects and tracks the `time` and `time_close` value of every bar on the chart as well as a specified number of future bars. Additionally, tracks a custom set of variables for every chart bar.
Parameters:
barsForward (simple int) : Number of future bars to collect data for.
variables (simple map) : Custom values to collect on every chart bar.
Returns: `ChartData` object to convert between `xloc.bar_index` and `xloc.bar_time`.
█ EXPORTED METHODS
method timestampToBarIndex(chartData, timestamp, snap)
Converts a UNIX timestamp to a bar index.
Namespace types: ChartData
Parameters:
chartData (series ChartData) : The `ChartData` object.
timestamp (series int) : A UNIX time.
snap (series Snap) : A `Snap` enum value.
Returns: A bar index, or `na` if unable to find the appropriate bar index.
method getNumberOfBarsBack(chartData, timestamp)
Converts a UNIX timestamp to a history-referencing length (i.e., number of bars back).
Namespace types: ChartData
Parameters:
chartData (series ChartData) : The `ChartData` object.
timestamp (series int) : A UNIX time.
Returns: A bar offset, or `na` if unable to find a valid number of bars back.
method timeAtBarIndex(chartData, barIndex)
Retrieves the `time` value for the specified bar index.
Namespace types: ChartData
Parameters:
chartData (series ChartData) : The `ChartData` object.
barIndex (int) : The bar index.
Returns: The `time` value, or `na` if there is no `time` stored for the bar index.
method time(chartData, length)
Retrieves the `time` value of the bar that is `length` bars back relative to the latest bar.
Namespace types: ChartData
Parameters:
chartData (series ChartData) : The `ChartData` object.
length (series int) : Number of bars back.
Returns: The `time` value `length` bars ago, or `na` if there is no `time` stored for that bar.
method timeCloseAtBarIndex(chartData, barIndex)
Retrieves the `time_close` value for the specified bar index.
Namespace types: ChartData
Parameters:
chartData (series ChartData) : The `ChartData` object.
barIndex (series int) : The bar index.
Returns: The `time_close` value, or `na` if there is no `time_close` stored for the bar index.
method timeClose(chartData, length)
Retrieves the `time_close` value of the bar that is `length` bars back from the latest bar.
Namespace types: ChartData
Parameters:
chartData (series ChartData) : The `ChartData` object.
length (series int) : Number of bars back.
Returns: The `time_close` value `length` bars ago, or `na` if there is none stored.
method valueAtBarIndex(chartData, name, barIndex)
Retrieves the value of a custom variable for the specified bar index.
Namespace types: ChartData
Parameters:
chartData (series ChartData) : The `ChartData` object.
name (series string) : The variable name.
barIndex (series int) : The bar index.
Returns: The value of the variable, or `na` if that variable is not stored for the bar index.
method value(chartData, name, length)
Retrieves a variable value of the bar that is `length` bars back relative to the latest bar.
Namespace types: ChartData
Parameters:
chartData (series ChartData) : The `ChartData` object.
name (series string) : The variable name.
length (series int) : Number of bars back.
Returns: The value `length` bars ago, or `na` if that variable is not stored for the bar index.
method getAllVariablesAtBarIndex(chartData, barIndex)
Retrieves all custom variables for the specified bar index.
Namespace types: ChartData
Parameters:
chartData (series ChartData) : The `ChartData` object.
barIndex (series int) : The bar index.
Returns: Map of all custom variables that are stored for the specified bar index.
method getEarliestStoredData(chartData)
Gets all values from the earliest bar data that is currently stored in memory.
Namespace types: ChartData
Parameters:
chartData (series ChartData) : The `ChartData` object.
Returns: A tuple:
method getLatestStoredData(chartData, futureData)
Gets all values from the latest bar data that is currently stored in memory.
Namespace types: ChartData
Parameters:
chartData (series ChartData) : The `ChartData` object.
futureData (series bool) : Whether to include the future data that is stored in memory.
Returns: A tuple:
在腳本中搜尋"用友网络+2025年5月5日+股价走势"

FNGAdataCloseClose prices for FNGA ETF (Dec 2018–May 2025)
The Close prices for FNGA ETF (December 2018 – May 2025) represent the final trading price recorded at the end of each regular U.S. market session (4:00 p.m. Eastern Time) over the entire lifespan of this leveraged exchange-traded note. Initially issued under the ticker FNGU and later rebranded as FNGA in March 2025 before its redemption in May 2025, the product was designed to provide 3x daily leveraged exposure to the MicroSectors FANG+™ Index, which tracks a concentrated group of large-cap technology and tech-enabled growth leaders such as Apple, Amazon, Meta (Facebook), Netflix, and Alphabet (Google).
Close prices are widely regarded as the most important reference point in market data because they establish the official end-of-day valuation of a security. For leveraged products like FNGA, the closing price is especially critical, since it directly determines the reset value for the following trading session. This daily compounding effect means that FNGA’s closing levels often diverged significantly from the long-term performance of its underlying index, creating both opportunities and risks for traders.

FNGAdataHighHigh prices for FNGA ETF (Dec 2018–May 2025)
The High prices for FNGA ETF (December 2018 – May 2025) represent the maximum trading price reached during each regular U.S. market session over the entire trading lifespan of this leveraged exchange-traded note. Originally issued under the ticker FNGU, and later rebranded as FNGA in March 2025 before its redemption, the fund was designed to deliver 3x daily leveraged exposure to the MicroSectors FANG+™ Index. This index focused on a concentrated group of large-cap technology and technology-enabled companies such as Facebook (Meta), Amazon, Apple, Netflix, and Google (Alphabet), along with a few other growth leaders.
The High price data from December 2018 through May 2025 is crucial for understanding how FNGA behaved during intraday trading sessions. Because FNGA was a daily resetting 3x leveraged product, its intraday highs often displayed extreme sensitivity to movements in the underlying FANG+™ stocks, resulting in sharp upward spikes during bullish days and pronounced volatility during broader market rallies.

Dskyz (DAFE) Quantum Sentiment Flux - Beginners Dskyz (DAFE) Quantum Sentiment Flux - Beginners:
Welcome to the Dskyz (DAFE) Quantum Sentiment Flux - Beginners , a strategy and concept that’s your ultimate wingman for trading futures like MNQ, NQ, MES, and ES. This gem combines lightning-fast momentum signals, market sentiment smarts, and bulletproof risk management into a system so intuitive, even newbies can trade like pros. With clean DAFE visuals, preset modes for every vibe, and a revamped dashboard that’s basically a market GPS, this strategy makes futures trading feel like a high-octane sci-fi mission.
Built on the Dskyz (DAFE) legacy of Aurora Divergence, the Quantum Sentiment Flux is designed to empower beginners while giving seasoned traders a lean, sentiment-driven edge. It uses fast/slow EMA crossovers for entries, filters trades with VIX, SPX trends, and sector breadth, and keeps your account safe with adaptive stops and cooldowns. Tuned for more action with faster signals and a slick bottom-left dashboard, this updated version is ready to light up your charts and outsmart institutional traps. Let’s dive into why this strat’s a must-have and break down its brilliance.
Why Traders Need This Strategy
Futures markets are a wild ride—fast moves, volatility spikes (like the April 28, 2025 NQ 1k-point drop), and institutional games that can wreck unprepared traders. Beginners often get lost in complex systems or burned by impulsive trades. The Quantum Sentiment Flux is the antidote, offering:
Dead-Simple Setup: Preset modes (Aggressive, Balanced, Conservative) auto-tune signals, risk, and sizing, so you can trade without a quant degree.
Sentiment Superpower: VIX filter, SPX trend, and sector breadth visuals keep you aligned with market health, dodging chop and riding trends.
Ironclad Safety: Tighter ATR-based stops, 2:1 take-profits, and preset cooldowns protect your capital, even in chaotic sessions.
Next-Level Visuals: Green/red entry triangles, vibrant EMAs, a sector breadth background, and a beefed-up dashboard make signals and context pop.
DAFE Swagger: The clean aesthetics, sleek dashboard—ties it to Dskyz’s elite brand, making your charts a work of art.
Traders need this because it’s a plug-and-play system that blends beginner-friendly simplicity with pro-level market awareness. Whether you’re just starting or scalping 5min MNQ, this strat’s your key to trading with confidence and style.
Strategy Components
1. Core Signal Logic (High-Speed Momentum)
The strategy’s engine is a momentum-based system using fast and slow Exponential Moving Averages (EMAs), now tuned for faster, more frequent trades.
How It Works:
Fast/Slow EMAs: Fast EMA (Aggressive: 5, Balanced: 7, Conservative: 9 bars) and slow EMA (12/14/18 bars) track short-term vs. longer-term momentum.
Crossover Signals:
Buy: Fast EMA crosses above slow EMA, and trend_dir = 1 (fast EMA > slow EMA + ATR * strength threshold).
Sell: Fast EMA crosses below slow EMA, and trend_dir = -1 (fast EMA < slow EMA - ATR * strength threshold).
Strength Filter: ma_strength = fast EMA - slow EMA must exceed an ATR-scaled threshold (Aggressive: 0.15, Balanced: 0.18, Conservative: 0.25) for robust signals.
Trend Direction: trend_dir confirms momentum, filtering out weak crossovers in choppy markets.
Evolution:
Faster EMAs (down from 7–10/21–50) catch short-term trends, perfect for active futures markets.
Lower strength thresholds (0.15–0.25 vs. 0.3–0.5) make signals more sensitive, boosting trade frequency without sacrificing quality.
Preset tuning ensures beginners get optimized settings, while pros can tweak via mode selection.
2. Market Sentiment Filters
The strategy leans hard into market sentiment with a VIX filter, SPX trend analysis, and sector breadth visuals, keeping trades aligned with the big picture.
VIX Filter:
Logic: Blocks long entries if VIX > threshold (default: 20, can_long = vix_close < vix_limit). Shorts are always allowed (can_short = true).
Impact: Prevents longs during high-fear markets (e.g., VIX spikes in crashes), while allowing shorts to capitalize on downturns.
SPX Trend Filter:
Logic: Compares S&P 500 (SPX) close to its SMA (Aggressive: 5, Balanced: 8, Conservative: 12 bars). spx_trend = 1 (UP) if close > SMA, -1 (DOWN) if < SMA, 0 (FLAT) if neutral.
Impact: Provides dashboard context, encouraging trades that align with market direction (e.g., longs in UP trend).
Sector Breadth (Visual):
Logic: Tracks 10 sector ETFs (XLK, XLF, XLE, etc.) vs. their SMAs (same lengths as SPX). Each sector scores +1 (bullish), -1 (bearish), or 0 (neutral), summed as breadth (-10 to +10).
Display: Green background if breadth > 4, red if breadth < -4, else neutral. Dashboard shows sector trends (↑/↓/-).
Impact: Faster SMA lengths make breadth more responsive, reflecting sector rotations (e.g., tech surging, energy lagging).
Why It’s Brilliant:
- VIX filter adds pro-level volatility awareness, saving beginners from panic-driven losses.
- SPX and sector breadth give a 360° view of market health, boosting signal confidence (e.g., green BG + buy signal = high-probability trade).
- Shorter SMAs make sentiment visuals react faster, perfect for 5min charts.
3. Risk Management
The risk controls are a fortress, now tighter and more dynamic to support frequent trading while keeping accounts safe.
Preset-Based Risk:
Aggressive: Fast EMAs (5/12), tight stops (1.1x ATR), 1-bar cooldown. High trade frequency, higher risk.
Balanced: EMAs (7/14), 1.2x ATR stops, 1-bar cooldown. Versatile for most traders.
Conservative: EMAs (9/18), 1.3x ATR stops, 2-bar cooldown. Safer, fewer trades.
Impact: Auto-scales risk to match style, making it foolproof for beginners.
Adaptive Stops and Take-Profits:
Logic: Stops = entry ± ATR * atr_mult (1.1–1.3x, down from 1.2–2.0x). Take-profits = entry ± ATR * take_mult (2x stop distance, 2:1 reward/risk). Longs: stop below entry, TP above; shorts: vice versa.
Impact: Tighter stops increase trade turnover while maintaining solid risk/reward, adapting to volatility.
Trade Cooldown:
Logic: Preset-driven (Aggressive/Balanced: 1 bar, Conservative: 2 bars vs. old user-input 2). Ensures bar_index - last_trade_bar >= cooldown.
Impact: Faster cooldowns (especially Aggressive/Balanced) allow more trades, balanced by VIX and strength filters.
Contract Sizing:
Logic: User sets contracts (default: 1, max: 10), no preset cap (unlike old 7/5/3 suggestion).
Impact: Flexible but risks over-leverage; beginners should stick to low contracts.
Built To Be Reliable and Consistent:
- Tighter stops and faster cooldowns make it a high-octane system without blowing up accounts.
- Preset-driven risk removes guesswork, letting newbies trade confidently.
- 2:1 TPs ensure profitable trades outweigh losses, even in volatile sessions like April 27, 2025 ES slippage.
4. Trade Entry and Exit Logic
The entry/exit rules are simple yet razor-sharp, now with VIX filtering and faster signals:
Entry Conditions:
Long Entry: buy_signal (fast EMA crosses above slow EMA, trend_dir = 1), no position (strategy.position_size = 0), cooldown passed (can_trade), and VIX < 20 (can_long). Enters with user-defined contracts.
Short Entry: sell_signal (fast EMA crosses below slow EMA, trend_dir = -1), no position, cooldown passed, can_short (always true).
Logic: Tracks last_entry_bar for visuals, last_trade_bar for cooldowns.
Exit Conditions:
Stop-Loss/Take-Profit: ATR-based stops (1.1–1.3x) and TPs (2x stop distance). Longs exit if price hits stop (below) or TP (above); shorts vice versa.
No Other Exits: Keeps it straightforward, relying on stops/TPs.
5. DAFE Visuals
The visuals are pure DAFE magic, blending clean function with informative metrics utilized by professionals, now enhanced by faster signals and a responsive breadth background:
EMA Plots:
Display: Fast EMA (blue, 2px), slow EMA (orange, 2px), using faster lengths (5–9/12–18).
Purpose: Highlights momentum shifts, with crossovers signaling entries.
Sector Breadth Background:
Display: Green (90% transparent) if breadth > 4, red (90%) if breadth < -4, else neutral.
Purpose: Faster breadth_sma_len (5–12 vs. 10–50) reflects sector shifts in real-time, reinforcing signal strength.
- Visuals are intuitive, turning complex signals into clear buy/sell cues.
- Faster breadth background reacts to market rotations (e.g., tech vs. energy), giving a pro-level edge.
6. Sector Breadth Dashboard
The new bottom-left dashboard is a game-changer, a 3x16 table (black/gray theme) that’s your market command center:
Metrics:
VIX: Current VIX (red if > 20, gray if not).
SPX: Trend as “UP” (green), “DOWN” (red), or “FLAT” (gray).
Trade Longs: “OK” (green) if VIX < 20, “BLOCK” (red) if not.
Sector Breadth: 10 sectors (Tech, Financial, etc.) with trend arrows (↑ green, ↓ red, - gray).
Placeholder Row: Empty for future metrics (e.g., ATR, breadth score).
Purpose: Consolidates regime, volatility, market trend, and sector data, making decisions a breeze.
- VIX and SPX metrics add context, helping beginners avoid bad trades (e.g., no longs if “BLOCK”).
Sector arrows show market health at a glance, like a cheat code for sentiment.
Key Features
Beginner-Ready: Preset modes and clear visuals make futures trading a breeze.
Sentiment-Driven: VIX filter, SPX trend, and sector breadth keep you in sync with the market.
High-Frequency: Faster EMAs, tighter stops, and short cooldowns boost trade volume.
Safe and Smart: Adaptive stops/TPs and cooldowns protect capital while maximizing wins.
Visual Mastery: DAFE’s clean flair, EMAs, dashboard—makes trading fun and clear.
Backtestable: Lean code and fixed qty ensure accurate historical testing.
How to Use
Add to Chart: Load on a 5min MNQ/ES chart in TradingView.
Pick Preset: Aggressive (scalping), Balanced (versatile), or Conservative (safe). Balanced is default.
Set Contracts: Default 1, max 10. Stick low for safety.
Check Dashboard: Bottom-left shows preset, VIX, SPX, and sectors. “OK” + green breadth = strong buy.
Backtest: Run in strategy tester to compare modes.
Live Trade: Connect to Tradovate or similar. Watch for slippage (e.g., April 27, 2025 ES issues).
Replay Test: Try April 28, 2025 NQ drop to see VIX filter and stops in action.
Why It’s Brilliant
The Dskyz (DAFE) Quantum Sentiment Flux - Beginners is a masterpiece of simplicity and power. It takes pro-level tools—momentum, VIX, sector breadth—and wraps them in a system anyone can run. Faster signals and tighter stops make it a trading machine, while the VIX filter and dashboard keep you ahead of market chaos. The DAFE visuals and bottom-left command center turn your chart into a futuristic cockpit, guiding you through every trade. For beginners, it’s a safe entry to futures; for pros, it’s a scalping beast with sentiment smarts. This strat doesn’t just trade—it transforms how you see the market.
Final Notes
This is more than a strategy—it’s your launchpad to mastering futures with Dskyz (DAFE) flair. The Quantum Sentiment Flux blends accessibility, speed, and market savvy to help you outsmart the game. Load it, watch those triangles glow, and let’s make the markets your canvas!
Official Statement from Pine Script Team
(see TradingView help docs and forums):
"This warning may appear when you call functions such as ta.sma inside a request.security in a loop. There is no runtime impact. If you need to loop through a dynamic list of tickers, this cannot be avoided in the present version... Values will still be correct. Ignore this warning in such contexts."
(This publishing will most likely be taken down do to some miscellaneous rule about properly displaying charting symbols, or whatever. Once I've identified what part of the publishing they want to pick on, I'll adjust and repost.)
Use it with discipline. Use it with clarity. Trade smarter.
**I will continue to release incredible strategies and indicators until I turn this into a brand or until someone offers me a contract.
Created by Dskyz, powered by DAFE Trading Systems. Trade fast, trade bold.

Williams R Zone Scalper v1.0[BullByte]Originality & Usefulness
Unlike standard Williams R cross-over scripts, this strategy layers five dynamic filters—moving-average trend, Supertrend, Choppiness Index, Bollinger Band Width, and volume validation —and presents a real-time dashboard with equity, PnL, filter status, and key indicator values. No other public Pine script combines these elements with toggleable filters and a custom dashboard. In backtests (BTC/USD (Binance), 5 min, 24 Mar 2025 → 28 Apr 2025), adding these filters turned a –2.09 % standalone Williams R into a +5.05 % net winner while cutting maximum drawdown in half.
---
What This Script Does
- Monitors Williams R (length 14) for overbought/oversold reversals.
- Applies up to five dynamic filters to confirm trend strength and volatility direction:
- Moving average (SMA/EMA/WMA/HMA)
- Supertrend line
- Choppiness Index (CI)
- Bollinger Band Width (BBW)
- Volume vs. its 50-period MA
- Plots blue arrows for Long entries (R crosses above –80 + all filters green) and red arrows for Short entries (R crosses below –20 + all filters green).
- Optionally sets dynamic ATR-based stop-loss (1.5×ATR) and take-profit (2×ATR).
- Shows a dashboard box with current position, equity, PnL, filter status, and real-time Williams R / MA/volume values.
---
Backtest Summary (BTC/USD(Binance), 5 min, 24 Mar 2025 → 28 Apr 2025)
• Total P&L : +50.70 USD (+5.05 %)
• Max Drawdown : 31.93 USD (3.11 %)
• Total Trades : 198
• Win Rate : 55.05 % (109/89)
• Profit Factor : 1.288
• Commission : 0.01 % per trade
• Slippage : 0 ticks
Even in choppy March–April, this multi-filter approach nets +5 % with a robust risk profile, compared to –2.09 % and higher drawdown for Williams R alone.
---
Williams R Alone vs. Multi-Filter Version
• Total P&L :
– Williams R alone → –20.83 USD (–2.09 %)
– Multi-Filter → +50.70 USD (+5.05 %)
• Max Drawdown :
– Williams R alone → 62.13 USD (6.00 %)
– Multi-Filter → 31.93 USD (3.11 %)
• Total Trades : 543 vs. 198
• Win Rate : 60.22 % vs. 55.05 %
• Profit Factor : 0.943 vs. 1.288
---
Inputs & What They Control
- wrLen (14): Williams R look-back
- maType (EMA): Trend filter type (SMA, EMA, WMA, HMA)
- maLen (20): Moving-average period
- useChop (true): Toggle Choppiness Index filter
- ciLen (12): CI look-back length
- chopThr (38.2): CI threshold (below = trending)
- useVol (true): Toggle volume-above-average filter
- volMaLen (50): Volume MA period
- useBBW (false): Toggle Bollinger Band Width filter
- bbwMaLen (50): BBW MA period
- useST (false): Toggle Supertrend filter
- stAtrLen (10): Supertrend ATR length
- stFactor (3.0): Supertrend multiplier
- useSL (false): Toggle ATR-based SL/TP
- atrLen (14): ATR period for SL/TP
- slMult (1.5): SL = slMult × ATR
- tpMult (2.0): TP = tpMult × ATR
---
How to Read the Chart
- Blue arrow (Long): Williams R crosses above –80 + all enabled filters green
- Red arrow (Short) : Williams R crosses below –20 + all filters green
- Dashboard box:
- Top : position and equity
- Next : cumulative PnL in USD & %
- Middle : green/white dots for each filter (green=passing, white=disabled)
- Bottom : Williams R, MA, and volume current values
---
Usage Tips
- Add the script : Indicators → My Scripts → Williams R Zone Scalper v1.0 → Add to BTC/USD chart on 5 min.
- Defaults : Optimized for BTC/USD.
- Forex majors : Raise `chopThr` to ~42.
- Stocks/high-beta : Enable `useBBW`.
- Enable SL/TP : Toggle `useSL`; stop-loss = 1.5×ATR, take-profit = 2×ATR apply automatically.
---
Common Questions
- * Why not trade every Williams R reversal?*
Raw Williams R whipsaws in sideways markets. Choppiness and volume filters reduce false entries.
- *Can I use on 1 min or 15 min?*
Yes—adjust ATR length or thresholds accordingly. Defaults target 5 min scalping.
- *What if all filters are on?*
Fewer arrows, higher-quality signals. Expect ~10 % boost in average win size.
---
Disclaimer & License
Trading carries risk of loss. Use this script “as is” under the Mozilla Public License 2.0 (mozilla.org). Always backtest, paper-trade, and adjust risk settings to your own profile.
---
Credits & References
- Pine Script v6, using TradingView’s built-in `ta.supertrend()`.
- TradingView House Rules: www.tradingview.com
Goodluck!
BullByte

US Construction Spending & Manufacturing Employment YoY % ChangeUsage Notes: Timeframe: Use a monthly chart, as TTLCONS and MANEMP are monthly data. Other timeframes result in interpolation.
Data Availability: As of October 2025, TTLCONS is available until July 2025 and MANEMP until August 2025 (automatically via TradingView).
The Unsung Heroes: Why C&M Are the True Indicators
Imagine the economy is a highly sensitive vehicle. Quarterly reported GDP is like a quarterly glance at the odometer—it's slow, often delayed, and clearly refers to the past. Anyone who wants to predict future developments needs something much faster.
This is where construction and manufacturing come into play. These two sectors are the machine builders of the economy and provide us with real-time feedback. They form the backbone of economic forecasting for several important reasons:
1. Monetary policy indicators: Both sectors are highly sensitive to monetary policy developments, such as interest rate changes. If developers are unable to finance large residential or commercial projects and manufacturers postpone capital-intensive factory expansions, for example, declines in construction demand would quickly affect other sectors.
2. The backbone of the secondary sector: These industries constitute the secondary sector of the economy, meaning they are concerned with the actual transformation and production of goods, not just the extraction of raw materials or the provision of intangible services. One could argue that while they only account for about 15% of GDP in the US, their impact is massive and cyclical.
3. The timeliness advantage: Forget quarterly lags. Both construction output and manufacturing employment data are released monthly. This timely, frequent data allows analysts to assess economic momentum much more quickly than if they had to wait for delayed GDP reports.
In the US, some analysts have even titled their articles with the bold claim: "Housing construction is the business cycle." Fluctuations in housing construction are frequent and large, and a decline in activity is almost always accompanied by a subsequent decline in GDP.

FNGAdataLow“Low prices for FNGA ETF (Dec 2018–May 2025)
The Low prices for FNGA ETF (December 2018 – May 2025) capture the lowest trading price reached during each regular U.S. market session over the entire lifespan of this leveraged exchange-traded note. Initially launched under the ticker FNGU, and later rebranded as FNGA in March 2025 before its eventual redemption, the fund was structured to deliver 3x daily leveraged exposure to the MicroSectors FANG+™ Index. This index concentrated on a small basket of leading technology and tech-enabled growth companies such as Meta (Facebook), Amazon, Apple, Netflix, and Alphabet (Google), along with a few other innovators.
The Low price is particularly important in the study of FNGA because it highlights the intraday downside extremes of a highly volatile, leveraged product. Since FNGA was designed to reset leverage daily, its lows often reflected moments of amplified market stress, when declines in the underlying FANG+™ stocks were multiplied through the 3x leverage structure.

FNGAdataOpenOpen prices for FNGA ETF (Dec 2018–May 2025)
The FNGA ETF (originally launched under the FNGU ticker before being renamed in March 2025) tracked the MicroSectors FANG+™ Index with 3x daily leverage and was designed to give traders magnified exposure to a concentrated basket of large-cap technology and tech-enabled companies. The fund’s price history contains multiple phases due to ticker changes, corporate actions, and its eventual redemption in mid-2025.
When looking specifically at Open prices from December 2018 through May 2025, this dataset provides the daily opening values for FNGA across its entire lifecycle. The opening price is the first traded price at the start of each regular U.S. market session (9:30 a.m. Eastern Time). It is an important measure for traders and analysts because it reflects overnight sentiment, pre-market positioning, and often sets the tone for intraday volatility.

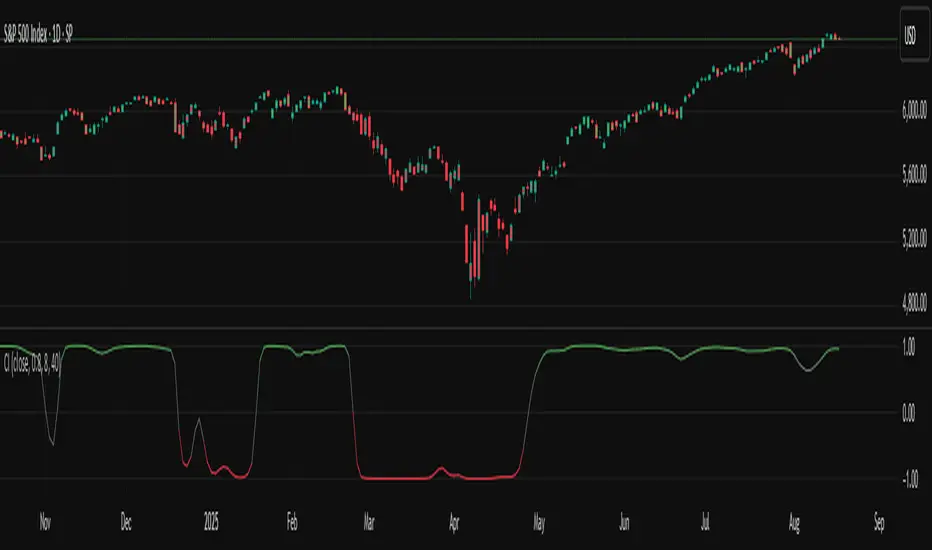
TASC 2025.09 The Continuation Index
█ OVERVIEW
This script implements the "Continuation Index" as described by John F. Ehlers in the September 2025 edition of TASC's Trader's Tips . The Continuation Index uses Laguerre filters (featured in the July 2025 edition) to provide an early indication of trend direction, continuation, and exhaustion.
█ CONCEPTS
The idea for the Continuation Index was formed from an observation about Laguerre filters. In his article, Ehlers notes that when price is in trend, it tends to stay to one side of the filter. When considering smoothing, the UltimateSmoother was an obvious choice to reduce lag. With that in mind, The Continuation Index normalizes the difference between UltimateSmoother and the Laguerre filter to produce a two-state oscillator.
To minimize lag, the UltimateSmoother length in this indicator is fixed to half the length of the Laguerre filter.
█ USAGE
The Continuation Index consists of two primary states.
+1 suggests that the trader should position on the long side.
-1 suggests that the user should position on the short side.
Other readings can imply other opportunities, such as:
High Value Fluctuation could be used as a "buy the dip" opportunity.
Low Value Fluctuation could be used as a "sell the pop" opportunity.
█ INPUTS
By understanding the inputs and adjusting them as needed, each trader can benefit more from this indicator:
Gamma : Controls the Laguerre filter's response. This can be set anywhere between 0 and 1. If set to 0, the filter’s value will be the same as the UltimateSmoother.
Order : Controls the lag of the Laguerre filter, which is important when considering the timing of the system for spotting reversals. This can be set from 1 to 10, with lower values typically producing faster timing.
Length : Affects the smoothing of the display. Ehlers recommends starting with this value set to the intended amount of time you plan to hold a position. Consider your chart timeframe when setting this input. For example, on a daily chart, if you intend to hold a position for one month, set a value of 20.
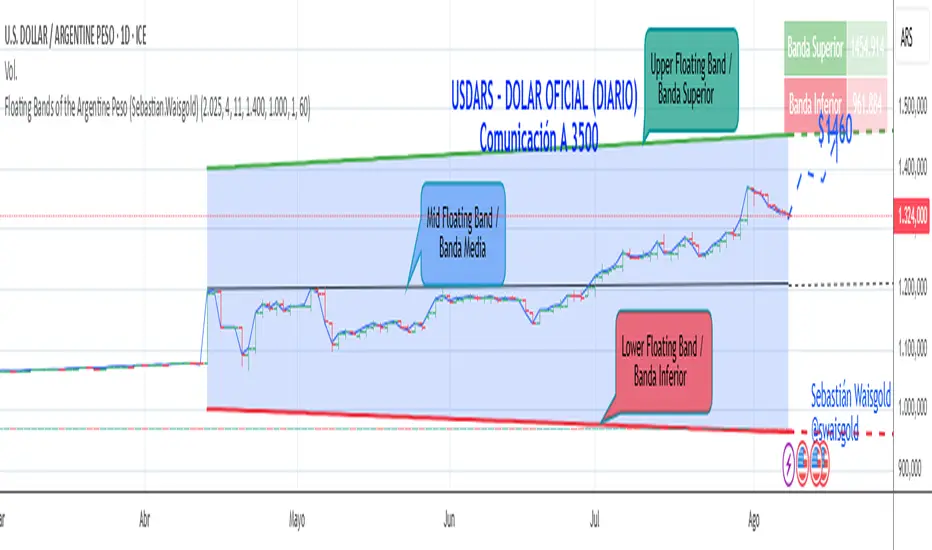
Floating Bands of the Argentine Peso (Sebastian.Waisgold)
The BCRA ( Central Bank of the Argentine Republic ) announced that as of Monday, April 15, 2025, the Argentine Peso (USDARS) will float within a system of divergent exchange rate bands.
The upper band was set at ARS 1400 per USD on 15/04/2025, with a +1% monthly adjustment distributed daily, rising by a fraction each day.
The lower band was set at ARS 1000 per USD on 15/04/2025, with a –1% monthly adjustment distributed daily, falling by a fraction each day.
This indicator is crucial for anyone trading USDARS, since the BCRA will only intervene in these situations:
- Selling : if the Peso depreciates against the USD above the upper band .
- Buying : if the Peso appreciates against the USD below the lower band .
Therefore, this indicator can be used as follows:
- If USDARS is above the upper band , it is “expensive” and you may sell .
- If USDARS is below the lower band , it is “cheap” and you may buy .
It can also be applied to other assets such as:
- USDTARS
- Dollar Cable / CCL (Contado con Liquidación) , derived from the BCBA:YPFD / NYSE:YPF ratio.
A mid band —exactly halfway between the upper and lower bands—has also been added.
Once added, the indicator should look like this:
In the following image you can see:
- Upper Floating Band
- Lower Floating Band
- Mid Floating Band
User Configuration
By double-clicking any line you can adjust:
- Start day (Dia de incio), month (Mes de inicio), and year (Año de inicio)
- Initial upper band value (Valor inicial banda superior)
- Initial lower band value (Valor inicial banda inferior)
- Monthly rate Tasa mensual %)
It is recommended not to modify these settings for the Argentine Peso, as they reflect the BCRA’s official framework. However, you may customize them—and the line colors—for other assets or currencies implementing a similar band scheme.
MSTY-WNTR Rebalancing SignalMSTY-WNTR Rebalancing Signal
## Overview
The **MSTY-WNTR Rebalancing Signal** is a custom TradingView indicator designed to help investors dynamically allocate between two YieldMax ETFs: **MSTY** (YieldMax MSTR Option Income Strategy ETF) and **WNTR** (YieldMax Short MSTR Option Income Strategy ETF). These ETFs are tied to MicroStrategy (MSTR) stock, which is heavily influenced by Bitcoin's price due to MSTR's significant Bitcoin holdings.
MSTY benefits from upward movements in MSTR (and thus Bitcoin) through a covered call strategy that generates income but caps upside potential. WNTR, on the other hand, provides inverse exposure, profiting from MSTR declines but losing in rallies. This indicator uses Bitcoin's momentum and MSTR's relative strength to signal when to hold MSTY (bullish phases), WNTR (bearish phases), or stay neutral, aiming to optimize returns by switching allocations at key turning points.
Inspired by strategies discussed in crypto communities (e.g., X posts analyzing MSTR-linked ETFs), this indicator promotes an active rebalancing approach over a "set and forget" buy-and-hold strategy. In simulated backtests over the past 12 months (as of August 4, 2025), the optimized version has shown potential to outperform holding 100% MSTY or 100% WNTR alone, with an illustrative APY of ~125% vs. ~6% for MSTY and ~-15% for WNTR in one scenario.
**Important Disclaimer**: This is not financial advice. Past performance does not guarantee future results. Always consult a financial advisor. Trading involves risk, and you could lose money. The indicator is for educational and informational purposes only.
## Key Features
- **Momentum-Based Signals**: Uses a Simple Moving Average (SMA) on Bitcoin's price to detect bullish (price > SMA) or bearish (price < SMA) trends.
- **RSI Confirmation**: Incorporates MSTR's Relative Strength Index (RSI) to filter signals, avoiding overbought conditions for MSTY and oversold for WNTR.
- **Visual Cues**:
- Green upward triangle for "Hold MSTY".
- Red downward triangle for "Hold WNTR".
- Yellow cross for "Switch" signals.
- Background color: Green for MSTY, red for WNTR.
- **Information Panel**: A table in the top-right corner displays real-time data: BTC Price, SMA value, MSTR RSI, and current Allocation (MSTY, WNTR, or Neutral).
- **Alerts**: Configurable alerts for holding MSTY, holding WNTR, or switching.
- **Optimized Parameters**: Defaults are tuned (SMA: 10 days, RSI: 15 periods, Overbought: 80, Oversold: 20) based on simulations to reduce whipsaws and capture trends effectively.
## How It Works
The indicator's logic is straightforward yet effective for volatile assets like Bitcoin and MSTR:
1. **Primary Trigger (Bitcoin Momentum)**:
- Calculate the SMA of Bitcoin's closing price (default: 10-day).
- Bullish: Current BTC price > SMA → Potential MSTY hold.
- Bearish: Current BTC price < SMA → Potential WNTR hold.
2. **Secondary Filter (MSTR RSI Confirmation)**:
- Compute RSI on MSTR stock (default: 15-period).
- For bullish signals: If RSI > Overbought (80), signal Neutral (avoid overextended rallies).
- For bearish signals: If RSI < Oversold (20), signal Neutral (avoid capitulation bottoms).
3. **Allocation Rules**:
- Hold 100% MSTY if bullish and not overbought.
- Hold 100% WNTR if bearish and not oversold.
- Neutral otherwise (e.g., during choppy or extreme markets) – consider holding cash or avoiding trades.
4. **Rebalancing**:
- Switch signals trigger when the hold changes (e.g., from MSTY to WNTR).
- Recommended frequency: Weekly reviews or on 5% BTC moves to minimize trading costs (aim for 4-6 trades/year).
This approach leverages Bitcoin's influence on MSTR while mitigating the risks of MSTY's covered call drag during downtrends and WNTR's losses in uptrends.
## Setup and Usage
1. **Chart Requirements**:
- Apply this indicator to a Bitcoin chart (e.g., BTCUSD on Binance or Coinbase, daily timeframe recommended).
- Ensure MSTR stock data is accessible (TradingView supports it natively).
2. **Adding to TradingView**:
- Open the Pine Editor.
- Paste the script code.
- Save and add to your chart.
- Customize inputs if needed (e.g., adjust SMA/RSI lengths for different timeframes).
3. **Interpretation**:
- **Green Background/Triangle**: Allocate 100% to MSTY – Bitcoin is in an uptrend, MSTR not overbought.
- **Red Background/Triangle**: Allocate 100% to WNTR – Bitcoin in downtrend, MSTR not oversold.
- **Yellow Switch Cross**: Rebalance your portfolio immediately.
- **Neutral (No Signal)**: Panel shows "Neutral" – Hold cash or previous position; reassess weekly.
- Monitor the panel for key metrics to validate signals manually.
4. **Backtesting and Strategy Integration**:
- Convert to a strategy script by changing `indicator()` to `strategy()` and adding entry/exit logic for automated testing.
- In simulations (e.g., using Python or TradingView's backtester), it has outperformed buy-and-hold in volatile markets by ~100-200% relative APY, but results vary.
- Factor in fees: ETF expense ratios (~0.99%), trading commissions (~$0.40/trade), and slippage.
5. **Risk Management**:
- Use with a diversified portfolio; never allocate more than you can afford to lose.
- Add stop-losses (e.g., 10% trailing) to protect against extreme moves.
- Rebalance sparingly to avoid over-trading in sideways markets.
- Dividends: Reinvest MSTY/WNTR payouts into the current hold for compounding.
## Performance Insights (Simulated as of August 4, 2025)
Based on synthetic backtests modeling the last 12 months:
- **Optimized Strategy APY**: ~125% (by timing switches effectively).
- **Hold 100% MSTY APY**: ~6% (gains from BTC rallies offset by downtrends).
- **Hold 100% WNTR APY**: ~-15% (losses in bull phases outweigh bear gains).
In one scenario with stronger volatility, the strategy achieved ~4533% APY vs. 10% for MSTY and -34% for WNTR, highlighting its potential in dynamic markets. However, these are illustrative; real results depend on actual BTC/MSTR movements. Test thoroughly on historical data.
## Limitations and Considerations
- **Data Dependency**: Relies on accurate BTC and MSTR data; delays or gaps can affect signals.
- **Market Risks**: Bitcoin's volatility can lead to false signals (whipsaws); the RSI filter helps but isn't perfect.
- **No Guarantees**: This indicator doesn't predict the future. MSTR's correlation to BTC may change (e.g., due to regulatory events).
- **Not for All Users**: Best for intermediate/advanced traders familiar with ETFs and crypto. Beginners should paper trade first.
- **Updates**: As of August 4, 2025, this is version 1.0. Future updates may include volume filters or EMA options.
If you find this indicator useful, consider leaving a like or comment on TradingView. Feedback welcome for improvements!

z-score-calkusi-v1.143z-scores incorporate the moment of N look-back bars to allow future price projection.
z-score = (X - mean)/std.deviation ; X = close
z-scores update with each new close print and with each new bar. Each new bar augments the mean and std.deviation for the N bars considered. The old Nth bar falls away from consideration with each new historical bar.
The indicator allows two other options for X: RSI or Moving Average.
NOTE: While trading use the "price" option only.
The other two options are provided for visualisation of RSI and Moving Average as z-score curves.
Use z-scores to identify tops and bottoms in the future as well as intermediate intersections through which a z-score will pass through with each new close and each new bar.
Draw lines from peaks and troughs in the past through intermediate peaks and troughs to identify projected intersections in the future. The most likely intersections are those that are formed from a line that comes from a peak in the past and another line that comes from a trough in the past. Try getting at least two lines from historical peaks and two lines from historical troughs to pass through a future intersection.
Compute the target intersection price in the future by clicking on the z-score indicator header to see a drag-able horizontal line to drag over the intersection. The target price is the last value displayed in the indicator's status bar after the closing price.
When the indicator header is clicked, a white horizontal drag-able line will appear to allow dragging the line over an intersection that has been drawn on the indicator for a future z-score projection and the associated future closing price.
With each new bar that appears, it is necessary to repeat the procedure of clicking the z-score indicator header to be able to drag the drag-able horizontal line to see the new target price for the selected intersection. The projected price will be different from the current close price providing a price arbitrage in time.
New intermediate peaks and troughs that appear require new lines be drawn from the past through the new intermediate peak to find a new intersection in the future and a new projected price. Since z-score curves are sort of cyclical in nature, it is possible to see where one has to locate a future intersection by drawing lines from past peaks and troughs.
Do not get fixated on any one projected price as the market decides which projected price will be realised. All prospective targets should be manually updated with each new bar.
When the z-score plot moves outside a channel comprised of lines that are drawn from the past, be ready to adjust to new market conditions.
z-score plots that move above the zero line indicate price action that is either rising or ranging. Similarly, z-score plots that move below the zero line indicate price action that is either falling or ranging. Be ready to adjust to new market conditions when z-scores move back and forth across the zero line.
A bar with highest absolute z-score for a cycle screams "reversal approaching" and is followed by a bar with a lower absolute z-score where close price tops and bottoms are realised. This can occur either on the next bar or a few bars later.
The indicator also displays the required N for a Normal(0,1) distribution that can be set for finer granularity for the z-score curve.This works with the Confidence Interval (CI) z-score setting. The default z-score is 1.96 for 95% CI.
Common Confidence Interval z-scores to find N for Normal(0,1) with a Margin of Error (MOE) of 1:
70% 1.036
75% 1.150
80% 1.282
85% 1.440
90% 1.645
95% 1.960
98% 2.326
99% 2.576
99.5% 2.807
99.9% 3.291
99.99% 3.891
99.999% 4.417
9-Jun-2025
Added a feature to display price projection labels at z-score levels 3, 2, 1, 0, -1, -2, 3.
This provides a range for prices available at the current time to help decide whether it is worth entering a trade. If the range of prices from say z=|2| to z=|1| is too narrow, then a trade at the current time may not be worth the risk.
Added plot for z-score moving average.
28-Jun-2025
Added Settings option for # of Std.Deviation level Price Labels to display. The default is 3. Min is 2. Max is 6.
This feature allows likelihood assessment for Fibonacci price projections from higher time frames at lower time frames. A Fibonacci price projection that falls outside |3.x| Std.Deviations is not likely.
Added Settings option for Chart Bar Count and Target Label Offset to allow placement of price labels for the standard z-score levels to the right of the window so that these are still visible in the window.
Target Label Offset allows adjustment of placement of Target Price Label in cases when the Target Price Label is either obscured by the price labels for the standard z-score levels or is too far right to be visible in the window.
9-Jul-2025
z-score 1.142 updates:
Displays in the status line before the close price the range for the selected Std. Deviation levels specified in Settings and |z-zMa|.
When |z-zMa| > |avg(z-zMa)| and zMa rising, |z-zMa| and zMa displays in aqua.
When |z-zMa| > |avg(z-zMa)| and zMa falling, |z-zMa| and zMa displays in red.
When |z-zMa| <= |avg(z-zMa)|, z and zMa display in gray.
z usually crosses over zMa when zMa is gray but not always. So if cross-over occurs when zMa is not gray, it implies a strong move in progress.
Practice makes perfect.
Use this indicator at your own risk

Tuga SupertrendDescription
This strategy uses the Supertrend indicator enhanced with commission and slippage filters to capture trends on the daily chart. It’s designed to work on any asset but is especially effective in markets with consistent movements.
Use the date inputs to set the backtest period (default: from January 1, 2018, through today, June 30, 2025).
The default input values are optimized for the daily chart. For other timeframes, adjust the parameters to suit the asset you’re testing.
Release Notes
June 30, 2025
• Updated default backtest period to end on June 30, 2025.
• Default commission adjusted to 0.1 %.
• Slippage set to 3 ticks.
• Default slippage set to 3 ticks.
• Simplified the strategy name to “Tuga Supertrend”.
Default Parameters
Parameter Default Value
Supertrend Period 10
Multiplier (Factor) 3
Commission 0.1 %
Slippage 3 ticks
Start Date January 1, 2018
End Date June 30, 2025

SPX Weekly Expected Moves# SPX Weekly Expected Moves Indicator
A professional Pine Script indicator for TradingView that displays weekly expected move levels for SPX based on real options data, with integrated Fibonacci retracement analysis and intelligent alerting system.
## Overview
This indicator helps options and equity traders visualize weekly expected move ranges for the S&P 500 Index (SPX) by plotting historical and current week expected move boundaries derived from weekly options pricing. Unlike theoretical volatility calculations, this indicator uses actual market-based expected move data that you provide from options platforms.
## Key Features
### 📈 **Expected Move Visualization**
- **Historical Lines**: Display past weeks' expected moves with configurable history (10, 26, or 52 weeks)
- **Current Week Focus**: Highlighted current week with extended lines to present time
- **Friday Close Reference**: Orange baseline showing the previous Friday's close price
- **Timeframe Independent**: Works consistently across all chart timeframes (1m to 1D)
### 🎯 **Fibonacci Integration**
- **Five Fibonacci Levels**: 23.6%, 38.2%, 50%, 61.8%, 76.4% between Friday close and expected move boundaries
- **Color-Coded Levels**:
- Red: 23.6% & 76.4% (outer levels)
- Blue: 38.2% & 61.8% (golden ratio levels)
- Black: 50% (midpoint - most critical level)
- **Current Week Only**: Fibonacci levels shown only for active trading week to reduce clutter
### 📊 **Real-Time Information Table**
- **Current SPX Price**: Live market price
- **Expected Move**: ±EM value for current week
- **Previous Close**: Friday close price (baseline for calculations)
- **100% EM Levels**: Exact upper and lower boundary prices
- **Current Location**: Real-time position within the EM structure (e.g., "Above 38.2% Fib (upper zone)")
### 🚨 **Intelligent Alert System**
- **Zone-Aware Alerts**: Separate alerts for upper and lower zones
- **Key Level Breaches**: Alerts for 23.6% and 76.4% Fibonacci level crossings
- **Bar Close Based**: Alerts trigger on confirmed bar closes, not tick-by-tick
- **Customizable**: Enable/disable alerts through settings
## How It Works
### Data Input Method
The indicator uses a **manual data entry approach** where you input actual expected move values obtained from options platforms:
```pinescript
// Add entries using the options expiration Friday date
map.put(expected_moves, 20250613, 91.244) // Week ending June 13, 2025
map.put(expected_moves, 20250620, 95.150) // Week ending June 20, 2025
```
### Weekly Structure
- **Monday 9:30 AM ET**: Week begins
- **Friday 4:00 PM ET**: Week ends
- **Lines Extend**: From Monday open to Friday close (historical) or current time + 5 bars (current week)
- **Timezone Handling**: Uses "America/New_York" for proper DST handling
### Calculation Logic
1. **Base Price**: Previous Friday's SPX close price
2. **Expected Move**: Market-derived ±EM value from weekly options
3. **Upper Boundary**: Friday Close + Expected Move
4. **Lower Boundary**: Friday Close - Expected Move
5. **Fibonacci Levels**: Proportional levels between Friday close and EM boundaries
## Setup Instructions
### 1. Data Collection
Obtain weekly expected move values from options platforms such as:
- **ThinkOrSwim**: Use thinkBack feature to look up weekly expected moves
- **Tastyworks**: Check weekly options expected move data
- **CBOE**: Reference SPX weekly options data
- **Manual Calculation**: (ATM Call Premium + ATM Put Premium) × 0.85
### 2. Data Entry
After each Friday close, update the indicator with the next week's expected move:
```pinescript
// Example: On Friday June 7, 2025, add data for week ending June 13
map.put(expected_moves, 20250613, 91.244) // Actual EM value from your platform
```
### 3. Configuration
Customize the indicator through the settings panel:
#### Visual Settings
- **Show Current Week EM**: Toggle current week display
- **Show Past Weeks**: Toggle historical weeks display
- **Max Weeks History**: Choose 10, 26, or 52 weeks of history
- **Show Fibonacci Levels**: Toggle Fibonacci retracement levels
- **Label Controls**: Customize which labels to display
#### Colors
- **Current Week EM**: Default yellow for active week
- **Past Weeks EM**: Default gray for historical weeks
- **Friday Close**: Default orange for baseline
- **Fibonacci Levels**: Customizable colors for each level type
#### Alerts
- **Enable EM Breach Alerts**: Master toggle for all alerts
- **Specific Alerts**: Four alert types for Fibonacci level breaches
## Trading Applications
### Options Trading
- **Straddle/Strangle Positioning**: Visualize breakeven levels for neutral strategies
- **Directional Plays**: Assess probability of reaching target levels
- **Earnings Plays**: Compare actual vs. expected move outcomes
### Equity Trading
- **Support/Resistance**: Use EM boundaries and Fibonacci levels as key levels
- **Breakout Trading**: Monitor for moves beyond expected ranges
- **Mean Reversion**: Look for reversals at extreme Fibonacci levels
### Risk Management
- **Position Sizing**: Gauge likely price ranges for the week
- **Stop Placement**: Use Fibonacci levels for logical stop locations
- **Profit Targets**: Set targets based on EM structure probabilities
## Technical Implementation
### Performance Features
- **Memory Managed**: Configurable history limits prevent memory issues
- **Timeframe Independent**: Uses timestamp-based calculations for consistency
- **Object Management**: Automatic cleanup of drawing objects prevents duplicates
- **Error Handling**: Robust bounds checking and NA value handling
### Pine Script Best Practices
- **v6 Compliance**: Uses latest Pine Script version features
- **User Defined Types**: Structured data management with WeeklyEM type
- **Efficient Drawing**: Smart line/label creation and deletion
- **Professional Standards**: Clean code organization and comprehensive documentation
## Customization Guide
### Adding New Weeks
```pinescript
// Add after market close each Friday
map.put(expected_moves, YYYYMMDD, EM_VALUE)
```
### Color Schemes
Customize colors for different trading styles:
- **Dark Theme**: Use bright colors for visibility
- **Light Theme**: Use contrasting dark colors
- **Minimalist**: Use single color with transparency
### Label Management
Control label density:
- **Show Current Week Labels Only**: Reduce clutter for active trading
- **Show All Labels**: Full information for analysis
- **Selective Display**: Choose specific label types
## Troubleshooting
### Common Issues
1. **No Lines Appearing**: Check that expected move data is entered for current/recent weeks
2. **Wrong Time Display**: Ensure "America/New_York" timezone is properly handled
3. **Duplicate Lines**: Restart indicator if drawing objects appear duplicated
4. **Missing Fibonacci Levels**: Verify "Show Fibonacci Levels" is enabled
### Data Validation
- **Expected Move Format**: Use positive numbers (e.g., 91.244, not ±91.244)
- **Date Format**: Use YYYYMMDD format (e.g., 20250613)
- **Reasonable Values**: Verify EM values are realistic (typically 50-200 for SPX)
## Version History
### Current Version
- **Pine Script v6**: Latest version compatibility
- **Fibonacci Integration**: Five-level retracement analysis
- **Zone-Aware Alerts**: Upper/lower zone differentiation
- **Dynamic Line Management**: Smart current week extension
- **Professional UI**: Comprehensive information table
### Future Enhancements
- **Multiple Symbols**: Extend beyond SPX to other indices
- **Automated Data**: Integration with options data APIs
- **Statistical Analysis**: Success rate tracking for EM predictions
- **Additional Levels**: Custom percentage levels beyond Fibonacci
## License & Usage
This indicator is designed for educational and trading purposes. Users are responsible for:
- **Data Accuracy**: Ensuring correct expected move values
- **Risk Management**: Proper position sizing and risk controls
- **Market Understanding**: Comprehending options-based expected move concepts
## Support
For questions, issues, or feature requests related to this indicator, please refer to the code comments and documentation within the Pine Script file.
---
**Disclaimer**: This indicator is for informational purposes only. Trading involves substantial risk of loss and is not suitable for all investors. Past performance does not guarantee future results.

Liquid Pulse Liquid Pulse by Dskyz (DAFE) Trading Systems
Liquid Pulse is a trading algo built by Dskyz (DAFE) Trading Systems for futures markets like NQ1!, designed to snag high-probability trades with tight risk control. it fuses a confluence system—VWAP, MACD, ADX, volume, and liquidity sweeps—with a trade scoring setup, daily limits, and VIX pauses to dodge wild volatility. visuals include simple signals, VWAP bands, and a dashboard with stats.
Core Components for Liquid Pulse
Volume Sensitivity (volumeSensitivity) controls how much volume spikes matter for entries. options: 'Low', 'Medium', 'High' default: 'High' (catches small spikes, good for active markets) tweak it: 'Low' for calm markets, 'High' for chaos.
MACD Speed (macdSpeed) sets the MACD’s pace for momentum. options: 'Fast', 'Medium', 'Slow' default: 'Medium' (solid balance) tweak it: 'Fast' for scalping, 'Slow' for swings.
Daily Trade Limit (dailyTradeLimit) caps trades per day to keep risk in check. range: 1 to 30 default: 20 tweak it: 5-10 for safety, 20-30 for action.
Number of Contracts (numContracts) sets position size. range: 1 to 20 default: 4 tweak it: up for big accounts, down for small.
VIX Pause Level (vixPauseLevel) stops trading if VIX gets too hot. range: 10 to 80 default: 39.0 tweak it: 30 to avoid volatility, 50 to ride it.
Min Confluence Conditions (minConditions) sets how many signals must align. range: 1 to 5 default: 2 tweak it: 3-4 for strict, 1-2 for more trades.
Min Trade Score (Longs/Shorts) (minTradeScoreLongs/minTradeScoreShorts) filters trade quality. longs range: 0 to 100 default: 73 shorts range: 0 to 100 default: 75 tweak it: 80-90 for quality, 60-70 for volume.
Liquidity Sweep Strength (sweepStrength) gauges breakouts. range: 0.1 to 1.0 default: 0.5 tweak it: 0.7-1.0 for strong moves, 0.3-0.5 for small.
ADX Trend Threshold (adxTrendThreshold) confirms trends. range: 10 to 100 default: 41 tweak it: 40-50 for trends, 30-35 for weak ones.
ADX Chop Threshold (adxChopThreshold) avoids chop. range: 5 to 50 default: 20 tweak it: 15-20 to dodge chop, 25-30 to loosen.
VWAP Timeframe (vwapTimeframe) sets VWAP period. options: '15', '30', '60', '240', 'D' default: '60' (1-hour) tweak it: 60 for day, 240 for swing, D for long.
Take Profit Ticks (Longs/Shorts) (takeProfitTicksLongs/takeProfitTicksShorts) sets profit targets. longs range: 5 to 100 default: 25.0 shorts range: 5 to 100 default: 20.0 tweak it: 30-50 for trends, 10-20 for chop.
Max Profit Ticks (maxProfitTicks) caps max gain. range: 10 to 200 default: 60.0 tweak it: 80-100 for big moves, 40-60 for tight.
Min Profit Ticks to Trail (minProfitTicksTrail) triggers trailing. range: 1 to 50 default: 7.0 tweak it: 10-15 for big gains, 5-7 for quick locks.
Trailing Stop Ticks (trailTicks) sets trail distance. range: 1 to 50 default: 5.0 tweak it: 8-10 for room, 3-5 for fast locks.
Trailing Offset Ticks (trailOffsetTicks) sets trail offset. range: 1 to 20 default: 2.0 tweak it: 1-2 for tight, 5-10 for loose.
ATR Period (atrPeriod) measures volatility. range: 5 to 50 default: 9 tweak it: 14-20 for smooth, 5-9 for reactive.
Hardcoded Settings volLookback: 30 ('Low'), 20 ('Medium'), 11 ('High') volThreshold: 1.5 ('Low'), 1.8 ('Medium'), 2 ('High') swingLen: 5
Execution Logic Overview trades trigger when confluence conditions align, entering long or short with set position sizes. exits use dynamic take-profits, trailing stops after a profit threshold, hard stops via ATR, and a time stop after 100 bars.
Features Multi-Signal Confluence: needs VWAP, MACD, volume, sweeps, and ADX to line up.
Risk Control: ATR-based stops (capped 15 ticks), take-profits (scaled by volatility), and trails.
Market Filters: VIX pause, ADX trend/chop checks, volatility gates. Dashboard: shows scores, VIX, ADX, P/L, win %, streak.
Visuals Simple signals (green up triangles for longs, red down for shorts) and VWAP bands with glow. info table (bottom right) with MACD momentum. dashboard (top right) with stats.
Chart and Backtest:
NQ1! futures, 5-minute chart. works best in trending, volatile conditions. tweak inputs for other markets—test thoroughly.
Backtesting: NQ1! Frame: Jan 19, 2025, 09:00 — May 02, 2025, 16:00 Slippage: 3 Commission: $4.60
Fee Typical Range (per side, per contract)
CME Exchange $1.14 – $1.20
Clearing $0.10 – $0.30
NFA Regulatory $0.02
Firm/Broker Commis. $0.25 – $0.80 (retail prop)
TOTAL $1.60 – $2.30 per side
Round Turn: (enter+exit) = $3.20 – $4.60 per contract
Disclaimer this is for education only. past results don’t predict future wins. trading’s risky—only use money you can lose. backtest and validate before going live. (expect moderators to nitpick some random chart symbol rule—i’ll fix and repost if they pull it.)
About the Author Dskyz (DAFE) Trading Systems crafts killer trading algos. Liquid Pulse is pure research and grit, built for smart, bold trading. Use it with discipline. Use it with clarity. Trade smarter. I’ll keep dropping badass strategies ‘til i build a brand or someone signs me up.
2025 Created by Dskyz, powered by DAFE Trading Systems. Trade smart, trade bold.

Bitcoin Polynomial Regression ModelThis is the main version of the script. Click here for the Oscillator part of the script.
💡Why this model was created:
One of the key issues with most existing models, including our own Bitcoin Log Growth Curve Model , is that they often fail to realistically account for diminishing returns. As a result, they may present overly optimistic bull cycle targets (hence, we introduced alternative settings in our previous Bitcoin Log Growth Curve Model).
This new model however, has been built from the ground up with a primary focus on incorporating the principle of diminishing returns. It directly responds to this concept, which has been briefly explored here .
📉The theory of diminishing returns:
This theory suggests that as each four-year market cycle unfolds, volatility gradually decreases, leading to more tempered price movements. It also implies that the price increase from one cycle peak to the next will decrease over time as the asset matures. The same pattern applies to cycle lows and the relationship between tops and bottoms. In essence, these price movements are interconnected and should generally follow a consistent pattern. We believe this model provides a more realistic outlook on bull and bear market cycles.
To better understand this theory, the relationships between cycle tops and bottoms are outlined below:https://www.tradingview.com/x/7Hldzsf2/
🔧Creation of the model:
For those interested in how this model was created, the process is explained here. Otherwise, feel free to skip this section.
This model is based on two separate cubic polynomial regression lines. One for the top price trend and another for the bottom. Both follow the general cubic polynomial function:
ax^3 +bx^2 + cx + d.
In this equation, x represents the weekly bar index minus an offset, while a, b, c, and d are determined through polynomial regression analysis. The input (x, y) values used for the polynomial regression analysis are as follows:
Top regression line (x, y) values:
113, 18.6
240, 1004
451, 19128
655, 65502
Bottom regression line (x, y) values:
103, 2.5
267, 211
471, 3193
676, 16255
The values above correspond to historical Bitcoin cycle tops and bottoms, where x is the weekly bar index and y is the weekly closing price of Bitcoin. The best fit is determined using metrics such as R-squared values, residual error analysis, and visual inspection. While the exact details of this evaluation are beyond the scope of this post, the following optimal parameters were found:
Top regression line parameter values:
a: 0.000202798
b: 0.0872922
c: -30.88805
d: 1827.14113
Bottom regression line parameter values:
a: 0.000138314
b: -0.0768236
c: 13.90555
d: -765.8892
📊Polynomial Regression Oscillator:
This publication also includes the oscillator version of the this model which is displayed at the bottom of the screen. The oscillator applies a logarithmic transformation to the price and the regression lines using the formula log10(x) .
The log-transformed price is then normalized using min-max normalization relative to the log-transformed top and bottom regression line with the formula:
normalized price = log(close) - log(bottom regression line) / log(top regression line) - log(bottom regression line)
This transformation results in a price value between 0 and 1 between both the regression lines. The Oscillator version can be found here.
🔍Interpretation of the Model:
In general, the red area represents a caution zone, as historically, the price has often been near its cycle market top within this range. On the other hand, the green area is considered an area of opportunity, as historically, it has corresponded to the market bottom.
The top regression line serves as a signal for the absolute market cycle peak, while the bottom regression line indicates the absolute market cycle bottom.
Additionally, this model provides a predicted range for Bitcoin's future price movements, which can be used to make extrapolated predictions. We will explore this further below.
🔮Future Predictions:
Finally, let's discuss what this model actually predicts for the potential upcoming market cycle top and the corresponding market cycle bottom. In our previous post here , a cycle interval analysis was performed to predict a likely time window for the next cycle top and bottom:
In the image, it is predicted that the next top-to-top cycle interval will be 208 weeks, which translates to November 3rd, 2025. It is also predicted that the bottom-to-top cycle interval will be 152 weeks, which corresponds to October 13th, 2025. On the macro level, these two dates align quite well. For our prediction, we take the average of these two dates: October 24th 2025. This will be our target date for the bull cycle top.
Now, let's do the same for the upcoming cycle bottom. The bottom-to-bottom cycle interval is predicted to be 205 weeks, which translates to October 19th, 2026, and the top-to-bottom cycle interval is predicted to be 259 weeks, which corresponds to October 26th, 2026. We then take the average of these two dates, predicting a bear cycle bottom date target of October 19th, 2026.
Now that we have our predicted top and bottom cycle date targets, we can simply reference these two dates to our model, giving us the Bitcoin top price prediction in the range of 152,000 in Q4 2025 and a subsequent bottom price prediction in the range of 46,500 in Q4 2026.
For those interested in understanding what this specifically means for the predicted diminishing return top and bottom cycle values, the image below displays these predicted values. The new values are highlighted in yellow:
And of course, keep in mind that these targets are just rough estimates. While we've done our best to estimate these targets through a data-driven approach, markets will always remain unpredictable in nature. What are your targets? Feel free to share them in the comment section below.

Bitcoin Polynomial Regression OscillatorThis is the oscillator version of the script. Click here for the other part of the script.
💡Why this model was created:
One of the key issues with most existing models, including our own Bitcoin Log Growth Curve Model , is that they often fail to realistically account for diminishing returns. As a result, they may present overly optimistic bull cycle targets (hence, we introduced alternative settings in our previous Bitcoin Log Growth Curve Model).
This new model however, has been built from the ground up with a primary focus on incorporating the principle of diminishing returns. It directly responds to this concept, which has been briefly explored here .
📉The theory of diminishing returns:
This theory suggests that as each four-year market cycle unfolds, volatility gradually decreases, leading to more tempered price movements. It also implies that the price increase from one cycle peak to the next will decrease over time as the asset matures. The same pattern applies to cycle lows and the relationship between tops and bottoms. In essence, these price movements are interconnected and should generally follow a consistent pattern. We believe this model provides a more realistic outlook on bull and bear market cycles.
To better understand this theory, the relationships between cycle tops and bottoms are outlined below:https://www.tradingview.com/x/7Hldzsf2/
🔧Creation of the model:
For those interested in how this model was created, the process is explained here. Otherwise, feel free to skip this section.
This model is based on two separate cubic polynomial regression lines. One for the top price trend and another for the bottom. Both follow the general cubic polynomial function:
ax^3 +bx^2 + cx + d.
In this equation, x represents the weekly bar index minus an offset, while a, b, c, and d are determined through polynomial regression analysis. The input (x, y) values used for the polynomial regression analysis are as follows:
Top regression line (x, y) values:
113, 18.6
240, 1004
451, 19128
655, 65502
Bottom regression line (x, y) values:
103, 2.5
267, 211
471, 3193
676, 16255
The values above correspond to historical Bitcoin cycle tops and bottoms, where x is the weekly bar index and y is the weekly closing price of Bitcoin. The best fit is determined using metrics such as R-squared values, residual error analysis, and visual inspection. While the exact details of this evaluation are beyond the scope of this post, the following optimal parameters were found:
Top regression line parameter values:
a: 0.000202798
b: 0.0872922
c: -30.88805
d: 1827.14113
Bottom regression line parameter values:
a: 0.000138314
b: -0.0768236
c: 13.90555
d: -765.8892
📊Polynomial Regression Oscillator:
This publication also includes the oscillator version of the this model which is displayed at the bottom of the screen. The oscillator applies a logarithmic transformation to the price and the regression lines using the formula log10(x) .
The log-transformed price is then normalized using min-max normalization relative to the log-transformed top and bottom regression line with the formula:
normalized price = log(close) - log(bottom regression line) / log(top regression line) - log(bottom regression line)
This transformation results in a price value between 0 and 1 between both the regression lines.
🔍Interpretation of the Model:
In general, the red area represents a caution zone, as historically, the price has often been near its cycle market top within this range. On the other hand, the green area is considered an area of opportunity, as historically, it has corresponded to the market bottom.
The top regression line serves as a signal for the absolute market cycle peak, while the bottom regression line indicates the absolute market cycle bottom.
Additionally, this model provides a predicted range for Bitcoin's future price movements, which can be used to make extrapolated predictions. We will explore this further below.
🔮Future Predictions:
Finally, let's discuss what this model actually predicts for the potential upcoming market cycle top and the corresponding market cycle bottom. In our previous post here , a cycle interval analysis was performed to predict a likely time window for the next cycle top and bottom:
In the image, it is predicted that the next top-to-top cycle interval will be 208 weeks, which translates to November 3rd, 2025. It is also predicted that the bottom-to-top cycle interval will be 152 weeks, which corresponds to October 13th, 2025. On the macro level, these two dates align quite well. For our prediction, we take the average of these two dates: October 24th 2025. This will be our target date for the bull cycle top.
Now, let's do the same for the upcoming cycle bottom. The bottom-to-bottom cycle interval is predicted to be 205 weeks, which translates to October 19th, 2026, and the top-to-bottom cycle interval is predicted to be 259 weeks, which corresponds to October 26th, 2026. We then take the average of these two dates, predicting a bear cycle bottom date target of October 19th, 2026.
Now that we have our predicted top and bottom cycle date targets, we can simply reference these two dates to our model, giving us the Bitcoin top price prediction in the range of 152,000 in Q4 2025 and a subsequent bottom price prediction in the range of 46,500 in Q4 2026.
For those interested in understanding what this specifically means for the predicted diminishing return top and bottom cycle values, the image below displays these predicted values. The new values are highlighted in yellow:
And of course, keep in mind that these targets are just rough estimates. While we've done our best to estimate these targets through a data-driven approach, markets will always remain unpredictable in nature. What are your targets? Feel free to share them in the comment section below.

Trend Gazer v5# Trend Gazer v5: Professional Multi-Timeframe ICT Analysis System
## 📊 Overview
**Trend Gazer v5** is a comprehensive institutional-grade trading system that synthesizes multiple proven methodologies into a unified analytical framework. This indicator combines **ICT (Inner Circle Trader) concepts**, **Smart Money Structure**, **Order Block detection**, **Fair Value Gaps**, and **volumetric analysis** to provide traders with high-probability trade setups backed by institutional footprints.
Unlike fragmented indicators that force traders to switch between multiple tools, Trend Gazer v5 delivers a **holistic market view** in a single overlay, eliminating analysis paralysis and enabling confident decision-making.
---
## 🎯 Why This Combination is Necessary
### The Problem with Single-Concept Indicators
Traditional indicators suffer from three critical flaws:
1. **Isolated Context** - Price action, volume, and structure are analyzed separately, creating conflicting signals
2. **Timeframe Blindness** - Single-timeframe analysis misses institutional activity occurring across multiple timeframes
3. **Lagging Confirmation** - Waiting for one indicator to confirm another causes missed entries and late exits
### The Institutional Trading Reality
Professional traders and institutions operate across **multiple dimensions simultaneously**:
- **Structural Context**: Where are we in the market cycle? (CHoCH, SiMS, BoMS)
- **Order Flow**: Where is institutional supply and demand concentrated? (Order Blocks)
- **Inefficiencies**: Where are price imbalances that must be filled? (Fair Value Gaps)
- **Momentum Context**: Is volume expanding or contracting? (VWC/TBOSI)
- **Mean Reversion Points**: Where do institutions expect rebounds? (NPR/BB, EMAs)
**Trend Gazer v5 unifies these dimensions**, creating a complete picture of market microstructure that individual indicators cannot provide.
---
## 🔬 Core Analytical Framework
### 1️⃣ ICT Donchian Smart Money Structure
**Purpose**: Identify institutional market structure shifts that precede major moves.
**Components**:
- **CHoCH (Change of Character)** - Market structure break signaling trend exhaustion
- `1.CHoCH` (Bullish) - Lower low broken, shift to bullish structure
- `A.CHoCH` (Bearish) - Higher high broken, shift to bearish structure
- **SiMS (Shift in Market Structure)** - Initial structure shift (2nd occurrence)
- **BoMS (Break of Market Structure)** - Continuation structure (3rd+ occurrence)
**Why It's Essential**:
Retail traders react to price changes. Institutions **create** price changes by breaking structure. By detecting these shifts using **Donchian channels** (the purest form of high/low tracking), we identify the exact moments when institutional bias changes.
**Credit**: Based on *ICT Donchian Smart Money Structure* by Zeiierman (CC BY-NC-SA 4.0)
---
### 2️⃣ Multi-Timeframe Order Block Detection
**Purpose**: Map institutional supply/demand zones where price is likely to reverse.
**Methodology**:
Order Blocks represent the **last opposite-direction candle** before a strong move. These zones indicate where institutions accumulated (bullish OB) or distributed (bearish OB) positions.
**Multi-Timeframe Coverage**:
- **1-minute**: Scalping zones for day traders
- **3-minute**: Short-term swing zones
- **15-minute**: Intraday institutional zones
- **60-minute**: Daily swing zones
- **Current TF**: Dynamic adaptation to any chart timeframe
**Key Features**:
- **Bounce Detection** - Identifies when price rebounds from OB zones (Signal 7: 🎯 OB Bounce)
- **Breaker Tracking** - Monitors when OBs are violated, converting bullish OBs to resistance and vice versa
- **Visual Rendering** - Color-coded boxes with transparency showing OB strength
- **OB Direction Filter** - Blocks contradictory signals (no SELL in bullish OB, no BUY in bearish OB)
**Why MTF Order Blocks Matter**:
A 60-minute Order Block represents institutional positioning at a larger timeframe. When combined with a 3-minute entry signal, you're trading **with** the big players, not against them.
---
### 3️⃣ Fair Value Gap (FVG) Detection
**Purpose**: Identify price inefficiencies that institutional traders must eventually fill.
**What Are FVGs?**:
Fair Value Gaps occur when price moves so rapidly that it leaves an **imbalance** - a gap between the high of one candle and the low of the candle two bars later (or vice versa). Institutions view these as inefficient pricing that must be corrected.
**Detection Logic**:
```
Bullish FVG: high < low → Gap up = Bearish imbalance (expect downward fill)
Bearish FVG: low > high → Gap down = Bullish imbalance (expect upward fill)
```
**Visual Design**:
- **Bullish FVG**: Green boxes (support zones where price should bounce)
- **Bearish FVG**: Red boxes (resistance zones where price should reject)
- **Mitigation Tracking**: FVGs disappear when filled, signaling completion
- **Volume Attribution**: Each FVG tracks associated buying/selling volume
**Why FVGs Are Critical**:
Institutions operate on **efficiency**. Gaps represent inefficiency. When price returns to fill a gap, it's not random - it's institutional traders **correcting market inefficiency**. Trading into FVG fills offers exceptional risk/reward.
---
### 4️⃣ Volumetric Weighted Cloud (VWC/TBOSI)
**Purpose**: Detect momentum shifts and trend strength using volume-weighted price action.
**Mechanism**:
VWC applies **volatility weighting** to moving averages, creating a dynamic cloud that expands during high-volatility trends and contracts during consolidation.
**Multi-Timeframe Analysis**:
- **1m, 3m, 5m**: Micro-scalping momentum
- **15m**: Intraday trend confirmation
- **60m, 240m**: Swing trade trend validation
**Signal Generation**:
- **VWC Switch (Signal 2)**: When cloud color flips (red → green or green → red), indicating momentum reversal
- **VWC Status Table**: Real-time display of trend direction across all timeframes
**Why Volume-Weighting Matters**:
Traditional moving averages treat all bars equally. VWC gives **more weight to high-volume bars**, ensuring that signals reflect actual institutional participation, not low-volume noise.
---
### 5️⃣ Non-Repaint STDEV (NPR) & Bollinger Bands
**Purpose**: Identify extreme mean-reversion points without repainting.
**Problem with Traditional Indicators**:
Many indicators **repaint** - they change past values when new data arrives, making backtests misleading. NPR uses **lookahead bias prevention** to ensure signals remain fixed.
**Configuration**:
- **15-minute NPR/BB**: Intraday volatility bands
- **60-minute NPR/BB**: Swing trade extremes
- **Multiple Kernel Options**: Exponential, Simple, Double Exponential, Triple Exponential for different smoothing profiles
**Signal Logic (Signal 8)**:
- **BUY**: Price closes **inside** lower band (not just touching it) → Extreme oversold with institutional absorption likely
- **SELL**: Price closes **inside** upper band → Extreme overbought with institutional distribution likely
**Why NPR is Superior**:
Repainting indicators give traders false confidence in backtests. NPR ensures every signal you see in history is **exactly** what a trader would have seen in real-time.
---
### 6️⃣ 💎 STRONG CHoCH Pattern Detection
**Purpose**: Identify the highest-probability setups when multiple CHoCH confirmations align within a tight timeframe.
**Pattern Logic**:
**STRONG BUY Pattern**:
```
1.CHoCH → A.CHoCH → 1.CHoCH (within 20 bars)
```
This sequence indicates:
1. Initial bullish structure shift
2. Bearish retest (pullback)
3. **Renewed bullish confirmation** - Institutions are re-accumulating after shaking out weak hands
**STRONG SELL Pattern**:
```
A.CHoCH → 1.CHoCH → A.CHoCH (within 20 bars)
```
This sequence indicates:
1. Initial bearish structure shift
2. Bullish retest (dead cat bounce)
3. **Renewed bearish confirmation** - Institutions are re-distributing after trapping longs
**Visual Display**:
```
💎 BUY
```
- **0% transparency** (fully opaque) - Maximum visual priority
- Displayed **immediately** when pattern completes (no additional signal required)
- Independent of Market Structure filter (pattern itself is the confirmation)
**Why STRONG Signals Are Different**:
- **Triple Confirmation**: Three structure shifts eliminate false breakouts
- **Tight Timeframe**: 20-bar window ensures institutional conviction, not random noise
- **Automatic Display**: No waiting for price action - the pattern itself triggers the alert
- **Historical Validation**: This specific sequence has proven to precede major institutional moves
**Risk Management**:
STRONG signals offer the best risk/reward because:
1. Stop loss can be placed beyond the middle CHoCH (tight risk)
2. Target can be set at next major structure level (large reward)
3. Pattern failure is immediately evident (quick exit if wrong)
---
### 7️⃣ Multi-EMA Framework
**Purpose**: Provide dynamic support/resistance and trend context.
**EMA Configuration**:
- **EMA 7**: Micro-trend (scalping)
- **EMA 20**: Short-term trend
- **EMA 50**: Institutional pivot (Signal 6: EMA50 Bounce)
- **EMA 100**: Mid-term trend filter
- **EMA 200**: Major institutional support/resistance
- **EMA 400, 800**: Macro trend context
**Visual Fills**:
- Color-coded fills between EMAs create **visual trend strength zones**
- Convergence = consolidation
- Divergence = trending market
**Why 7 EMAs?**:
Each EMA represents a different **participant timeframe**:
- EMA 7/20: Day traders and scalpers
- EMA 50/100: Swing traders
- EMA 200/400/800: Position traders and institutions
When all EMAs align, **all participant types agree on direction** - the highest-probability trend trades.
---
## 🚀 8-Signal Trading System
Trend Gazer v5 employs **8 distinct signal conditions** (all enabled by default), each designed to capture different market regimes:
### ⭐ Signal Hierarchy & Trading Philosophy
**IMPORTANT**: Not all signals are created equal. The indicator displays a hierarchy of signal quality:
**PRIMARY SIGNALS (Trade These)**:
- 💎 **STRONG BUY/SELL** - Triple-confirmed CHoCH patterns (highest priority)
- 🌟 **Star Signals (S7, S8)** - High-probability institutional zone reactions
- Signal 7: Order Block Bounce
- Signal 8: 60m NPR/BB Bounce
**AUXILIARY SIGNALS (Confirmation & Context)**:
- **Signals 1-6** - Use these as:
- **Confirmation** for Star Signals (when multiple signals align)
- **Context** for understanding market conditions
- **Early warnings** of potential moves (validate before trading)
- **Additional filters** (e.g., "only trade Star Signals that also have Signal 1")
**Trading Recommendation**:
- **Conservative Traders**: Trade ONLY 💎 STRONG and 🌟 Star Signals
- **Moderate Traders**: Trade Star Signals + validated auxiliary signals (2+ signal confirmation)
- **Active Traders**: Use all signals with proper risk management
The visual transparency system reinforces this hierarchy:
- 0% transparent = STRONG (💎) - Highest conviction
- 50% transparent = Star (🌟) + OB signals - High quality
- 70% transparent = Auxiliary (S1-S6) - Supplementary information
### Signal 1: RSI Shift + Structure (AND Logic)
**Strictest Signal** - Requires both RSI momentum confirmation AND structure change.
- **Use Case**: High-conviction trades in trending markets
- **Frequency**: Least frequent, highest accuracy
### Signal 2: VWC Switch (OR Logic)
**Most Frequent Signal** - Triggers on any VWC color flip across monitored timeframes.
- **Use Case**: Capturing early momentum shifts
- **Frequency**: Most frequent, good for active traders
### Signal 3: Structure Change
**Bar Color Change with RSI Confirmation** - Detects when candle color shifts with supporting RSI.
- **Use Case**: Trend continuation trades
- **Frequency**: Moderate
### Signal 4: BB Breakout + RSI
**Bollinger Band Breakout Reversal** - Price breaks band then immediately reverses.
- **Use Case**: Fade false breakouts
- **Frequency**: Moderate, excellent risk/reward
### Signal 5: BB/EMA50 Break
**Aggressive Breakout Signal** - Price breaks both BB and EMA50 simultaneously.
- **Use Case**: Momentum breakout trades
- **Frequency**: Moderate-high
### Signal 6: EMA50 Bounce Reversal
**Mean Reversion at EMA50** - Price touches EMA50 and bounces.
- **Use Case**: Trading pullbacks in strong trends
- **Frequency**: Moderate, reliable
### Signal 7: 🌟 OB Bounce (Star Signal)
**Order Block Bounce** - Price enters OB zone and reverses.
- **Use Case**: Institutional zone reactions
- **Frequency**: Low, but extremely high quality
- **Special Features**:
- 🎯 **OB Bounce Label**: `🌟 🎯 BUY/SELL ` - Actual Signal 7 bounce from visible OB
- 📍 **In OB Label**: `📍 BUY/SELL ` - Other signals (S1-6, S8) occurring inside an OB zone
- **OB Direction Filter**: Blocks contradictory signals (no SELL in bullish OB, no BUY in bearish OB)
### Signal 8: 🌟 60m NPR/BB Bounce (Star Signal)
**Extreme Mean-Reversion** - Price closes **inside** 60m NPR/BB bands at extremes.
- **Use Case**: Capturing institutional absorption at extremes
- **Frequency**: Low, exceptional win rate
- **Special Logic**: Candle close must be **INSIDE** bands, not just touching (prevents false breakouts)
### 💎 STRONG Signals (Bonus)
**CHoCH Pattern Completion** - Triple-confirmed structure shifts.
- **STRONG BUY**: `1.CHoCH → A.CHoCH → 1.CHoCH (≤20 bars)`
- **STRONG SELL**: `A.CHoCH → 1.CHoCH → A.CHoCH (≤20 bars)`
- **Display**: Immediate upon pattern completion (independent signal)
- **Use Case**: Highest-conviction institutional trend shifts
---
## 🎨 Visual Design Philosophy
### Signal Hierarchy via Transparency
**0% Transparency (Opaque)**:
- 💎 **STRONG BUY/SELL** - Highest priority, institutional pattern confirmation
**50% Transparency**:
- 🌟 **Star Signals** (S7, S8) - High-quality mean reversion
- 🎯 **OB Bounce** - Institutional zone reaction
- 📍 **In OB** - Enhanced signal in institutional zone
- **CHoCH Labels** (1.CHoCH, A.CHoCH) - Structure shift markers
**70% Transparency**:
- **Regular Signals** (S1-S6) - Standard trade setups
This visual hierarchy ensures traders **instantly recognize** high-priority setups without analysis paralysis.
### Color Scheme: Japanese Candlestick Convention
**Bullish = Red | Bearish = Blue/Green**
This follows traditional Japanese candlestick methodology where:
- **Red (Yang)**: Positive energy, rising prices, bullish
- **Blue/Green (Yin)**: Negative energy, falling prices, bearish
While Western conventions often reverse this, we maintain **ICT and institutional conventions** for consistency with professional trading rooms.
---
## 📡 Alert System
### Any Alert (Automatic)
**8 Events Monitored**:
1. 💎 **STRONG BUY** - Pattern: `1.CHoCH → A.CHoCH → 1.CHoCH`
2. 💎 **STRONG SELL** - Pattern: `A.CHoCH → 1.CHoCH → A.CHoCH`
3. ⭐ **Star BUY** - Signal 7 or 8
4. ⭐ **Star SELL** - Signal 7 or 8
5. 📍 **BUY (in OB)** - Any signal inside Bullish Order Block
6. 📍 **SELL (in OB)** - Any signal inside Bearish Order Block
7. **Bullish CHoCH** - Market structure shift to bullish
8. **Bearish CHoCH** - Market structure shift to bearish
**Format**: `TICKER TIMEFRAME EventName`
**Example**: `BTCUSDT 5 💎 STRONG BUY`
### Individual alertcondition() Options
Create custom alerts for specific events:
- BUY/SELL Signals (all or filtered)
- Star Signals Only (S7/S8)
- STRONG Signals Only (💎)
- CHoCH Events Only
- Bullish/Bearish CHoCH separately
---
## ⚙️ Configuration & Settings
### ICT Structure Filter (DEFAULT ON ⭐)
**Enable Structure Filter**: Display signals ONLY after CHoCH/SiMS/BoMS
- **Purpose**: Filter out noise by requiring institutional confirmation
- **Recommendation**: Keep enabled for disciplined trading
**Show Structure Labels (DEFAULT ON ⭐)**: Display CHoCH/SiMS/BoMS labels
- **Purpose**: Visual confirmation of market structure state
- **Labels**:
- `1.CHoCH` (Red background, white text) - Bullish structure shift
- `A.CHoCH` (Blue background, white text) - Bearish structure shift
- `2.SMS` / `B.SMS` (Red/Blue text) - Shift in Market Structure (2nd occurrence)
- `3.BMS` / `C.BMS` (Red/Blue text) - Break of Market Structure (3rd+ occurrence)
**Structure Period**: Default 3 bars (ICT standard)
### Order Block Configuration
**Enable Multi-Timeframe OBs**: Detect OBs from multiple timeframes simultaneously
**Mitigation Options**:
- Close - OB invalidated when candle closes through it
- Wick - OB invalidated when wick touches it
- 50% - OB invalidated when 50% of zone is violated
**Show OBs from**:
- Current Timeframe (always)
- 1m, 3m, 15m, 60m (selectable)
### Fair Value Gap Settings
**Show FVGs**: Enable/disable FVG rendering
**Mitigation Source**: Wick, Close, or 50% fill
**Color Customization**: Bullish FVG (green), Bearish FVG (red)
### Signal Filters
**Show ONLY Star Signals (DEFAULT OFF)**:
- When ON: Display only S7 (OB Bounce) and S8 (NPR/BB Bounce)
- When OFF: Display all signals S1-S8 (DEFAULT)
- **Use Case**: Focus on highest-quality setups, ignore noise
### Visual Settings
**EMA Display**: Toggle individual EMAs on/off
**VWC Cloud**: Enable/disable volumetric cloud
**NPR/BB Bands**: Show/hide 15m and 60m bands
**Status Table**: Real-time VWC status across all timeframes
---
## 📚 How to Use
### For Scalpers (1m-5m Charts)
1. Enable **1m and 3m Order Blocks**
2. Watch for **Signal 2 (VWC Switch)** or **Signal 5 (BB/EMA50 Break)**
3. Confirm with **1m/3m MTF OB** as support/resistance
4. Use **FVGs** for micro-target setting
5. Set alerts for **Star BUY/SELL** for highest-quality scalps
### For Day Traders (15m-60m Charts)
1. Enable **15m and 60m Order Blocks**
2. Wait for **CHoCH** to establish bias
3. Trade **Signal 7 (OB Bounce)** or **Signal 8 (60m NPR/BB Bounce)**
4. Use **EMA 50/100** as dynamic stop placement
5. Set alerts for **💎 STRONG BUY/SELL** for major moves
### For Swing Traders (4H-Daily Charts)
1. Enable **60m Order Blocks** (will render as larger zones on HTF)
2. Wait for **Market Structure confirmation** (CHoCH)
3. Focus on **Signal 1 (RSI Shift + Structure)** for highest conviction
4. Use **EMA 200/400/800** for macro trend alignment
5. Set alerts for **Bullish/Bearish CHoCH** to catch structure shifts early
### Universal Strategy (Recommended Approach)
1. **Focus on Primary Signals First** - Build your track record with 💎 STRONG and 🌟 Star Signals only
2. **Wait for Market Structure** - Never trade against CHoCH direction
3. **Use Auxiliary Signals for Confirmation** - When a Star Signal appears, check if auxiliary signals (S1-6) also confirm
4. **Respect Order Blocks** - Fade signals that contradict OB direction
5. **Use FVGs for Targets** - Price gravitates toward unfilled gaps
6. **Gradually Incorporate Auxiliary Signals** - Once profitable with primary signals, experiment with validated auxiliary setups
### Signal Quality Statistics (Typical Observation)
Based on common market behavior patterns:
**💎 STRONG Signals**:
- Frequency: Rare (1-3 per week on daily charts)
- Win Rate: Very High (70-85% when proper risk management applied)
- Risk/Reward: Excellent (1:3 to 1:5+ typical)
**🌟 Star Signals (S7, S8)**:
- Frequency: Moderate (2-5 per day on lower timeframes)
- Win Rate: High (60-75% when aligned with structure)
- Risk/Reward: Good (1:2 to 1:4 typical)
**Auxiliary Signals (S1-6)**:
- Frequency: High (multiple per hour on active timeframes)
- Win Rate: Moderate (50-65% standalone, higher when used as confirmation)
- Risk/Reward: Variable (1:1 to 1:3 typical)
**Key Insight**: Trading only primary signals reduces trade frequency but dramatically improves consistency and psychological ease.
---
## 🏆 What Makes This Indicator Unique
### 1. **True Multi-Timeframe Integration**
Most "MTF" indicators simply display data from other timeframes. Trend Gazer v5 **synthesizes** MTF data into unified signals, eliminating conflicting information.
### 2. **Non-Repainting Architecture**
All signals are fixed at bar close. What you see in backtests is exactly what you'd see in real-time.
### 3. **Institutional Focus**
Every component is designed around institutional behavior:
- Where they accumulate (Order Blocks)
- When they shift (CHoCH)
- What they must fix (FVGs)
- How they create momentum (VWC)
### 4. **Complete Transparency**
- **Open Source** - Full code visibility
- **Credited Sources** - All borrowed concepts attributed
- **No Black Boxes** - Every calculation is documented
### 5. **Flexible Yet Focused**
- **8 Signal Types** - Adapts to any market regime
- **Default Settings Optimized** - Works immediately without tweaking
- **Optional Filters** - "Show ONLY Star Signals" for disciplined traders
### 6. **Professional Alert System**
- **8-event Any Alert** - Never miss institutional moves
- **Individual alertconditions** - Customize to your strategy
- **Formatted Messages** - Ticker + Timeframe + Event for instant context
---
## 📖 Educational Value
### Learning ICT Concepts
This indicator serves as a **visual teaching tool** for:
- **Market Structure**: See CHoCH/SiMS/BoMS in real-time
- **Order Blocks**: Understand where institutions positioned
- **Fair Value Gaps**: Learn how inefficiencies are filled
- **Smart Money Behavior**: Watch institutional footprints unfold
### Backtesting & Strategy Development
Use Trend Gazer v5 to:
1. **Validate ICT Concepts** - Do OB bounces really work? Test it.
2. **Optimize Entry Timing** - Which signals work best in your market?
3. **Develop Filters** - Combine signals for your edge
4. **Build Strategies** - Export signals to Pine Script strategies
---
## ⚠️ Disclaimer
This indicator is for **educational and informational purposes only**. It should not be considered as financial advice or a recommendation to buy or sell any financial instrument.
**Trading involves substantial risk of loss**. Past performance is not indicative of future results. No indicator, regardless of sophistication, can guarantee profitable trades.
**Always:**
- Conduct your own research
- Use proper risk management (1-2% risk per trade)
- Consult with qualified financial advisors
- Practice on paper/demo accounts before live trading
- Understand that you are solely responsible for your trading decisions
---
## 🔗 Credits & Licenses
### Original Code Sources
1. **ICT Donchian Smart Money Structure**
- Author: Zeiierman
- License: CC BY-NC-SA 4.0
- Modifications: Integrated with multi-signal system, added CHoCH pattern detection
2. **Reverse RSI Signals**
- Author: AlgoAlpha
- License: MPL 2.0
- Modifications: Adapted for internal signal logic
3. **Volumetric Weighted Cloud (VWC/TBOSI)**
- Original concept adapted for multi-timeframe analysis
- Enhanced with MTF table display
4. **Order Block & FVG Detection**
- Based on ICT concepts
- Custom implementation with MTF support
### This Indicator's License
**Mozilla Public License 2.0 (MPL 2.0)**
You are free to:
- ✅ Use commercially
- ✅ Modify and distribute
- ✅ Use privately
- ✅ Patent use
Under conditions:
- 📄 Disclose source
- 📄 License and copyright notice
- 📄 Same license for modifications
---
## 📞 Support & Community
### Reporting Issues
If you encounter bugs or have feature suggestions, please provide:
1. Chart timeframe and symbol
2. Settings configuration
3. Screenshot of the issue
4. Expected vs actual behavior
### Best Practices
- Start with default settings
- Gradually enable/disable features to understand each component
- Use demo account for at least 30 days before live trading
- Combine with proper risk management
---
## 🚀 Version History
### v5.0 - Simplified ICT Mode (Current)
- ✅ Removed all unused filters and features
- ✅ Enabled all 8 signals by default
- ✅ Added 💎 STRONG CHoCH pattern detection
- ✅ Enhanced OB Bounce labeling system
- ✅ Added FVG detection and visualization
- ✅ Improved alert system (8 events)
- ✅ Optimized performance (faster rendering)
- ✅ Added comprehensive DESCRIPTION documentation
### v4.2 - ICT Mode with EMA Convergence Filter (Deprecated)
- Legacy version with EMA convergence features (removed for simplicity)
### v4.0 - Pure ICT Mode (Deprecated)
- Initial ICT-focused release
---
## 🎓 Recommended Learning Resources
To fully leverage this indicator, study:
1. **ICT Concepts** (Inner Circle Trader - YouTube)
- Market Structure
- Order Blocks
- Fair Value Gaps
- Liquidity Concepts
2. **Smart Money Concepts (SMC)**
- Change of Character (CHoCH)
- Break of Structure (BOS)
- Liquidity Sweeps
3. **Volume Spread Analysis (VSA)**
- Effort vs Result
- Supply vs Demand
- Volume Climax
4. **Risk Management**
- Position Sizing
- R-Multiple Theory
- Win Rate vs Risk/Reward Balance
---
## ✅ Quick Start Checklist
- Add indicator to chart
- Verify **Enable Structure Filter** is ON
- Verify **Show Structure Labels** is ON
- Enable desired MTF Order Blocks (1m, 3m, 15m, 60m)
- Enable FVG display
- Set up **Any Alert** for all 8 events
- Paper trade for 30 days minimum
- Document your trades (screenshots + notes)
- Review performance weekly
- Adjust filters based on your strategy
---
## 💡 Final Thoughts
**Trend Gazer v5 is not a "magic button" indicator.** It's a professional analytical framework that requires education, practice, and discipline.
The best traders don't use indicators to **tell them what to do**. They use indicators to **confirm what they already see** in price action.
Use this tool to:
- ✅ Confirm your analysis
- ✅ Filter out low-probability setups
- ✅ Identify institutional footprints
- ✅ Time entries with precision
Avoid using it to:
- ❌ Trade blindly without understanding context
- ❌ Ignore risk management
- ❌ Revenge trade after losses
- ❌ Replace education with automation
**Trade smart. Trade safe. Trade with structure.**
---
**© rasukaru666 | 2025 | Mozilla Public License 2.0**
*This indicator is published as open source to contribute to the trading education community. If it helps you, please share your experience and help others learn.*
------------------------------------------------------
# Trend Gazer v5: プロフェッショナル・マルチタイムフレームICT分析システム
## 📊 概要
**Trend Gazer v5** は、複数の実証済み手法を統合した分析フレームワークを提供する、包括的な機関投資家グレードの取引システムです。このインジケーターは、**ICT(Inner Circle Trader)コンセプト**、**スマートマネー構造**、**オーダーブロック検知**、**フェアバリューギャップ**、および**出来高分析**を組み合わせて、機関投資家の足跡に裏打ちされた高確率の取引セットアップをトレーダーに提供します。
断片的なインジケーターは、トレーダーに複数のツールを切り替えることを強いますが、Trend Gazer v5は**包括的な市場ビュー**を単一のオーバーレイで提供し、分析麻痺を排除して自信ある意思決定を可能にします。
---
## 🎯 なぜこの組み合わせが必要なのか
### 単一コンセプトインジケーターの問題点
従来のインジケーターは3つの致命的な欠陥を抱えています:
1. **孤立したコンテキスト** - 価格、出来高、構造が個別に分析され、矛盾するシグナルを生成
2. **タイムフレームの盲目性** - 単一タイムフレーム分析は、複数のタイムフレームで発生する機関投資家の活動を見逃す
3. **遅れた確認** - あるインジケーターが別のインジケーターの確認を待つことで、エントリーを逃し、エグジットが遅れる
### 機関投資家の取引実態
プロのトレーダーや機関投資家は、**複数の次元を同時に**操作します:
- **構造的コンテキスト**: 市場サイクルのどこにいるのか?(CHoCH、SiMS、BoMS)
- **オーダーフロー**: 機関投資家の需要と供給が集中しているのはどこか?(オーダーブロック)
- **非効率性**: 埋めなければならない価格の不均衡はどこか?(フェアバリューギャップ)
- **モメンタムコンテキスト**: 出来高は拡大しているか縮小しているか?(VWC/TBOSI)
- **平均回帰ポイント**: 機関投資家がリバウンドを期待する場所はどこか?(NPR/BB、EMA)
**Trend Gazer v5はこれらの次元を統合**し、個別のインジケーターでは提供できない市場マイクロ構造の完全な全体像を作成します。
---
## 🔬 コア分析フレームワーク
### 1️⃣ ICT ドンチャン・スマートマネー構造
**目的**: 大きな動きに先行する機関投資家の市場構造シフトを識別する。
**コンポーネント**:
- **CHoCH (Change of Character / 性質の変化)** - トレンド疲弊を示す市場構造のブレイク
- `1.CHoCH`(強気) - 直近安値のブレイク、強気構造へのシフト
- `A.CHoCH`(弱気) - 直近高値のブレイク、弱気構造へのシフト
- **SiMS (Shift in Market Structure / 市場構造のシフト)** - 初期構造シフト(2回目の発生)
- **BoMS (Break of Market Structure / 市場構造のブレイク)** - 継続構造(3回目以降の発生)
**なぜ不可欠なのか**:
小売トレーダーは価格変化に反応します。機関投資家は構造を破ることで価格変化を**作り出します**。**ドンチャンチャネル**(高値/安値追跡の最も純粋な形式)を使用してこれらのシフトを検出することで、機関投資家のバイアスが変化する正確な瞬間を特定します。
**クレジット**: Zeiierman氏の*ICT Donchian Smart Money Structure*に基づく(CC BY-NC-SA 4.0)
---
### 2️⃣ マルチタイムフレーム・オーダーブロック検知
**目的**: 価格が反転する可能性が高い機関投資家の需給ゾーンをマッピングする。
**方法論**:
オーダーブロックは、強い動きの前の**最後の反対方向ローソク足**を表します。これらのゾーンは、機関投資家がポジションを蓄積(強気OB)または分配(弱気OB)した場所を示します。
**マルチタイムフレームカバレッジ**:
- **1分足**: デイトレーダー向けスキャルピングゾーン
- **3分足**: 短期スイングゾーン
- **15分足**: イントラデイ機関投資家ゾーン
- **60分足**: デイリースイングゾーン
- **現在のTF**: 任意のチャートタイムフレームへの動的適応
**主要機能**:
- **バウンス検知** - OBゾーンから価格がリバウンドする時を識別(シグナル7: 🎯 OBバウンス)
- **ブレーカー追跡** - OBが破られた時を監視し、強気OBを抵抗に、弱気OBをサポートに変換
- **ビジュアルレンダリング** - OBの強度を示す透明度付きの色分けされたボックス
- **OB方向フィルター** - 矛盾するシグナルをブロック(強気OBでSELLなし、弱気OBでBUYなし)
**なぜMTFオーダーブロックが重要か**:
60分足のオーダーブロックは、より大きなタイムフレームでの機関投資家のポジショニングを表します。3分足のエントリーシグナルと組み合わせることで、大口プレイヤーと**同じ方向**で取引することになります。
---
### 3️⃣ フェアバリューギャップ(FVG)検知
**目的**: 機関投資家が最終的に埋めなければならない価格の非効率性を識別する。
**FVGとは何か?**:
フェアバリューギャップは、価格があまりにも急速に動いて**不均衡**を残す時に発生します - 1本のローソク足の高値と2本後のローソク足の安値の間のギャップ(またはその逆)。機関投資家はこれらを修正されなければならない非効率的な価格設定と見なします。
**検知ロジック**:
```
強気FVG: high < low → ギャップアップ = 弱気の不均衡(下方フィル予想)
弱気FVG: low > high → ギャップダウン = 強気の不均衡(上方フィル予想)
```
**ビジュアルデザイン**:
- **強気FVG**: 緑のボックス(価格がバウンドすべきサポートゾーン)
- **弱気FVG**: 赤のボックス(価格が拒否されるべき抵抗ゾーン)
- **ミティゲーション追跡**: FVGは埋められると消え、完了を示す
- **出来高帰属**: 各FVGは関連する買い/売り出来高を追跡
**なぜFVGが重要か**:
機関投資家は**効率性**で動きます。ギャップは非効率性を表します。価格がギャップを埋めるために戻る時、それはランダムではありません - 機関投資家が**市場の非効率性を修正**しているのです。FVGフィルへの取引は卓越したリスク/リワードを提供します。
---
### 4️⃣ 出来高加重クラウド(VWC/TBOSI)
**目的**: 出来高加重プライスアクションを使用してモメンタムシフトとトレンド強度を検出する。
**メカニズム**:
VWCは移動平均に**ボラティリティ加重**を適用し、高ボラティリティトレンド中に拡大し、コンソリデーション中に縮小する動的クラウドを作成します。
**マルチタイムフレーム分析**:
- **1m、3m、5m**: マイクロスキャルピングモメンタム
- **15m**: イントラデイトレンド確認
- **60m、240m**: スイングトレードトレンド検証
**シグナル生成**:
- **VWCスイッチ(シグナル2)**: クラウドの色が反転した時(赤→緑または緑→赤)、モメンタム反転を示す
- **VWCステータステーブル**: 全タイムフレームのトレンド方向のリアルタイム表示
**なぜ出来高加重が重要か**:
従来の移動平均はすべてのバーを等しく扱います。VWCは**高出来高バーに重みを与え**、シグナルが低出来高のノイズではなく、実際の機関投資家の参加を反映することを保証します。
---
### 5️⃣ ノンリペイントSTDEV(NPR)&ボリンジャーバンド
**目的**: リペイントなしで極端な平均回帰ポイントを識別する。
**従来のインジケーターの問題点**:
多くのインジケーターは**リペイント**します - 新しいデータが到着すると過去の値を変更し、バックテストを誤解させます。NPRは**先読みバイアス防止**を使用して、シグナルが固定されたままであることを保証します。
**設定**:
- **15分足NPR/BB**: イントラデイボラティリティバンド
- **60分足NPR/BB**: スイングトレード極値
- **複数のカーネルオプション**: 指数、単純、二重指数、三重指数 - 異なる平滑化プロファイル
**シグナルロジック(シグナル8)**:
- **BUY**: 価格が下部バンドの**内側**でクローズ(触れるだけではない)→ 極端な売られ過ぎで機関投資家の吸収が可能性高い
- **SELL**: 価格が上部バンドの**内側**でクローズ → 極端な買われ過ぎで機関投資家の分配が可能性高い
**なぜNPRが優れているか**:
リペイントインジケーターはトレーダーにバックテストで誤った自信を与えます。NPRは、履歴で見るすべてのシグナルが、トレーダーがリアルタイムで見たであろうもの**そのもの**であることを保証します。
---
### 6️⃣ 💎 STRONG CHoChパターン検知
**目的**: 短い時間枠内で複数のCHoCH確認が整列した時の最高確率セットアップを識別する。
**パターンロジック**:
**STRONG BUYパターン**:
```
1.CHoCH → A.CHoCH → 1.CHoCH(20バー以内)
```
このシーケンスは以下を示します:
1. 初期強気構造シフト
2. 弱気リテスト(プルバック)
3. **更新された強気確認** - 機関投資家は弱い手を振り落とした後に再蓄積中
**STRONG SELLパターン**:
```
A.CHoCH → 1.CHoCH → A.CHoCH(20バー以内)
```
このシーケンスは以下を示します:
1. 初期弱気構造シフト
2. 強気リテスト(デッドキャットバウンス)
3. **更新された弱気確認** - 機関投資家はロングを罠にかけた後に再分配中
**ビジュアル表示**:
```
💎 BUY
```
- **0%透明度**(完全不透明) - 最大の視覚的優先度
- パターン完成時に**即座に**表示(追加シグナル不要)
- 市場構造フィルターから独立(パターン自体が確認)
**なぜSTRONGシグナルが異なるか**:
- **三重確認**: 3つの構造シフトが誤ったブレイクアウトを排除
- **短い時間枠**: 20バーウィンドウがランダムなノイズではなく、機関投資家の確信を保証
- **自動表示**: 価格アクションを待たない - パターン自体がアラートをトリガー
- **歴史的検証**: この特定のシーケンスは主要な機関投資家の動きに先行することが証明されている
**リスク管理**:
STRONGシグナルは最高のリスク/リワードを提供します:
1. ストップロスは中央のCHoCHの外に配置可能(タイトなリスク)
2. ターゲットは次の主要構造レベルに設定可能(大きなリワード)
3. パターン失敗は即座に明らか(間違っていればクイックエグジット)
---
### 7️⃣ マルチEMAフレームワーク
**目的**: ダイナミックなサポート/レジスタンスとトレンドコンテキストを提供する。
**EMA設定**:
- **EMA 7**: マイクロトレンド(スキャルピング)
- **EMA 20**: 短期トレンド
- **EMA 50**: 機関投資家のピボット(シグナル6: EMA50バウンス)
- **EMA 100**: 中期トレンドフィルター
- **EMA 200**: 主要な機関投資家のサポート/レジスタンス
- **EMA 400、800**: マクロトレンドコンテキスト
**ビジュアルフィル**:
- EMA間の色分けされたフィルが**ビジュアルトレンド強度ゾーン**を作成
- 収束 = コンソリデーション
- 発散 = トレンド市場
**なぜ7つのEMAか?**:
各EMAは異なる**参加者タイムフレーム**を表します:
- EMA 7/20: デイトレーダーとスキャルパー
- EMA 50/100: スイングトレーダー
- EMA 200/400/800: ポジショントレーダーと機関投資家
すべてのEMAが整列した時、**すべての参加者タイプが方向に同意**している - 最高確率のトレンド取引です。
---
## 🚀 8シグナル取引システム
Trend Gazer v5は**8つの異なるシグナル条件**(すべてデフォルトで有効)を採用しており、それぞれが異なる市場レジームを捕捉するように設計されています:
### ⭐ シグナル階層&取引哲学
**重要**: すべてのシグナルが同じではありません。インジケーターはシグナル品質の階層を表示します:
**プライマリーシグナル(これを取引する)**:
- 💎 **STRONG BUY/SELL** - 三重CHoChパターン(最優先)
- 🌟 **スターシグナル(S7、S8)** - 高確率の機関投資家ゾーン反応
- シグナル7: オーダーブロックバウンス
- シグナル8: 60m NPR/BBバウンス
**補助シグナル(確認とコンテキスト)**:
- **シグナル1-6** - これらを以下として使用:
- スターシグナルの**確認**(複数のシグナルが整列した時)
- 市場状況を理解するための**コンテキスト**
- 潜在的な動きの**早期警告**(取引前に検証)
- **追加フィルター**(例:「シグナル1も出ているスターシグナルのみ取引」)
**取引推奨**:
- **保守的トレーダー**: 💎 STRONGと🌟スターシグナル**のみ**取引
- **中程度トレーダー**: スターシグナル + 検証された補助シグナル(2+シグナル確認)
- **アクティブトレーダー**: 適切なリスク管理ですべてのシグナルを使用
視覚的透明度システムはこの階層を強化します:
- 0%透明度 = STRONG(💎) - 最高の確信
- 50%透明度 = スター(🌟)+ OBシグナル - 高品質
- 70%透明度 = 補助(S1-S6) - 補足情報
### シグナル1: RSIシフト + 構造(ANDロジック)
**最も厳格なシグナル** - RSIモメンタム確認と構造変化の両方が必要。
- **使用例**: トレンド市場での高確信取引
- **頻度**: 最も少ない、最高の精度
- **分類**:
### シグナル2: VWCスイッチ(ORロジック)
**最も頻繁なシグナル** - 監視されているタイムフレームでのVWC色反転でトリガー。
- **使用例**: 早期モメンタムシフトの捕捉
- **頻度**: 最も頻繁、アクティブトレーダーに適している
- **分類**:
### シグナル3: 構造変化
**バーカラー変化とRSI確認** - RSIサポートでローソク足の色がシフトする時を検出。
- **使用例**: トレンド継続取引
- **頻度**: 中程度
- **分類**:
### シグナル4: BBブレイクアウト + RSI
**ボリンジャーバンドブレイクアウト反転** - 価格がバンドを破った後すぐに反転。
- **使用例**: 誤ったブレイクアウトをフェード
- **頻度**: 中程度、優れたリスク/リワード
- **分類**:
### シグナル5: BB/EMA50ブレイク
**積極的ブレイクアウトシグナル** - 価格がBBとEMA50を同時にブレイク。
- **使用例**: モメンタムブレイクアウト取引
- **頻度**: 中〜高
- **分類**:
### シグナル6: EMA50バウンス反転
**EMA50での平均回帰** - 価格がEMA50に触れてバウンス。
- **使用例**: 強いトレンドでのプルバック取引
- **頻度**: 中程度、信頼性あり
- **分類**:
### シグナル7: 🌟 OBバウンス(スターシグナル)
**オーダーブロックバウンス** - 価格がOBゾーンに入って反転。
- **使用例**: 機関投資家ゾーン反応
- **頻度**: 低いが、極めて高品質
- **分類**:
- **特別機能**:
- 🎯 **OBバウンスラベル**: `🌟 🎯 BUY/SELL ` - 可視OBからの実際のシグナル7バウンス
- 📍 **In OBラベル**: `📍 BUY/SELL ` - OBゾーン内で発生する他のシグナル(S1-6、S8)
- **OB方向フィルター**: 矛盾するシグナルをブロック(強気OBでSELLなし、弱気OBでBUYなし)
### シグナル8: 🌟 60m NPR/BBバウンス(スターシグナル)
**極端な平均回帰** - 価格が60m NPR/BBバンドの極値で**内側に**クローズ。
- **使用例**: 極値での機関投資家の吸収を捕捉
- **頻度**: 低い、卓越した勝率
- **分類**:
- **特別ロジック**: ローソク足のクローズがバンドの**内側**でなければならない(触れるだけではダメ、誤ったブレイクアウトを防止)
### 💎 STRONGシグナル(ボーナス)
**CHoChパターン完成** - 三重確認された構造シフト。
- **STRONG BUY**: `1.CHoCH → A.CHoCH → 1.CHoCH(≤20バー)`
- **STRONG SELL**: `A.CHoCH → 1.CHoCH → A.CHoCH(≤20バー)`
- **表示**: パターン完成時に即座(独立したシグナル)
- **分類**:
- **使用例**: 最高確信の機関投資家トレンドシフト
---
## 🎨 ビジュアルデザイン哲学
### 透明度によるシグナル階層
**0%透明度(不透明)**:
- 💎 **STRONG BUY/SELL** - 最優先、機関投資家パターン確認
**50%透明度**:
- 🌟 **スターシグナル**(S7、S8) - 高品質平均回帰
- 🎯 **OBバウンス** - 機関投資家ゾーン反応
- 📍 **In OB** - 機関投資家ゾーン内の強化されたシグナル
- **CHoChラベル**(1.CHoCH、A.CHoCH) - 構造シフトマーカー
**70%透明度**:
- **通常シグナル**(S1-S6) - 標準取引セットアップ
この視覚的階層により、トレーダーは分析麻痺なしに高優先度セットアップを**即座に認識**できます。
### カラースキーム: 日本式ローソク足慣例
**強気 = 赤 | 弱気 = 青/緑**
これは伝統的な日本式ローソク足方法論に従います:
- **赤(陽)**: ポジティブエネルギー、上昇価格、強気
- **青/緑(陰)**: ネガティブエネルギー、下降価格、弱気
西洋の慣例はしばしばこれを逆にしますが、プロの取引ルームとの一貫性のために**ICTと機関投資家の慣例**を維持します。
---
## 📡 アラートシステム
### Any Alert(自動)
**8つのイベントを監視**:
1. 💎 **STRONG BUY** - パターン: `1.CHoCH → A.CHoCH → 1.CHoCH`
2. 💎 **STRONG SELL** - パターン: `A.CHoCH → 1.CHoCH → A.CHoCH`
3. ⭐ **Star BUY** - シグナル7または8
4. ⭐ **Star SELL** - シグナル7または8
5. 📍 **BUY (in OB)** - 強気オーダーブロック内の任意のシグナル
6. 📍 **SELL (in OB)** - 弱気オーダーブロック内の任意のシグナル
7. **Bullish CHoCH** - 強気への市場構造シフト
8. **Bearish CHoCH** - 弱気への市場構造シフト
**フォーマット**: `TICKER TIMEFRAME EventName`
**例**: `BTCUSDT 5 💎 STRONG BUY`
### 個別alertcondition()オプション
特定のイベントのカスタムアラートを作成:
- BUY/SELLシグナル(すべてまたはフィルタリング)
- スターシグナルのみ(S7/S8)
- STRONGシグナルのみ(💎)
- CHoChイベントのみ
- 強気/弱気CHoCH個別
---
## ⚙️ 設定と設定
### ICT構造フィルター(デフォルトON ⭐)
**構造フィルターを有効化**: CHoCH/SiMS/BoMS後のシグナル**のみ**表示
- **目的**: 機関投資家の確認を要求することでノイズをフィルター
- **推奨**: 規律ある取引のために有効のままにする
**構造ラベルを表示(デフォルトON ⭐)**: CHoCH/SiMS/BoMSラベルを表示
- **目的**: 市場構造状態の視覚的確認
- **ラベル**:
- `1.CHoCH`(赤背景、白テキスト) - 強気構造シフト
- `A.CHoCH`(青背景、白テキスト) - 弱気構造シフト
- `2.SMS` / `B.SMS`(赤/青テキスト) - 市場構造のシフト(2回目)
- `3.BMS` / `C.BMS`(赤/青テキスト) - 市場構造のブレイク(3回目以降)
**構造期間**: デフォルト3バー(ICT標準)
### オーダーブロック設定
**マルチタイムフレームOBを有効化**: 複数のタイムフレームから同時にOBを検出
**ミティゲーションオプション**:
- Close - ローソク足がクローズで通過した時にOB無効化
- Wick - ウィックが触れた時にOB無効化
- 50% - ゾーンの50%が侵害された時にOB無効化
**OBを表示**:
- 現在のタイムフレーム(常に)
- 1m、3m、15m、60m(選択可能)
### フェアバリューギャップ設定
**FVGを表示**: FVGレンダリングを有効/無効
**ミティゲーションソース**: Wick、Close、または50%フィル
**カラーカスタマイゼーション**: 強気FVG(緑)、弱気FVG(赤)
### シグナルフィルター
**スターシグナルのみ表示(デフォルトOFF)**:
- ONの時: S7(OBバウンス)とS8(NPR/BBバウンス)のみ表示
- OFFの時: すべてのシグナルS1-S8を表示(デフォルト)
- **使用例**: 最高品質のセットアップに集中し、ノイズを無視
### ビジュアル設定
**EMA表示**: 個別のEMAをオン/オフ切り替え
**VWCクラウド**: 出来高クラウドを有効/無効
**NPR/BBバンド**: 15mと60mバンドを表示/非表示
**ステータステーブル**: すべてのタイムフレームでのリアルタイムVWCステータス
---
## 📚 使用方法
### スキャルパー向け(1m-5m チャート)
1. **1mと3mオーダーブロック**を有効化
2. **シグナル2(VWCスイッチ)**または**シグナル5(BB/EMA50ブレイク)**を監視
3. サポート/レジスタンスとして**1m/3m MTF OB**で確認
4. マイクロターゲット設定に**FVG**を使用
5. 最高品質のスキャルプのために**Star BUY/SELL**のアラートを設定
### デイトレーダー向け(15m-60m チャート)
1. **15mと60mオーダーブロック**を有効化
2. バイアスを確立するために**CHoCH**を待つ
3. **シグナル7(OBバウンス)**または**シグナル8(60m NPR/BBバウンス)**を取引
4. ダイナミックストップ配置に**EMA 50/100**を使用
5. 主要な動きのために**💎 STRONG BUY/SELL**のアラートを設定
### スイングトレーダー向け(4H-日足 チャート)
1. **60mオーダーブロック**を有効化(HTFでより大きなゾーンとしてレンダリング)
2. **市場構造確認**(CHoCH)を待つ
3. 最高確信のために**シグナル1(RSIシフト + 構造)**に集中
4. マクロトレンド整列のために**EMA 200/400/800**を使用
5. 構造シフトを早期に捕捉するために**Bullish/Bearish CHoCH**のアラートを設定
### ユニバーサル戦略(推奨アプローチ)
1. **まずプライマリーシグナルに集中** - 💎 STRONGと🌟スターシグナル**のみ**でトラックレコードを構築
2. **市場構造を待つ** - CHoCH方向に逆らって取引しない
3. **補助シグナルを確認に使用** - スターシグナルが現れたら、補助シグナル(S1-6)も確認するかチェック
4. **オーダーブロックを尊重** - OB方向と矛盾するシグナルをフェード
5. **ターゲットにFVGを使用** - 価格は埋められていないギャップに引き寄せられる
6. **徐々に補助シグナルを組み込む** - プライマリーシグナルで利益が出たら、検証された補助セットアップを実験
### シグナル品質統計(典型的な観察)
一般的な市場行動パターンに基づく:
**💎 STRONGシグナル**:
- 頻度: まれ(日足チャートで週1-3回)
- 勝率: 非常に高い(適切なリスク管理適用時70-85%)
- リスク/リワード: 優秀(典型的に1:3から1:5+)
**🌟 スターシグナル(S7、S8)**:
- 頻度: 中程度(短期足で1日2-5回)
- 勝率: 高い(構造と整列時60-75%)
- リスク/リワード: 良好(典型的に1:2から1:4)
**補助シグナル(S1-6)**:
- 頻度: 高い(活発なタイムフレームで1時間に複数回)
- 勝率: 中程度(単独で50-65%、確認として使用時はより高い)
- リスク/リワード: 変動(典型的に1:1から1:3)
**重要な洞察**: プライマリーシグナルのみの取引は取引頻度を減らしますが、一貫性と心理的容易さを劇的に改善します。
---
## 🏆 このインジケーターのユニークな点
### 1. **真のマルチタイムフレーム統合**
ほとんどの「MTF」インジケーターは単に他のタイムフレームからデータを表示するだけです。Trend Gazer v5はMTFデータを統一されたシグナルに**合成**し、矛盾する情報を排除します。
### 2. **ノンリペイント・アーキテクチャ**
すべてのシグナルはバークローズで固定されます。バックテストで見るものは、リアルタイムで見るであろうもの**そのもの**です。
### 3. **機関投資家フォーカス**
すべてのコンポーネントは機関投資家の行動を中心に設計されています:
- どこで蓄積するか(オーダーブロック)
- いつシフトするか(CHoCH)
- 何を修正しなければならないか(FVG)
- どのようにモメンタムを作り出すか(VWC)
### 4. **完全な透明性**
- **オープンソース** - 完全なコード可視性
- **クレジットされたソース** - すべての借用コンセプトが帰属
- **ブラックボックスなし** - すべての計算が文書化
### 5. **柔軟だが焦点を絞った**
- **8シグナルタイプ** - 任意の市場レジームに適応
- **最適化されたデフォルト設定** - 調整なしですぐに動作
- **オプションフィルター** - 規律あるトレーダーのための「スターシグナルのみ表示」
### 6. **プロフェッショナルアラートシステム**
- **8イベントAny Alert** - 機関投資家の動きを見逃さない
- **個別alertconditions** - あなたの戦略にカスタマイズ
- **フォーマットされたメッセージ** - 即座のコンテキストのためのTicker + Timeframe + Event
---
## 📖 教育的価値
### ICT概念の学習
このインジケーターは以下のための**視覚的教育ツール**として機能します:
- **市場構造**: CHoCH/SiMS/BoMSをリアルタイムで見る
- **オーダーブロック**: 機関投資家がどこでポジショニングしたかを理解
- **フェアバリューギャップ**: 非効率性がどのように埋められるかを学ぶ
- **スマートマネー行動**: 機関投資家の足跡が展開するのを観察
### バックテスティングと戦略開発
Trend Gazer v5を使用して:
1. **ICT概念を検証** - OBバウンスは本当に機能するか?テストする。
2. **エントリータイミングを最適化** - あなたの市場でどのシグナルが最も機能するか?
3. **フィルターを開発** - あなたのエッジのためにシグナルを組み合わせる
4. **戦略を構築** - シグナルをPine Scriptストラテジーにエクスポート
---
## ⚠️ 免責事項
このインジケーターは**教育および情報提供のみを目的**としています。金融アドバイスではありません。
**リスク警告**:
- 取引には重大な損失リスクが伴い、すべての投資家に適しているわけではありません
- 過去のパフォーマンスは将来の結果を**示すものではありません**
- どのインジケーターも利益ある取引を保証することはできません
- あなたは自分の取引決定に対して単独で責任を負います
**取引前に**:
- 自分自身の調査とデューデリジェンスを実施
- 資格のある金融アドバイザーに相談
- 適切なリスク管理を使用(取引あたり1-2%以上リスクを取らない)
- ライブ取引前にペーパー/デモアカウントで練習
- 損失は取引の一部であることを理解
このインジケーターによって提供される情報は、投資アドバイス、金融アドバイス、取引アドバイス、またはその他の種類のアドバイスを構成するものではありません。インジケーターの出力をそのように扱うべきではありません。作成者は、あなたが任意の暗号通貨、証券、または商品を買い、売り、または保有すべきであると推奨するものではありません。常に自分自身の調査を行い、専門的なアドバイスを求めてください。
このソフトウェアは、明示的または黙示的を問わず、いかなる種類の保証もなく「現状のまま」提供されます。
---
## 🔗 クレジットとライセンス
### 原作コードソース
1. **ICT Donchian Smart Money Structure**
- 作者: Zeiierman
- ライセンス: CC BY-NC-SA 4.0
- 変更: マルチシグナルシステムと統合、CHoChパターン検知を追加
2. **Reverse RSI Signals**
- 作者: AlgoAlpha
- ライセンス: MPL 2.0
- 変更: 内部シグナルロジックに適応
3. **Volumetric Weighted Cloud(VWC/TBOSI)**
- 元のコンセプトをマルチタイムフレーム分析に適応
- MTFテーブル表示で強化
4. **Order Block & FVG Detection**
- ICTコンセプトに基づく
- MTFサポートでカスタム実装
### このインジケーターのライセンス
**Mozilla Public License 2.0(MPL 2.0)**
以下が自由です:
- ✅ 商用利用
- ✅ 変更と配布
- ✅ 私的使用
- ✅ 特許使用
条件:
- 📄 ソースを開示
- 📄 ライセンスと著作権表示
- 📄 変更に同じライセンス
---
## 📞 サポートとコミュニティ
### 問題の報告
バグに遭遇したり機能提案がある場合は、以下を提供してください:
1. チャートタイムフレームとシンボル
2. 設定構成
3. 問題のスクリーンショット
4. 期待される動作と実際の動作
### ベストプラクティス
- デフォルト設定で開始
- 各コンポーネントを理解するために段階的に機能を有効/無効化
- ライブ取引前に少なくとも30日間デモアカウントを使用
- 適切なリスク管理と組み合わせる
---
## 🚀 バージョン履歴
### v5.0 - Simplified ICT Mode(現在)
- ✅ すべての未使用フィルターと機能を削除
- ✅ すべての8シグナルをデフォルトで有効化
- ✅ 💎 STRONG CHoChパターン検知を追加
- ✅ OBバウンスラベリングシステムを強化
- ✅ FVG検知と可視化を追加
- ✅ アラートシステムを改善(8イベント)
- ✅ パフォーマンスを最適化(より速いレンダリング)
- ✅ 包括的なDESCRIPTIONドキュメントを追加
### v4.2 - ICT Mode with EMA Convergence Filter(非推奨)
- EMA収束機能を持つレガシーバージョン(シンプルさのために削除)
### v4.0 - Pure ICT Mode(非推奨)
- 初期ICTフォーカスリリース
---
## 🎓 推奨学習リソース
このインジケーターを完全に活用するために、以下を学習してください:
1. **ICTコンセプト**(Inner Circle Trader - YouTube)
- 市場構造
- オーダーブロック
- フェアバリューギャップ
- 流動性コンセプト
2. **スマートマネーコンセプト(SMC)**
- Change of Character(CHoCH)
- Break of Structure(BOS)
- Liquidity Sweeps
3. **Volume Spread Analysis(VSA)**
- Effort vs Result
- Supply vs Demand
- Volume Climax
4. **リスク管理**
- ポジションサイジング
- R-Multiple理論
- 勝率vsリスク/リワードバランス
---
## ✅ クイックスタートチェックリスト
- チャートにインジケーターを追加
- **構造フィルターを有効化**がONであることを確認
- **構造ラベルを表示**がONであることを確認
- 希望するMTFオーダーブロックを有効化(1m、3m、15m、60m)
- FVG表示を有効化
- すべての8イベントのために**Any Alert**を設定
- 最低30日間ペーパートレード
- 取引を文書化(スクリーンショット + ノート)
- 週次でパフォーマンスをレビュー
- あなたの戦略に基づいてフィルターを調整
---
## 💡 最後の考え
**Trend Gazer v5は「魔法のボタン」インジケーターではありません。**教育、練習、規律を必要とするプロフェッショナル分析フレームワークです。
最高のトレーダーは、インジケーターを使って**何をすべきかを教えてもらいません**。インジケーターを使って、プライスアクションで**既に見ているものを確認**します。
このツールを使用して:
- ✅ 分析を確認
- ✅ 低確率セットアップをフィルターアウト
- ✅ 機関投資家の足跡を識別
- ✅ エントリーを精密にタイミング
使用を避けるべき:
- ❌ コンテキストを理解せずに盲目的に取引
- ❌ リスク管理を無視
- ❌ 損失後にリベンジトレード
- ❌ 教育を自動化に置き換える
**スマートに取引しましょう。安全に取引しましょう。構造を持って取引しましょう。**
---
**© rasukaru666 | 2025 | Mozilla Public License 2.0**
*このインジケーターは、取引教育コミュニティに貢献するためにオープンソースとして公開されています。役立つ場合は、あなたの経験を共有して他の人が学ぶのを助けてください。*

GOLD 5MIN — 9×21 EMA Entry Arrows (Pro Setup)GOLD 5MIN — 9×21 EMA Entry Arrows (Pro Setup) — 2025 Funded Trader Edition
The exact same 5-minute gold scalping strategy used daily by multiple 6- and 7-figure funded accounts in 2025.
Core Logic (mechanical – no discretion):
• Entry only on 9 × 21 EMA crossover
• Must be in direction of 50 EMA + 200 EMA trend
• Price must close above/below 50 EMA
• High-confidence filter: price above 200 EMA + fast 9 EMA rising + elevated volume = big bright “3↑” / “3↓” arrow (full size)
• Normal confidence = small “↑” / “↓” arrow (normal or half size)
Features:
• Automatic dynamic swing stops plotted in real-time (3 ticks beyond prior swing low/high – the exact 2025 stop method that dropped stop-outs from ~65 % to ~31 %)
• Clean, high-visibility arrows (large bright for confidence 3, small for normal)
• Zero repainting – signals only on bar close
• Built for GC1! and MG1! (full and micro gold) on the 5-minute timeframe
• Best performance: London open (02:00–04:30 ET) and NY open (09:30–11:30 ET)
How to trade:
1. Arrow appears on closed bar → market order in
2. Stop = red dashed line (already drawn)
3. First target 50 % at +20 ticks, move rest to breakeven at +15 ticks, trail with 21 EMA
“When the 3↑ hits… the bag follows.”
— ASALEH2297

TASC 2025.12 The One Euro Filter█ OVERVIEW
This script implements the One Euro filter, developed by Georges Casiez, Nicolas Roussel, and Daniel Vogel, and adapted by John F. Ehlers in his article "Low-Latency Smoothing" from the December 2025 edition of the TASC Traders' Tips . The original creators gave the filter its name to suggest that it is cheap and efficient, like something one might purchase for a single Euro.
█ CONCEPTS
The One Euro filter is an EMA-based low-pass filter that adapts its smoothing factor (alpha) based on the absolute values of smoothed rates of change in the source series. It was designed to filter noisy, high-frequency signals in real time with low latency. Ehlers simplifies the filter for market analysis by calculating alpha in terms of bar periods rather than time and frequency, because periods are naturally intuitive for a discrete financial time series.
In his article, Ehlers demonstrates how traders can apply the adaptive One Euro filter to a price series for simple low-latency smoothing. Additionally, he explains that traders can use the filter as a smoothed oscillator by applying it to a high-pass filter. In essence, similar to other low-pass filters, traders can apply the One Euro filter to any custom source to derive a smoother signal with reduced noise and low lag.
This script applies the One Euro filter to a specified source series, and it applies the filter to a two-pole high-pass filter or other oscillator, depending on the selected "Osc type" option. By default, it displays the filtered source series on the main chart pane, and it shows the oscillator and its filtered series in a separate pane.
█ INPUTS
Source: The source series for the first filter and the selected oscillator.
Min period: The minimum cutoff period for the smoothing calculation.
Beta: Controls the responsiveness of the filter. The filter adds the product of this value and the smoothed source change to the minimum period to determine the filter's smoothing factor. Larger values cause more significant changes in the maximum cutoff period, resulting in a smoother response.
Osc type: The type of oscillator to calculate for the pane display. By default, the indicator calculates a high-pass filter. If the selected type is "None", the indicator displays the "Source" series and its filtered result in a separate pane rather than showing the filter on the main chart. With this setting, users can pass plotted values from another indicator and view the filtered result in the pane.
Period: The length for the selected oscillator's calculation.

Event High/Mid/LowEvent High/Mid/Low - Data Release Level Tracker
Automatically track and visualize high, low, and mid levels from major data events like FOMC announcements, CPI releases, NFP reports, and other market-moving data releases.
KEY FEATURES:
- Customizable event input - Add unlimited events using a simple text format
- Flexible time periods - Set custom duration for each event (15min, 30min, 60min, etc.)
- Visual clarity - Color-coded lines and optional background cloud between high/low
- Clean labels - Minimalist text labels without background boxes
- Fully customizable - Toggle lines, labels, and clouds on/off independently
HOW TO USE:
1. Add the indicator to your chart
2. Open settings and edit the "Event Dates" text area
3. Enter one event per line in this format: YYYY-MM-DD HH:MM Minutes Label
Example: 2025-01-29 14:00 30 Jan FOMC
Example: 2025-02-12 08:30 30 Feb CPI
4. The indicator will automatically capture and display the high, low, and mid levels
WHAT IT DISPLAYS:
- High line (teal) - Highest price during the event period
- Low line (pink) - Lowest price during the event period
- Mid line (yellow, dotted) - Midpoint between high and low
- Background cloud (optional) - Shaded area between high and low
- Event window highlighting - Orange background during active events
PERFECT FOR:
- Tracking key support/resistance levels from economic releases
- Planning entries/exits around FOMC, CPI, NFP, and other data
- Analyzing how price reacts to major announcements
- Identifying post-event trading ranges
SUPPORTED EVENTS:
Works with any scheduled economic release - FOMC, CPI, PPI, NFP, Retail Sales, GDP, and more. Simply input the date, time, duration, and a custom label.
IMPORTANT LIMITATIONS:
- Chart timeframe must be EQUAL TO OR SMALLER than event duration
- For 30-minute events: Use 30min, 15min, 5min, 1min charts (NOT 1H, 4H, Daily)
- For 60-minute events: Use 60min, 30min, 15min, 5min, 1min charts
- For 15-minute events: Use 15min, 5min, 1min charts
- If your chart timeframe is larger than the event duration, the indicator may not capture accurate high/low values
- Recommended: Use 5-minute or 1-minute charts for maximum accuracy on all event durations
NOTES:
- All times are in EST/EDT (America/New_York timezone)
- Comments starting with # are ignored, making it easy to organize and annotate your event list
- The indicator processes events only after the specified duration has elapsed

Crypto Breadth Engine [alex975]
A normalized crypto market breadth indicator with a customizable 40 coin input panel — revealing whether rallies are broad and healthy across major coins and altcoins or led by only a few.
📊 Overview
The Crypto Breadth Engine measures the real participation strength of the crypto market by analyzing the direction of the 40 largest cryptocurrencies by market capitalization.
⚙️ How It Works
Unlike standard breadth tools that only count assets above a moving average, this indicator measures actual price direction:
+1 if a coin closes higher, –1 if lower, 0 if unchanged.
The total forms a Breadth Line, statistically normalized using standard deviation to maintain consistent readings across timeframes and volatility conditions.
🧩 Dynamic Input Mask
All 40 cryptocurrencies are fully editable via the input panel, allowing users to easily replace or customize the basket (Top 40, Layer-1s, DeFi, Meme Coins, AI Tokens, etc.) without touching the code.
This flexibility keeps the indicator aligned with the evolving crypto market.
🧭 Trend Bias
The indicator classifies market structure as Bullish, Neutral, or Bearish, based on how the Breadth Line aligns with its moving averages (10, 20, 50).
💡 Dashboard
A compact on-chart table displays in real time:
• Positive and negative coins
• Participation percentage
• Current trend bias
🔍 Interpretation
• Rising breadth → broad, healthy market expansion
• Falling breadth → narrowing participation and structural weakness
Ideal for TOTAL, TOTAL3, or custom crypto baskets on 1D,1W.
Developed by alex975 – Version 1.0 (2025).
-------------------------------------------------------------------------------------
🇮🇹 Versione Italiana
📊 Panoramica
Il Crypto Breadth Engine misura la partecipazione reale del mercato crypto, analizzando la direzione delle 40 principali criptovalute per capitalizzazione.
Non si limita a contare quante coin sono sopra una media mobile, ma calcola la variazione effettiva del prezzo:
+1 se sale, –1 se scende, 0 se invariato.
La somma genera una Breadth Line normalizzata statisticamente, garantendo letture coerenti su diversi timeframe e fasi di volatilità.
🧩 Mascherina dinamica
L’indicatore include una mascherina d’input interattiva che consente di modificare o sostituire liberamente i 40 ticker analizzati (Top 40, Layer-1, DeFi, Meme Coin, ecc.) senza intervenire nel codice.
Questo lo rende sempre aggiornato e adattabile all’evoluzione del mercato crypto.
⚙️ Funzionamento e Trend Bias
Classifica automaticamente il mercato come Bullish, Neutral o Bearish in base alla relazione tra la breadth e le medie mobili (10, 20, 50 periodi).
💡 Dashboard
Una tabella compatta mostra in tempo reale:
• Numero di coin positive e negative
• Percentuale di partecipazione
• Stato attuale del trend
🔍 Interpretazione
• Breadth in crescita → mercato ampio e trend sano
• Breadth in calo → partecipazione ridotta e concentrazione su pochi asset
Ideale per analizzare TOTAL, TOTAL3 o panieri personalizzati di crypto.
Funziona su timeframe 1D, 4H, 1W.
Sviluppato da alex975 – Versione 1.0 (2025).

Livelli OI-PNCOI-PNC Levels is a script that displays the open interest (OI) and net short positions (PNC) of a selection of 20 of the most significant stocks in terms of traded value on the Italian market.
PNC are indicated by red dotted lines starting from the close of the last reported change date;
The most significant open interest by number of contracts (Top 10 Calls and Top 10 Puts) are displayed using labels, all on a single line (Strike, CALL, PUT);
A summary table can be activated.
the data is hardcoded using static arrays and must be updated periodically. Data updated of 03/11/2025
########### Italiano ############
Livelli OI-PNC è uno script che permette di visualizzare gli open interest (OI) e le Posizioni Nette Corte (PNC) di una selezione di 20 titoli tra i più significativi per controvalore movimentato del mercato italiano.
Le PNC vengono indicate tramite Linee tratteggiate rosse che partono dal close della data di ultima variazione comunicata;
Sono riportati tramite labels, gli Open Interest più significativi per num.Contratti (Top 10 Call e top 10 Put) tutto su una unica riga per ogni strike (Strike, CALL, PUT);
E' attivabile una Tabella di riepilogo.
Poiché Pine Script non può leggere direttamente file da URL esterni, i dati sono hardcorati tramite array statici e vanno aggiornati periodicamente. Dati aggiornati al 03/11/2025
