Binance Moving AveragesPretty simple, just the three moving averages that Binance traders see by default (7MA, 25AM & 99MA) and they use the same default colours.
Everyone has different ideas of which MA/EMA settings to use and they're all kinda highlighting the same areas whether it's 10/20, 12/26, 9/21, etc., but it stands to reason that these ones are well respected areas given that the majority of action is on Binance (for now) and it's particularly apparent on 4h charts.
在腳本中搜尋"用户自选股中各股票的均线排列状态(5日、10日、20日均线)"

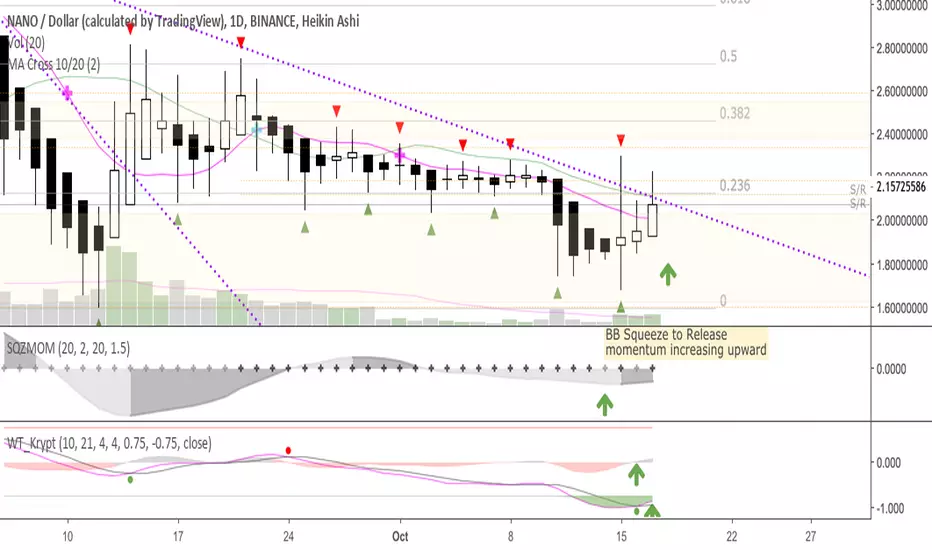
MA Cross 10/20This was originally derived from "MA Cross" indicator, though that one uses 9-21.
Simple 10day and 20day MA crossover indicator
* 10MA crosses from the bottom, goes up and above 20MA—we're bullish, look to long bullish signal candle
* 10MA crosses from the top, goes down and below 20MA—we're bearish, look to short bearish signal candle
Works well w/ Heikin Ashi candles
Moving Average x 5 by southnjesEasy to use 5 x MA 10/20/50/100/200 indicator. Works well on TV free as it only uses 1 indicator value leaving 2 slots available for other needed indicators.

Better RSI0, 10, 20, 30, 40, 50, 60, 70, 80, 90, 100 lines drawn. Easier to see on dark theme. Added bubble indicators to show when price goes above 70 or below 30.

Forex MA Racer - SMA Performance /w ZeroLag EMA TriggerThis strategy uses 5 Simple Moving Averages and 2 ZeroLag Exponential Moving Averages, to determine possible entries and exits.
- Pretuned for Forex on 15m period
- Uses SMA(10/20/50/100/200) and EMA(9/21) by default
- Be cautios in sideward markets!


EMAs: 10,20
Hello this is a script that seeks to increase a bit the number of indicators used in the free version. its use is to know if a trend continues or will change, it is a very used and simple but efficient system. If the distance between the lines remains constant then it indicates or gives an indication that the trend continues but if they are cut it indicates or gives an indication of change of interest.
sorry for my bad english but I speak spanish

OHLC Volatility Estimators by @Xel_arjonaDISCLAIMER:
The Following indicator/code IS NOT intended to be a formal investment advice or recommendation by the author, nor should be construed as such. Users will be fully responsible by their use regarding their own trading vehicles/assets.
The embedded code and ideas within this work are FREELY AND PUBLICLY available on the Web for NON LUCRATIVE ACTIVITIES and must remain as is by Creative-Commons as TradingView's regulations. Any use, copy or re-use of this code should mention it's origin as it's authorship.
WARNING NOTICE!
THE INCLUDED FUNCTION MUST BE CONSIDERED AS DEBUGING CODE The models included in the function have been taken from openly sources on the web so they could have some errors as in the calculation scheme and/or in it's programatic scheme. Debugging are welcome.
WHAT'S THIS?
Here's a full collection of candle based (compressed tick) Volatility Estimators given as a function, openly available for free, it can print IMPLIED VOLATILITY by an external symbol ticker like INDEX:VIX.
Models included in the volatility calculation function:
CLOSE TO CLOSE: This is the classic estimator by rule, sometimes referred as HISTORICAL VOLATILITY and is the must common, accepted and widely used out there. Is based on traditional Standard Deviation method derived from the logarithm return of current close from yesterday's.
ELASTIC WEIGHTED MOVING AVERAGE: This estimator has been used by RiskMetriks®. It's calculation is based on an ElasticWeightedMovingAverage Standard Deviation method derived from the logarithm return of current close from yesterday's. It can be viewed or named as an EXPONENTIAL HISTORICAL VOLATILITY model.
PARKINSON'S: The Parkinson number, or High Low Range Volatility, developed by the physicist, Michael Parkinson, in 1980 aims to estimate the Volatility of returns for a random walk using the high and low in any particular period. IVolatility.com calculates daily Parkinson values. Prices are observed on a fixed time interval. n=10, 20, 30, 60, 90, 120, 150, 180 days.
ROGERS-SATCHELL: The Rogers-Satchell function is a volatility estimator that outperforms other estimators when the underlying follows a Geometric Brownian Motion (GBM) with a drift (historical data mean returns different from zero). As a result, it provides a better volatility estimation when the underlying is trending. However, this Rogers-Satchell estimator does not account for jumps in price (Gaps). It assumes no opening jump. The function uses the open, close, high, and low price series in its calculation and it has only one parameter, which is the period to use to estimate the volatility.
YANG-ZHANG: Yang and Zhang were the first to derive an historical volatility estimator that has a minimum estimation error, is independent of the drift, and independent of opening gaps. This estimator is maximally 14 times more efficient than the close-to-close estimator.
LOGARITHMIC GARMAN-KLASS: The former is a pinescript transcript of the model defined as in iVolatility . The metric used is a combination of the overnight, high/low and open/close range. Such a volatility metric is a more efficient measure of the degree of volatility during a given day. This metric is always positive.

Seven Exponential Moving Averages
By default, this script shows 7 different EMAs set to 5, 10, 20, 50, 100, 150, 200 intervals. If a bar closes below one of these EMAs, the respective EMA will turn red otherwise it will be green. 50 and 200 EMAs have double the linewidth of others.

Scalping PullBack Tool R1 by JustUncleLDescription
This study project is a Scalping Pullback trading Tool that incorporates the majority of the indicators needed to analyse and scalp Trends for Pull Backs and reversals on 1min, 5min or 15min charts. The set up utilies Heikin Ashi candle charts. Incorporated within this tool are the following indicators:
1. Major industry (Banks) recognised important EMAs in an EMA Ribbon:
Green = EMA89
Blue = EMA200
Black = EMA633
2. The 36EMA (default) High/Low+Close Price Action Channel (PAC).
3. Fractals
4. HH, LH, LL, HL finder to help with drawing Trend lines and mini Trend Lines.
5. Coloured coded Bar high lighting based on the PAC:
blue = bar closed above PAC
red = bar closed below PAC
gray = bar closed inside PAC
red line = EMA36 of bar close
Setup and hints:
Set the chart to Heikin Ashi Candles.
Add "Sweetspot Gold10" indicator to the chart as well to help with support and resistance finding and shows where the important "00" and "0" lines are.
When price is above the PAC(blue bars) we are only looking to buy as price comes back to the PAC
When price is below the PAC(red bars), we are only looking to sell when price comes back to the PAC
What we’re looking for when price comes back into the PAC we draw mini Trendlines utilising the Fractals and HH/LL points to guide your TL drawing.
Now look for the trend to pull back and break the drawn TL. That's is when we place the scalp trade.
So we are looking for continuation signals in terms of a strong, momentum driven pullbacks (normally short term 10-20 pips) of the EMA36.
The other EMAs are there to check for other Pullbacks when EMA36 is broken.
Other than the SweetSpot Gold10 indicator, you should not need any other indicator to scalp the pullbacks.
References:
Fractals V8 by RicardoSantos
Price Action Trading System v0.3 by JustUncleL
SweetSpot Gold10 R1 by JustUncleL
www.swing-trade-stocks.com
www.forexstrategiesresources.com

volume 5 min smiley JayyThis script plots volume. Intraday volume forms a smiley high at both ends and low in the middle at least for the cash session which is what this script concerns itself with. I created this as a curiosity but I figure others might be interested. If you are using 5 min charts then it will also plot the average for that particular time slot going back 10, 20 or 30 days and presents the mean for that bar as a black line. It also calculates the standard deviation over that period of time. Clearly the volume data is positively skewed so the mean and standard deviation are a little misleading. That aside it does provide a interesting perspective. The script likely could be reduced in size to accomplish the same thing with less tedium but it is what it is.
I likely will add an option for 15 minutes in the future.
If you are using BATS data you will find errors in low volume stocks because BATS data sometimes misses bars. The calculation relies on 78 5 min bars in a day (9:30 to 16:00 hrs). I built a little checker in the format. If the red line does not show at the beginning of the day then smiley will not work. For example SPY works well but NUGT does not. I have not found an issue will real time data.
There are a few options for bar colouring. They will be obvious when you play with them. current close versus last close, close versus open and volume relative to last bar.

Composite Momentum Index [LazyBear]This is a composite oscillator derived from modified 5/10/20 Chande's Dynamic Momentum Index values.
Volatility is factored in, by design. Look for OB/OS extremes and divergences.
I added the green/red ribbon look to make it easy to read :)
More info:
www.investopedia.com
List of my public indicators: bit.ly
List of my app-store indicators: blog.tradingview.com
