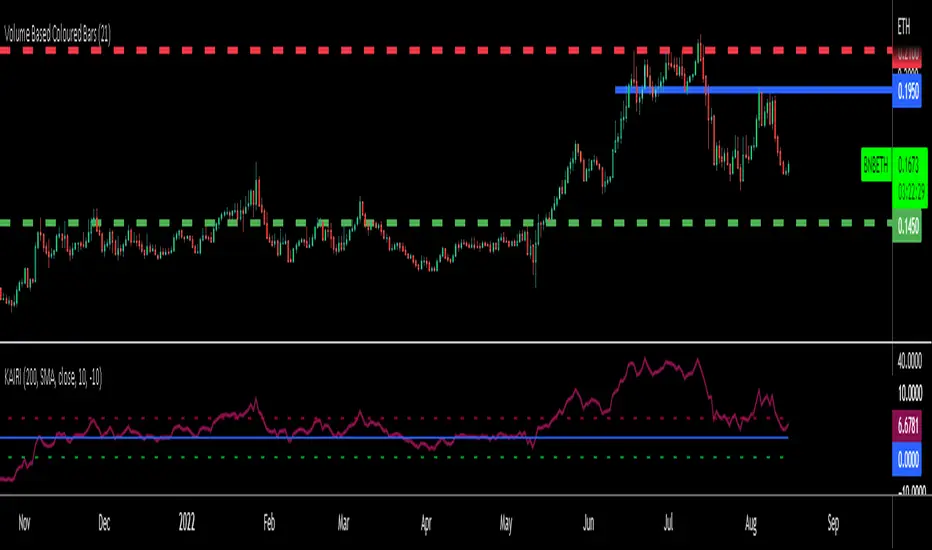
KAIRI RELATIVE INDEXAn old but gold Japanese indicator for Mean Reverting strategies and ideal for Pairs Trading...
The Kairi Relative Index measures the distance between closing prices and a Moving Average in percent value (generally SMA).
Extreme reading in the KRI are considered buy and sell signals.
Extreme readings will vary by asset, with more volatile assets reaching much higher and lower extremes that more sedate assets.
The KRI is not an accurate timing signal, and therefore, should be combined with other forms of analysis to generate trade signals.
You can calculate percent difference between the price and 10 different types of Moving Averages in this version of KAIRI as:
SMA : Simple Moving Average
EMA : Exponential Moving Average
WMA : Weighted Moving Average
TMA : Triangular Moving Average
VAR : Variable Index Dynamic Moving Average a.k.a. VIDYA
WWMA : Welles Wilder's Moving Average
ZLEMA : Zero Lag Exponential Moving Average
TSF : True Strength Force
HULL : Hull Moving Average
VWMA: Volume Veighted Moving Average
Personal advice: try using bigger length of Moving Averages like 50-100-200 for pairs and mean reversion strategies
在腳本中搜尋"科创50和科创100区别"
Daily SMA In Lower Timeframe public versionThis script aims to provide the daily SMAs (50,100,200) in lower time frames, but ONLY if current price is less than 5% away from it (public code version)

Moving Average pooria563sma moving average 20 , 50 , 100, 200 that you choose one of them that you want.
Rramires->5_EMAs 9, 21, 50, 100, 200The five EMA averages I use in my analysis in a single indicator.

1-gg702gg fib + 3ema 50+100+200=+10
heikin ashi trand
set with hem ind...
wolfpack and draw trend line or auto trend line
green = bay
red = sell
and set the bar heikin ashi from the sting
goooood lock

Saturns Rings5 EMAs in One Indicator
Recommended Settings:
Fibonacci Series (Default): 8, 21, 34, 55, 89
Standard: 10, 20, 50, 100, 20

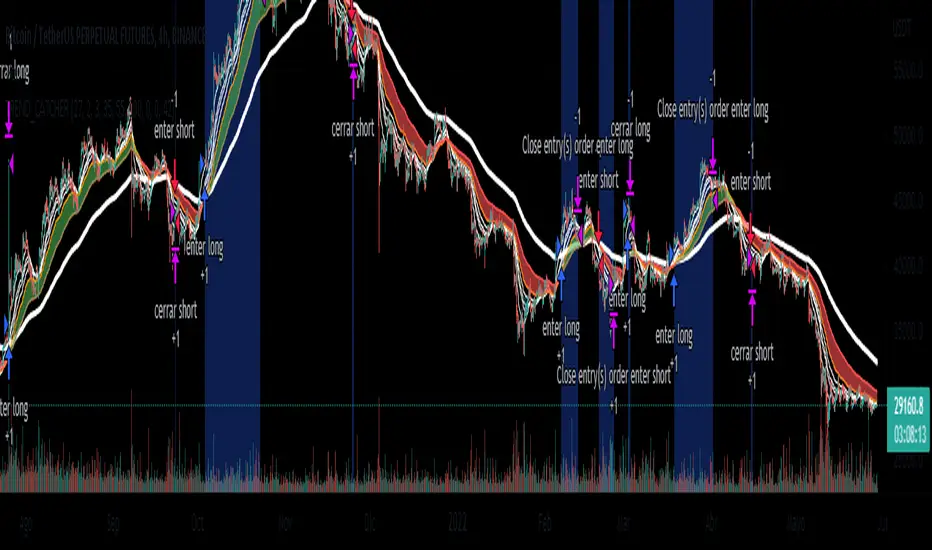
EMA_TREND_CATCHERSimple strategy based on the crossing of moving averages of 50,100 and 200 periods. Designed to identify trends
You are ready to use trading bots (all you have to do is fill in "Variables for Alert"). However, it can also be used for discretionary operations.
BTCUSDT FUTURES BINANCE
4H
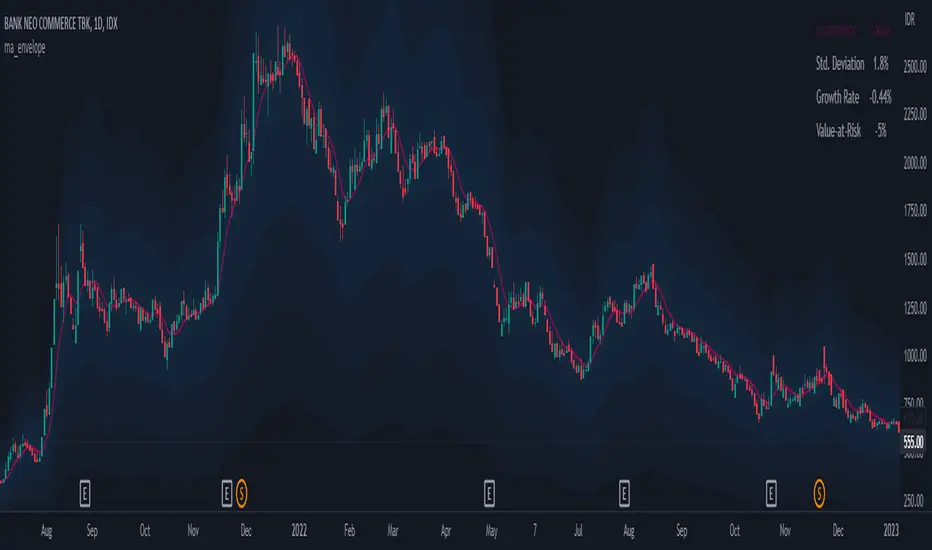
multiple_ma_envelope
Description:
Moving Average is a well-known though simple technical analysis tool, that can be applied in most trading journeys. By adding an envelope (a certain amount above and below the moving averages, cited from Investopedia), the indicator aligned its aim to identify the reversal area i.e. when the price reaches the envelopes, the price tends to have a reverse. In this indicator, the improvement is by adding multiple envelopes at once, thus can identify the further phase of the reverse area when the price apparently continues current direction.
Upper Band = MA * (1 + %envelope)
Lower Band = MA * (1 - %envelope)
Notes:
1). In this indicator, the default value of the moving average utilized is set to 10, 20, 50, 100 respectively
2). The band initial value is set to 0.2, and increases by 0.2 for each increasing MA Length
Feature:
1). Multiple Moving Average Envelope
2). Information Table as displayed Rolling Deviation, Rolling Maximum Drawdown, and Value-at-Risk
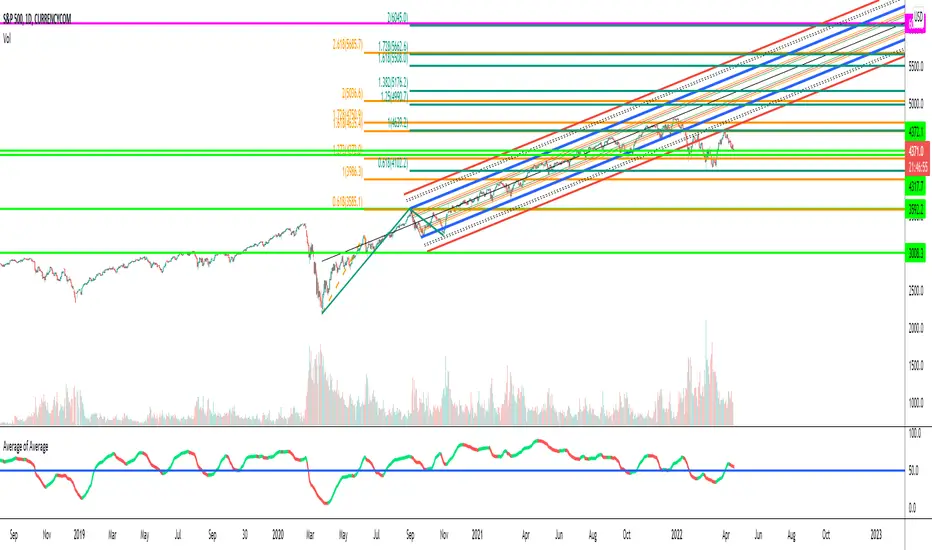
Average of Average SP500 breadthAverage of % of stocks in S&P500 above 20/50/100/200 MA summed up and divided by 4. So average of average of SP500 breadth :) with directional color. Adjustable MA and Color smoothing.
VWAP with 7EMA with ZonesThis is a script with 7 EMAs for every type of trades. This indicator also has the daily weekly and monthly zones. 20,50,100,200 EMAs being the best EMAs of all.
Moving Average Suite + VWAP + TICKThis indicator combines some of the commonly used moving averages, VWAP, and TICK sentiment, all of which are useful for all types of trading
By default, this indicator includes:
- 21/50/100/200 period smoothed simple moving average
- great for determining trends
- also act as support / resistance line for price
- 9 period exponential moving average
- fast trend / direction indicator
- Volume Weighted Average Price
- no explanation required
- $TICK sentiment as background fill
- overall market sentiment and direction
- +/- 500 levels are colored green/red and are usually indication of institutional order flow --> critical for trading indexes such as SPY or QQQ
- deep green/red background indicates +/-1000 on the $TICK, which are usually associated with overbought or oversold

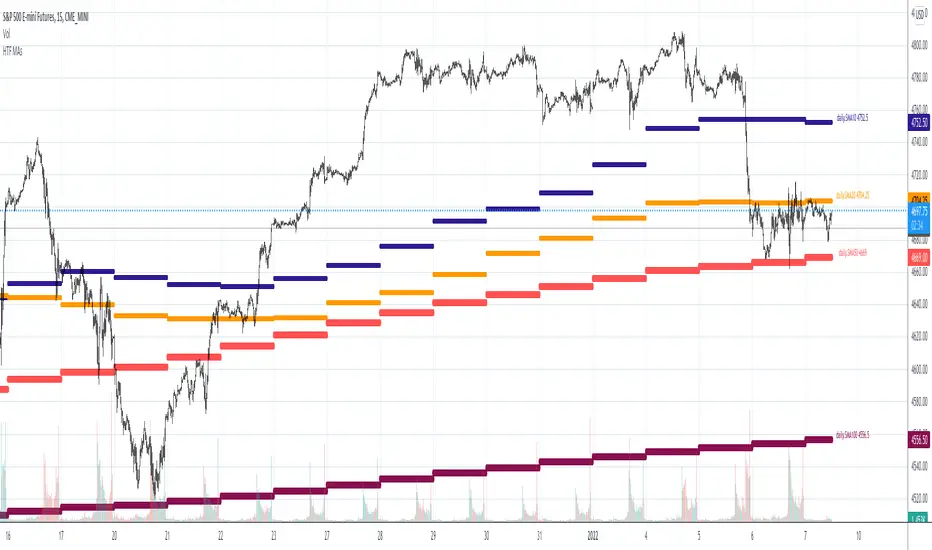
Higher TF Moving AveragesScript showing up to 5 different Moving Averages of a Higher Timeframe.
User can select the MA type (EMA or SMA) and its length.
Default are 10, 20, 50, 100 and 200 period SMAs.
The script will also plot optional labels with price display.
All plots and color are configurable.
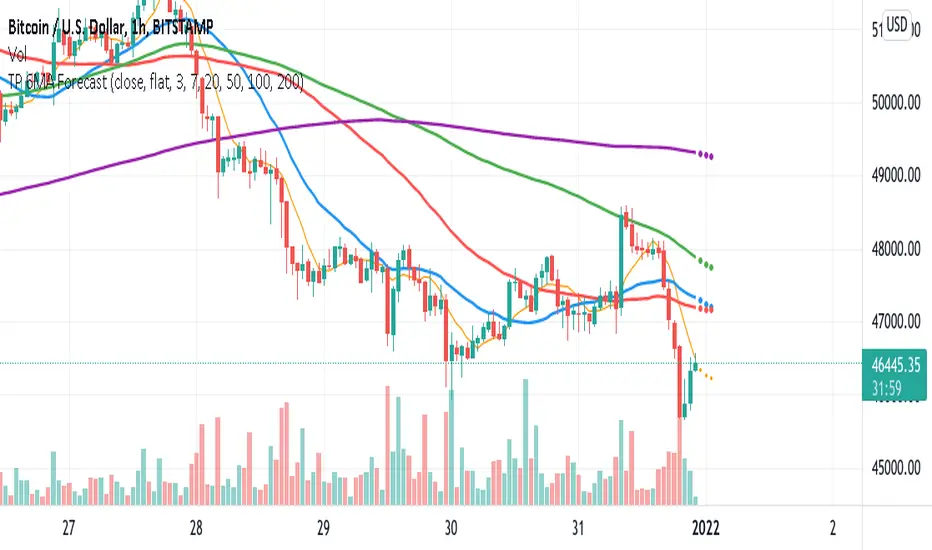
TargetPredictor 5MA ForecastThis indicator consists of five moving averages. 7, 20, 50, 100 and 200.
Moving averages usually represent dynamic supports or resistances and are very useful in trading.
In addition, this indicator predicts where these moving averages will be located three candlesticks ahead and predicts their projected movement.
I hope you enjoy it and enjoy using it.
Market Breadth EMAs V2Second version of Market Breadth EMAs for $SPY. Getting a little more complicated than V1 but removed noise.
Key:
Green line = % of stocks above their 20-period moving average, the "twitch line"
Red line = % of stocks above their 200-period moving average, the "long term trend"
White line = weighted average of the % of stocks above the 20/50/100/200 averages, the "general trend." Captures bursts that the 200 misses, and is more trustworthy than the 20.
Background colors = limits of the red/green/white where reversals have happened historically. The darker the color, the stronger the signal.
Histogram = the change in the white line over time, for different time periods: 1/4/10/20, the "trend strength/confidence." i.e. If the white line "General Trend" has been drifting lower for a month but started increasing the past 2 days, you might have 3 red histograms and 1 green one.
Techniques:
If the green, red, or white line is above 50%, then more than half the stocks are above that average. So, if they're in the top half, bullish market. Bottom half, bearish market.
If the green line is above the red, market has rising/bullish momentum. If red is above green, market has falling/bearish momentum.
If the white line is rising, bullish momentum. If it's falling, bearish momentum.
If the histograms are all green, there is strong momentum in that direction. The % of stocks above their important averages has been increasing each day for both the short term and long term.
If the histograms go from all green to a mix of green and red, be on the lookout for a reversal from one of the background levels. Usually initiates from the 20 (green line) first.
If price dips without the histogram changing, HODL.

Market Breadth EMAsThis is the combined market breadth tickers: S5TW, S5FI, S5OH, and S5TH representing the percentage of S&P 500 stocks above their 20, 50, 100, and 200 EMA respectively. The colors go from green (20) to red (200) because if 20 crosses above the 200, the market's bullish, and if the 20 crosses below the 200, the market is bearish. So if green is on top = bull market. If red is on top = bear market. In general the market sentiment is whichever color is highest up.
The background is colored in depending on a few historical extremes in the 200. The darker the color the more significant the buy/sell signal. These can be adjusted by changing the hline's in the code.

EneX SignalEneX is signal that give recommendation signals for entry and exit on spot market. This indicators not suitable for leverage trading in futures market.
EneX signal consider several indicators and has entry and exit rules.
EneX signal is suitable for investors who believe in trend following strategy (disclaimer on).
This script composed by Yohan Naftali for educational purpose only. Reader who will use this signal must do own research.
Indicator and Plot Involved
1. Williams Fractals with default periods = 2
2. William Alligator Indicators with default simple moving average 8, 13, and 21
3. Exponential Moving Averages with default value EMA 50, 100, and 200
4. Relative Strength Index with default overbought level = 80 and oversold level = 20
5. Williams Fractals are joined to create support and resistance line and fill area between support and resistance lines.
Entry signal conditions
1. Entry on Weakness when bullish fractal appear on n/2 period
2. Entry when price break resistance line
All entry condition must above EMA and alligator signal and not in overbought RSI
Exit signal conditions
1. Lowest price is below Exponential Moving Average
2. Lowest price is below William alligator lines
You can easily find entry and exit points by using Entry (E), Exit(X) signals
How to use
1. Monitor chart and wait until E or X signals
2. Entry if Entry Signal (E) appear (green colored label)
3. Exit if Exit Signal (X) appear (red colored label)
4. Change indicators setting when necessary
Best Practice
1. Entry only when entry signal (E) appear
2. Never entry when price below William alligator signal
3. Exit when exit signal (X) appear
4. Not exit when exit signal appear when you believe or you have information that price will be rebound
5. Exit if you believe that current price meet your target price
6. Always wise when use EneX signals
Disclaimer
Do your own research and consider fundamental price of asset.
The indicators provided on this script is for educational purposes only.
Author does not offer advisory or brokerage services, nor does it recommend or advise users to buy or sell particular stocks or securities.
Please examined script and give feedback for further improvement.

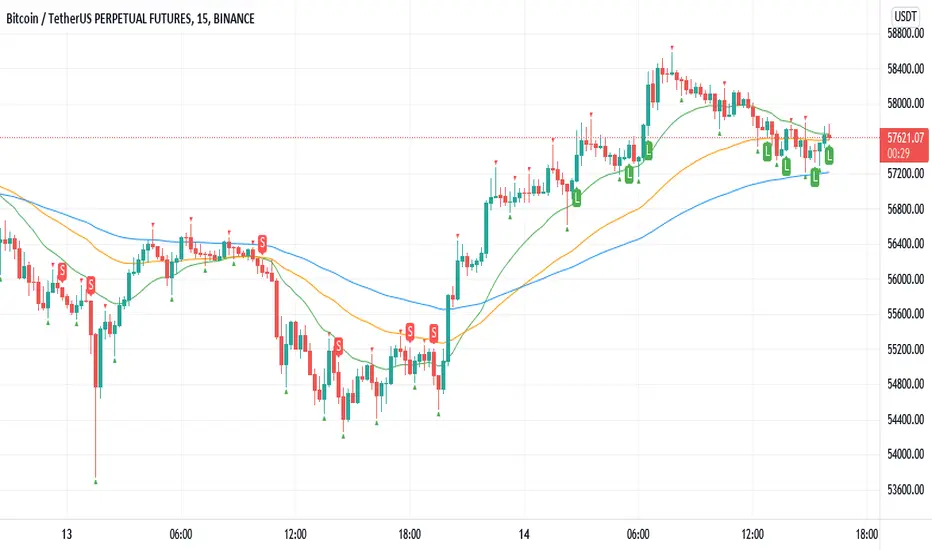
Williams Fractals BUY/SELL signals indicatorThis indicator made with using Williams Fractals, 20 50 100 Moving Averages and Relative Strength Index. You can easily find entry points by using Long (L), Short (S) signals.
This is a 15min scalping strategy for BTC:USDT Perpetual pair. For use different pairs or TFs you may need to change settings.
How to use
****************
When flashing Long (L) or Short (S) signal you should wait until the candle closing for the confirmation.
After that candle closed with the signal, you can enter a trade in next candle opening.
Your SL should be 3.1% from etnry and TP should be 0.5% from entry for best results. (You can use Long Position / Short Position tool in Prediction and Measurement Tools in drawing pannel to calculate this. This settings only for BTC:USDT Perp 15 min TF. For other TFs or Pairs settings may vary. You can easily change these settings and backtest your own.)
After entering a trade you can be ignored next signals until close the trade.
To learn more about this strategy, please try the "Williams Fractals Strategy" I coded. Thank you!
SirSeff's EMA RainbowThis strategy uses divergences between three exponential moving averages and their slope directions as well as crosses between the price and these moving averages to switch between a long or short position. The strategy is non-stop in the market and always either long or short.\
This trend trading strategy uses exponential moving averages of 10, 20, 50, 100, 150, 200 to gauge the price action cycle if it is on Stage 2 aka Mark up famously coined by Dr.Wykcoff.
It opens a position when the closing price crosses above the 10ema and all the exponential moving averages are stacked up together. Stacked-up Moving averages are used by Mark Minervini and Oliver Kell.
I close a position at an 8% trailing stop from the opened position which makes the succeeding buy orders as scaling up or averaging up from an established bullish trend.
All trading involves high risk; past performance is not necessarily indicative of future results. Hypothetical or simulated performance results have certain inherent limitations. Unlike an actual performance record, simulated results do not represent actual trading. Also, since the trades have not actually been executed, the results may have under-or over-compensated for the impact, if any, of certain market factors, such as lack of liquidity. Simulated trading programs in general are also subject to the fact that they are designed with the benefit of hindsight. No representation is being made that any account will or is likely to achieve profits or losses similar to those shown.

Williams Fractals StrategyThis indicator made with using Williams Fractals, 20 50 100 Moving Averages and Relative Strength Index. You can easily find entry points by using Long (L), Short (S) signals.
Note : Settings are optimized for BTC:USDT Perpetual 15min TF. For use different pairs or TFs you may need to change settings.

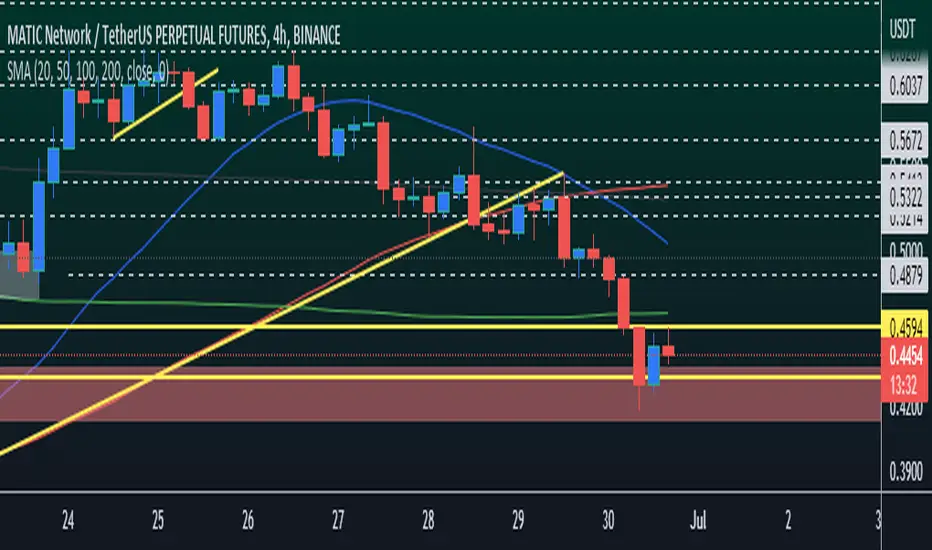
Mean reverting strategy based on time and SMAsThis scripts draws on the graph buy and sell signals based on the time passed since the last touch from 50, 100 and 200 simple moving averages. It is more reliable on longer timeframes (2H to 1W), but can be used up to 5 min charts. Used with some trend and volume analysis should grant better results.
Disclaimer: no results assured, use it at your own risk

Trading ABCHello Traders,
For a few months I have been getting requests from my followers about ABC pattern and finally I decided to make this indicator.
How it works?
- It creates Trend Cloud using Simple and Exponential moving averages with the lenghts 50, 100, 150, 200, 20, 40 by default and checks the trend. you can change the lengths as you wish
- It also creates ZigZag using the ZigZag Period in the options.
- Using last 2 zigzag waves it checks if there is suitable ABC pattern according the Trend, the Min/Max Fibonacci levels and Error Rate
- Then it check if the price bounces after this ABC pattern
- And if all these conditions met then it plot triangle
- If there are multiple bouncing then you can see multiple triangles
You can change/set;
- Zigzag Period
- Fibonacci Max level
- Fibonacci Min Level
- Error Rate
- The Lengths that are used for Moving Averages
- Keeping old ABC lines/labels
- Show Zigzag and min/max Fibonacci levels
- Show Trend Cloud
- and colors
if you don't want to see old ABC lines/labels you can disable it:
if you don't want to see Trend Cloud you can disable it:
Zigzag and Fibonacci levels:
P.S. if you have new ideas to improve this indicator then let me know please. We together can do this life easier!
Enjoy!

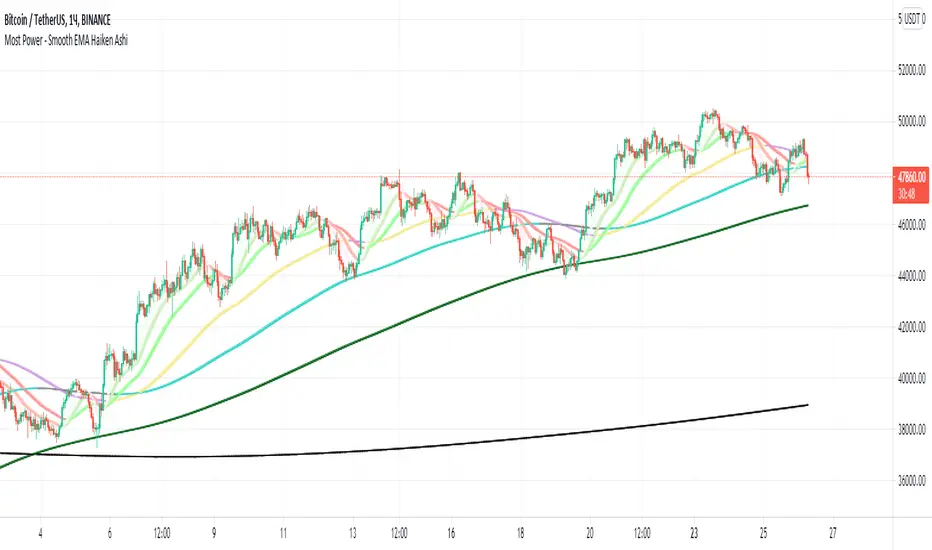
Most Power - Smooth EMA Haiken AshiMost Power - Smooth EMA Haiken Ashi
The indicator displays smoothed EMA (5, 10, 20, 50, 100, 200, 1000). Smoothing occurs through the use of Haiken AShi