在腳本中搜尋"科创50指数资金流向如何"
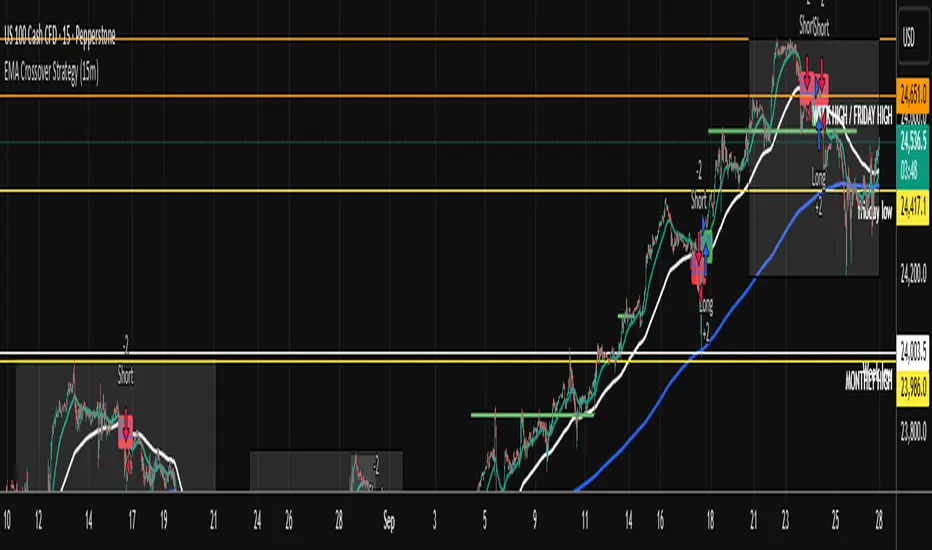
EMA Crossover Strategy (15m)50 and 200 ema crossing when leaving anchor. when 50 and 200 crosses will give you direction of where market is going. wait for a pull back and take trade. sl on highest or lowest point of apex tp open . when you see multiple equal ( low or High) get put of trade.
The Lazy Trader - Index (ETF) Trend Following Robot50/150 moving average, index (ETF) trend following robot. Coded for people who cannot psychologically handle dollar-cost-averaging through bear markets and extreme drawdowns (although DCA can produce better results eventually), this robot helps you to avoid bear markets. Be a fair-weathered friend of Mr Market, and only take up his offer when the sun is shining! Designed for the lazy trader who really doesn't care...
Recommended Chart Settings:
Asset Class: ETF
Time Frame: Daily
Necessary ETF Macro Conditions:
a) Country must have healthy demographics, good ratio of young > old
b) Country population must be increasing
c) Country must be experiencing price-inflation
Default Robot Settings:
Slow Moving Average: 50 (integer) //adjust to suit your underlying index
Fast Moving Average: 150 (integer) //adjust to suit your underlying index
Bullish Slope Angle: 5 (degrees) //up angle of moving averages
Bearish Slope Angle: -5 (degrees) //down angle of moving averages
Average True Range: 14 (integer) //input for slope-angle formula
Risk: 100 (%) //100% risk means using all equity per trade
ETF Test Results (Default Settings):
SPY (1993 to 2020, 27 years), 332% profit, 20 trades, 6.4 profit factor, 7% drawdown
EWG (1996 to 2020, 24 years), 310% profit, 18 trades, 3.7 profit factor, 10% drawdown
EWH (1996 to 2020, 24 years), 4% loss, 26 trades, 0.9 profit factor, 36% drawdown
QQQ (1999 to 2020, 21 years), 232% profit, 17 trades, 3.6 profit factor, 2% drawdown
EEM (2003 to 2020, 17 years), 73% profit, 17 trades, 1.1 profit factor, 3% drawdown
GXC (2007 to 2020, 13 years), 18% profit, 14 trades, 1.3 profit factor, 26% drawdown
BKF (2009 to 2020, 11 years), 11% profit, 13 trades, 1.2 profit factor, 33% drawdown
A longer time in the markets is better, with the exception of EWH. 6 out of 7 tested ETFs were profitable, feel free to test on your favourite ETF (default settings) and comment below.
Risk Warning:
Not tested on commodities nor other financial products like currencies (code will not work), feel free to leave comments below.
Moving Average Slope Angle Formula:
Reproduced and modified from source:

50 & 200 SMA + RSI Average Strategy (Long Only, Single Trade)It works better in trending markets. It delivers its best performance in the 4-hour to 1-day timeframes.

50-Minute Opening Range BreakoutThis is a test of the opening range with Bearish/Bullish confirmation

50-Line Oscillator // (\_/)
// ( •.•)
// (")_(")
25-Line Oscillator
Description:
The 25-Line Oscillator is a sophisticated technical analysis tool designed to visualize market trends through the use of multiple Simple Moving Averages (SMAs). This indicator computes a series of 26 SMAs, incrementally increasing the base length, providing traders with a comprehensive view of price dynamics.
Features:
Customizable Base Length: Adjust the base length of the SMAs according to trading preferences, enhancing versatility for different market conditions.
Rainbow Effect: The indicator employs a visually appealing rainbow color scheme to differentiate between the various trend lines, making it easy to identify crossovers and momentum shifts.
Crossovers Detection: The script includes logic to detect crossover events between consecutive trend lines, which can serve as signals for potential entry or exit points in trading.
Clear Visualization: Suitable for both novice and seasoned traders, the plots enable quick interpretation of trends and market behavior.
How to Use:
Add the indicator to your chart and customize the base length as desired.
Observe the rainbow-colored lines for trend direction.
Look for crossover events between the SMAs as potential trading signals.
Application: This indicator is particularly useful for swing traders and trend followers who aim to capitalize on market momentum and identify reversals. By monitoring the behavior of multiple SMAs, traders can gain insights into the strength and direction of price movements over various time frames.


AK Simple Moving Average 50 days Simple Moving average suitable for Intraday on 1Hr,30Min.15Min Time frames
1. When candle crossing above SMA Line - Go for Long Entries
2. When candle crossing below SMA Line - Go for short Entries
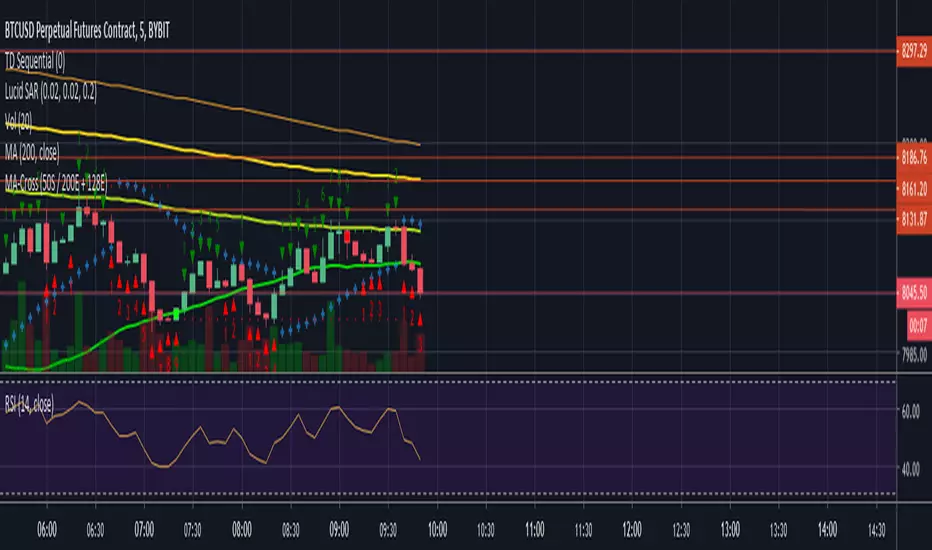
50 SMA / 200 EMA / 128EMA Moving Average CrossFound success using 50SMA vs 200EMA.
128 EMA also charted for it's BTC relevance.


50/100/200 Moving Averages (Pine Script For Copy)by fresca
SCRIPT LANGUAGE
Copy script below and adjust based on your preferences.
-function (change function from "sma" to "ema", "wma" and more)
-length (25 Day, 150 Day or add more averages to the three in this script.)
-color, (red, yellow, etc. or use color hex codes i.e. #FEDA15, #FFAD8F, etc.)
-transparency (set to desired level 1-100)
Or add more options.
RESOURCES
Color hex codes site: www.canva.com
Trading View Pine Script Editor Reference Guide: www.tradingview.com

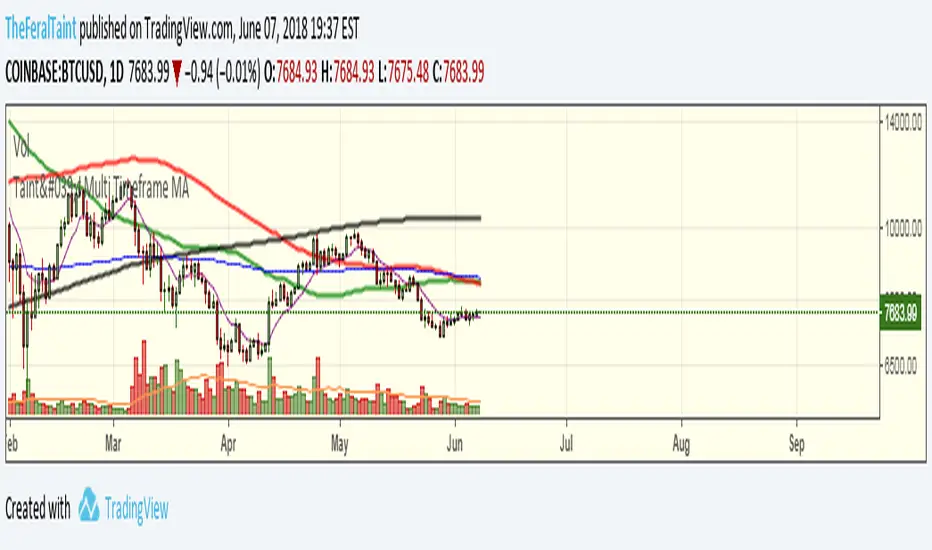
Taint's Multi Time Frame MA50-100-200 SMA with two 200 EMA's all with the ability choose a time frame for each.


MTC – Multi-Timeframe Trend Confirmator V2MTC – Multi-Timeframe Trend Confirmator V2
A comprehensive trend analysis indicator that systematically combines six technical indicators across three customizable timeframes, using a weighted scoring system to identify high-probability trend conditions.
ORIGINALITY AND CONCEPT
This indicator is original in its approach to multi-timeframe trend confirmation. Rather than relying on a single indicator or timeframe, it creates a composite score by evaluating six different technical conditions simultaneously across three timeframes. The scoring system weighs certain indicators more heavily based on their reliability in trend identification. The visual gauge provides an at-a-glance view of trend alignment across timeframes, making it easier to identify when multiple timeframes agree - a condition that typically produces stronger, more reliable trends.
HOW IT WORKS - DETAILED SCORING METHODOLOGY
The indicator evaluates six technical conditions on each timeframe. Each condition contributes to a composite score:
EMA 200 (Weight: 1 point)
Bullish: Price closes above EMA 200 (+1)
Bearish: Price closes below EMA 200 (-1)
Rationale: Long-term trend direction
SMA 50/200 Crossover (Weight: 1 point)
Bullish: SMA 50 above SMA 200 (+1)
Bearish: SMA 50 below SMA 200 (-1)
Rationale: Golden/Death cross confirmation
RSI 14 (Weight: 1 point)
Bullish: RSI above 55 (+1)
Bearish: RSI below 45 (-1)
Neutral: RSI between 45-55 (0)
Rationale: Momentum filter with buffer zone to avoid chop
MACD (12,26,9) (Weight: 1 point)
Bullish: MACD line above signal line (+1)
Bearish: MACD line below signal line (-1)
Rationale: Trend momentum confirmation
ADX 14 (Weight: 2 points - DOUBLE WEIGHTED)
Requires ADX above 25 to activate
Bullish: DI+ above DI- and ADX > 25 (+2)
Bearish: DI- above DI+ and ADX > 25 (-2)
Neutral: ADX below 25 (0)
Rationale: Trend strength filter - only counts when a strong trend exists. Double weighted because ADX is specifically designed to measure trend strength, making it more reliable than oscillators.
Supertrend (Factor: 3.0, ATR Period: 10) (Weight: 2 points - DOUBLE WEIGHTED)
Bullish: Direction indicator = -1 (+2)
Bearish: Direction indicator = +1 (-2)
Rationale: Dynamic support/resistance that adapts to volatility. Double weighted because Supertrend provides clear, objective trend signals with built-in stop-loss levels.
COMPOSITE SCORE CALCULATION:
Total possible score range: -10 to +10 points
Score interpretation:
Score > 2: UPTREND (majority of indicators bullish, especially weighted ones)
Score < -2: DOWNTREND (majority of indicators bearish, especially weighted ones)
Score between -2 and +2: NEUTRAL/RANGING (mixed signals or weak trend)
The threshold of +/- 2 was chosen because it requires more than just basic agreement - it typically means at least 3-4 indicators align, or that the heavily-weighted indicators (ADX, Supertrend) confirm the direction.
MULTI-TIMEFRAME LOGIC:
The indicator calculates the composite score independently for three timeframes:
Higher Timeframe (default: 4H) - Major trend direction
Mid Timeframe (default: 1H) - Intermediate trend
Lower Timeframe (default: 15min) - Entry timing
Main Trend Confirmation Rule:
The indicator only signals a confirmed trend when BOTH the higher timeframe AND mid timeframe scores agree (both > 2 for uptrend, or both < -2 for downtrend). This dual-timeframe confirmation significantly reduces false signals during choppy or ranging markets.
HOW TO USE IT
Setup:
Add indicator to chart
Customize timeframes based on your trading style:
Scalpers: 15min, 5min, 1min
Day traders: 4H, 1H, 15min (default)
Swing traders: Daily, 4H, 1H
Toggle individual indicators on/off based on your preference
Adjust Supertrend parameters if needed for your instrument's volatility
Reading the Gauge (Top Right Corner):
Each row shows one timeframe
Left column: Timeframe label
Middle column: Visual strength bars (10 bars = maximum score)
Green bars = Bullish score
Red bars = Bearish score
Yellow bars = Neutral/ranging
More filled bars = stronger trend
Right column: Numerical score
Trading Signals:
Entry Signals:
Long Entry: Wait for upward triangle arrow (appears when higher + mid TF both bullish)
Confirm gauge shows green bars on higher and mid timeframes
Lower timeframe should ideally turn green for entry timing
Chart background tints light green
Short Entry: Wait for downward triangle arrow (appears when higher + mid TF both bearish)
Confirm gauge shows red bars on higher and mid timeframes
Lower timeframe should ideally turn red for entry timing
Chart background tints light red
Position Management:
Stay in position while higher and mid timeframes remain aligned
Consider reducing position size when mid timeframe score weakens
Exit when higher timeframe trend reverses (daily label changes)
Avoiding False Signals:
Ignore signals when gauge shows mixed colors across timeframes
Avoid trading when scores are close to threshold (+/- 2 to +/- 4 range)
Best trades occur when all three timeframes align (all green or all red in gauge)
Use the numerical scores: higher absolute values (7-10) indicate stronger, more reliable trends
Practical Examples:
Example 1 - Strong Uptrend Entry:
Higher TF: +8 (strong green bars)
Mid TF: +6 (strong green bars)
Lower TF: +4 (moderate green bars)
Action: Look for long entries on lower timeframe pullbacks
Background is tinted green, upward arrow appears
Example 2 - Ranging Market (Avoid):
Higher TF: +3 (weak green)
Mid TF: -1 (weak red)
Lower TF: +2 (neutral yellow)
Action: Stay out, wait for alignment
Example 3 - Trend Reversal Warning:
Higher TF: +7 (still green)
Mid TF: -3 (turned red)
Lower TF: -5 (strong red)
Action: Consider exiting longs, prepare for potential higher TF reversal
Customization Options:
Timeframes: Adjust all three to match your trading horizon
Indicator Toggles: Disable indicators that don't suit your instrument:
Disable RSI for highly volatile crypto markets
Disable SMA crossover for range-bound instruments
Keep ADX and Supertrend enabled for trending markets
Visual Preferences:
Arrow size: 5 options from Tiny to Huge
Gauge size: Small/Medium/Large for different screen sizes
Toggle arrows on/off if you only want the gauge
Alert Setup:
Right-click chart, "Add Alert"
Condition: MTC v6 - UPTREND or DOWNTREND
Get notified when multi-timeframe confirmation occurs
Best Practices:
Use with Price Action: The indicator works best when combined with support/resistance levels, chart patterns, and volume analysis
Risk Management: Even with multi-timeframe confirmation, always use stop losses
Market Context: Works best in trending markets; less reliable in strong consolidation
Backtesting: Test the default settings on your specific instrument and timeframe before live trading
Patience: Wait for full multi-timeframe alignment rather than taking premature signals
Technical Notes:
All calculations use Pine Script's security function to fetch data from multiple timeframes
Prevents repainting by using confirmed bar data
Gauge updates in real-time on the last bar
Daily labels mark at the open of each new daily candle
Works on all instruments and timeframes
This indicator is ideal for traders who want objective, systematic trend identification without the complexity of analyzing multiple indicators manually across different timeframes.
-NATANTIA

Smart MACD Divergence ScannerOriginal Base Indicator: "CM_MacD_Ult_MTF" by ChrisMoody
This indicator builds upon ChrisMoody's excellent multi-timeframe MACD foundation and transforms it into a professional divergence scanner with advanced quality assessment and filtering capabilities. The original MACD visualization and MTF functionality have been preserved while adding completely new divergence detection, scoring, and filtering systems.
🎯 What Makes This Indicator Unique:
Smart MACD Divergence Scanner is a professional tool for detecting MACD-based divergences with an advanced filtering system and signal quality assessment. Unlike standard divergence indicators, this version includes innovative features:
Adaptive Quality Scoring System — each signal receives a score from 0 to 100 based on multiple factors
Volatility Filter — automatic signal suppression during low market volatility periods
Multi-Timeframe Confirmation — divergence verification on higher timeframe for increased reliability
Divergence Strength Analysis — calculation of percentage difference between price and indicator movement
Information Dashboard — detailed real-time signal statistics
Cooldown System — prevention of multiple consecutive signals
💡 How It Works:
The indicator uses the classic divergence concept — the divergence between price movement and the MACD oscillator. However, instead of simple pivot detection, the algorithm:
Scans the market for local extremes (pivots) on price and MACD histogram
Searches for divergences — when price updates low/high while MACD shows opposite movement
Assesses quality — analyzes divergence strength, volatility, higher timeframe confirmation
Filters noise — eliminates weak signals through threshold system and cooldown
Generates signal — only when all quality criteria are met
🔧 Key Parameters:
MACD Settings: Fast Length (12), Slow Length (26), Signal Length (9)
Divergence Detection: Pivot Lookback (5), Max Lookback Range (60), Min Divergence Strength (15%)
Quality Filters: Min Quality Score (60), Volatility Filter, MTF Confirmation, Signal Cooldown (5)
📊 How to Use:
Add indicator to chart — it will automatically start scanning
Configure filters — start with default settings, then adapt to your trading style
Watch for signals: 🟢 Green "BUY" label = bullish divergence, 🔴 Red "SELL" label = bearish divergence
Check quality score on labels (Q: XX)
Use information panel to monitor statistics and current market conditions
⚙️ Settings Guide:
For swing trading (4H-Daily): Increase Pivot Lookback to 7-10, set Min Quality Score to 70+
For day trading (15m-1H): Keep default settings, enable all filters
For scalping (1m-5m): Decrease Min Quality Score to 50, disable MTF Confirmation
For volatile markets (crypto): Increase Min Divergence Strength to 20-25%, enable Volatility Filter
⚠️ Important Notes:
Divergences are probabilistic signals, not guaranteed reversals
Use additional confirmation (support/resistance levels, volume, price action)
Adjust parameters for specific asset and timeframe
Signals appear with Pivot Lookback bars delay (retrospective confirmation)
On volatile markets, increase Min Quality Score to reduce false signals

Scout Regiment - KSI# Scout Regiment - KSI Indicator
## English Documentation
### Overview
Scout Regiment - KSI (Key Stochastic Indicators) is a comprehensive momentum oscillator that combines three powerful technical indicators - RSI, CCI, and Williams %R - into a single, unified display. This multi-indicator approach provides traders with diverse perspectives on market momentum, overbought/oversold conditions, and potential reversal points through advanced divergence detection.
### What is KSI?
KSI stands for "Key Stochastic Indicators" - a composite momentum indicator that:
- Displays multiple oscillators normalized to a 0-100 scale
- Uses standardized bands (20/50/80) for consistent interpretation
- Combines RSI for trend, CCI for cycle, and Williams %R for reversal detection
- Provides enhanced divergence detection specifically for RSI
### Key Features
#### 1. **Triple Oscillator System**
**① RSI (Relative Strength Index)** - Primary Indicator
- **Purpose**: Measures momentum and identifies overbought/oversold conditions
- **Default Length**: 22 periods
- **Display**: Blue line (2px)
- **Key Levels**:
- Above 50: Bullish momentum
- Below 50: Bearish momentum
- Above 80: Overbought
- Below 20: Oversold
- **Special Features**:
- Background color indication (green/red)
- Crossover labels at 50 level
- Full divergence detection (4 types)
**② CCI (Commodity Channel Index)** - Dual Period
- **Purpose**: Identifies cyclical trends and extreme conditions
- **Dual Display**:
- CCI(33): Short-term cycle - Green line (1px)
- CCI(77): Medium-term cycle - Orange line (1px)
- **Default Source**: HLC3 (typical price)
- **Normalized Scale**: Mapped from ±100 to 0-100 for consistency
- **Interpretation**:
- Above 80: Strong upward momentum
- Below 20: Strong downward momentum
- 50 level: Neutral
- Divergence between periods: Trend change warning
**③ Williams %R** - Optional
- **Purpose**: Identifies overbought/oversold extremes
- **Default Length**: 28 periods
- **Display**: Magenta line (2px)
- **Scale**: Inverted and normalized to 0-100
- **Best For**: Short-term reversal signals
- **Default**: Disabled (enable when needed for extra confirmation)
#### 2. **Standardized Band System**
**Three-Level Structure:**
- **Upper Band (80)**: Overbought zone
- Strong momentum area
- Watch for reversal signals
- Divergences here are most reliable
- **Middle Line (50)**: Equilibrium
- Separates bullish/bearish zones
- Crossovers indicate momentum shifts
- Key decision level
- **Lower Band (20)**: Oversold zone
- Weak momentum area
- Look for bounce signals
- Divergences here signal potential reversals
**Band Fill**: Dark background between 20-80 for visual clarity
#### 3. **RSI Visual Enhancements**
**Background Color Indication**
- Green background: RSI above 50 (bullish bias)
- Red background: RSI below 50 (bearish bias)
- Optional display for cleaner charts
- Helps identify overall momentum direction
**Crossover Labels**
- "突破" (Breakout): RSI crosses above 50
- "跌破" (Breakdown): RSI crosses below 50
- Marks momentum shift points
- Can be toggled on/off
#### 4. **Advanced RSI Divergence Detection**
The indicator includes comprehensive divergence detection for RSI only (most reliable oscillator):
**Regular Bullish Divergence (Yellow)**
- **Price**: Lower lows
- **RSI**: Higher lows
- **Signal**: Potential upward reversal
- **Label**: "涨" (Up)
- **Most Common**: Near oversold levels (below 30)
**Regular Bearish Divergence (Blue)**
- **Price**: Higher highs
- **RSI**: Lower highs
- **Signal**: Potential downward reversal
- **Label**: "跌" (Down)
- **Most Common**: Near overbought levels (above 70)
**Hidden Bullish Divergence (Light Yellow)**
- **Price**: Higher lows
- **RSI**: Lower lows
- **Signal**: Uptrend continuation
- **Label**: "隐涨" (Hidden Up)
- **Use**: Add to existing longs
**Hidden Bearish Divergence (Light Blue)**
- **Price**: Lower highs
- **RSI**: Higher highs
- **Signal**: Downtrend continuation
- **Label**: "隐跌" (Hidden Down)
- **Use**: Add to existing shorts
**Divergence Parameters** (Fully Customizable):
- **Right Lookback**: Bars to right of pivot (default: 5)
- **Left Lookback**: Bars to left of pivot (default: 5)
- **Max Range**: Maximum bars between pivots (default: 60)
- **Min Range**: Minimum bars between pivots (default: 5)
### Configuration Settings
#### KSI Display Settings
- **Show RSI**: Toggle RSI indicator
- **Show CCI**: Toggle both CCI lines
- **Show Williams %R**: Toggle Williams %R (optional)
#### RSI Settings
- **RSI Length**: Period for calculation (default: 22)
- **Data Source**: Price source (default: close)
- **Show Background**: Toggle green/red background
- **Show Cross Labels**: Toggle 50-level crossover labels
#### RSI Divergence Settings
- **Right Lookback**: Pivot detection right side
- **Left Lookback**: Pivot detection left side
- **Max Range**: Maximum lookback distance
- **Min Range**: Minimum lookback distance
- **Show Regular Divergence**: Enable regular divergence lines
- **Show Regular Labels**: Enable regular divergence labels
- **Show Hidden Divergence**: Enable hidden divergence lines
- **Show Hidden Labels**: Enable hidden divergence labels
#### CCI Settings
- **CCI Length**: Short-term period (default: 33)
- **CCI Mid Length**: Medium-term period (default: 77)
- **Data Source**: Price calculation (default: HLC3)
- **Show CCI(33)**: Toggle short-term CCI
- **Show CCI(77)**: Toggle medium-term CCI
#### Williams %R Settings
- **Length**: Calculation period (default: 28)
- **Data Source**: Price source (default: close)
### How to Use
#### For Basic Momentum Trading
1. **Enable RSI Only** (primary indicator)
- Focus on 50-level crossovers
- Enable crossover labels for signals
2. **Identify Momentum Direction**
- RSI > 50 = Bullish momentum
- RSI < 50 = Bearish momentum
- Background color confirms direction
3. **Look for Extremes**
- RSI > 80 = Overbought (consider selling)
- RSI < 20 = Oversold (consider buying)
4. **Trade Setup**
- Enter long when RSI crosses above 50 from oversold
- Enter short when RSI crosses below 50 from overbought
#### For Divergence Trading
1. **Enable RSI with Divergence Detection**
- Turn on regular divergence
- Optionally add hidden divergence
2. **Wait for Divergence Signal**
- Yellow label = Bullish divergence
- Blue label = Bearish divergence
3. **Confirm with Price Structure**
- Wait for support/resistance break
- Look for candlestick patterns
- Check volume confirmation
4. **Enter Position**
- Enter after confirmation
- Stop beyond divergence pivot
- Target next key level
#### For Multi-Oscillator Confirmation
1. **Enable All Three Indicators**
- RSI (momentum)
- CCI dual (cycle analysis)
- Williams %R (extremes)
2. **Look for Alignment**
- All above 50 = Strong bullish
- All below 50 = Strong bearish
- Mixed signals = Consolidation
3. **Identify Extremes**
- All indicators > 80 = Extreme overbought
- All indicators < 20 = Extreme oversold
4. **Trade Reversals**
- Enter counter-trend when all aligned at extremes
- Confirm with divergence if available
- Use tight stops
#### For CCI Dual-Period Analysis
1. **Enable Both CCI Lines**
- CCI(33) = Short-term
- CCI(77) = Medium-term
2. **Watch for Crossovers**
- Green crosses above orange = Bullish acceleration
- Green crosses below orange = Bearish acceleration
3. **Analyze Divergence Between Periods**
- Short-term rising, medium falling = Potential reversal
- Both rising together = Strong trend
4. **Trade Accordingly**
- Follow crossover direction
- Exit when lines converge
### Trading Strategies
#### Strategy 1: RSI 50-Level Crossover
**Setup:**
- Enable RSI with background and labels
- Wait for clear trend
- Look for retracement to 50 level
**Entry:**
- Long: "突破" label appears after pullback
- Short: "跌破" label appears after bounce
**Stop Loss:**
- Long: Below recent swing low
- Short: Above recent swing high
**Exit:**
- Opposite crossover label
- Or predetermined target (2:1 risk-reward)
**Best For:** Trend following, clear markets
#### Strategy 2: RSI Divergence Reversal
**Setup:**
- Enable RSI with regular divergence
- Wait for extreme levels (>70 or <30)
- Look for divergence signal
**Entry:**
- Long: Yellow "涨" label at oversold level
- Short: Blue "跌" label at overbought level
**Confirmation:**
- Wait for price to break structure
- Check for volume increase
- Look for candlestick reversal pattern
**Stop Loss:**
- Beyond divergence pivot point
**Exit:**
- Take partial profit at 50 level
- Exit remainder at opposite extreme or divergence
**Best For:** Swing trading, range-bound markets
#### Strategy 3: Triple Oscillator Confluence
**Setup:**
- Enable all three indicators
- Wait for all to reach extreme (>80 or <20)
- Look for alignment
**Entry:**
- Long: All three below 20, first one crosses above 20
- Short: All three above 80, first one crosses below 80
**Confirmation:**
- All indicators must align
- Price at support/resistance
- Volume spike helps
**Stop Loss:**
- Fixed percentage or ATR-based
**Exit:**
- When any indicator crosses 50 level
- Or at predetermined target
**Best For:** High-probability reversals, volatile markets
#### Strategy 4: CCI Dual-Period System
**Setup:**
- Enable both CCI lines only
- Disable RSI and Williams %R for clarity
- Watch for crossovers
**Entry:**
- Long: CCI(33) crosses above CCI(77) below 50 line
- Short: CCI(33) crosses below CCI(77) above 50 line
**Confirmation:**
- Both should be moving in entry direction
- Price breaking key level helps
**Stop Loss:**
- When CCIs cross back in opposite direction
**Exit:**
- Both CCIs enter opposite extreme zone
- Or trailing stop
**Best For:** Catching trend continuations, momentum trading
#### Strategy 5: Hidden Divergence Continuation
**Setup:**
- Enable RSI with hidden divergence
- Confirm existing trend
- Wait for pullback
**Entry:**
- Uptrend: "隐涨" label during pullback
- Downtrend: "隐跌" label during bounce
**Confirmation:**
- Price holds key moving average
- Trend structure intact
**Stop Loss:**
- Beyond pullback extreme
**Exit:**
- Regular divergence appears (reversal warning)
- Or trend structure breaks
**Best For:** Adding to positions, trend trading
### Best Practices
#### Choosing Which Indicators to Display
**For Beginners:**
- Use RSI only
- Enable background color and labels
- Focus on 50-level crossovers
- Simple and effective
**For Intermediate Traders:**
- RSI + Regular Divergence
- Add CCI for confirmation
- Use dual perspectives
- Better accuracy
**For Advanced Traders:**
- All three indicators
- Full divergence detection
- Multi-timeframe analysis
- Maximum information
#### Oscillator Priority
**Primary**: RSI (22)
- Most reliable
- Best divergence detection
- Good for all timeframes
- Use this as your main decision maker
**Secondary**: CCI (33/77)
- Adds cycle analysis
- Great for confirmation
- Dual-period crossovers valuable
- Use to confirm RSI signals
**Tertiary**: Williams %R (28)
- Extreme readings useful
- More volatile
- Best for short-term
- Use sparingly for extra confirmation
#### Timeframe Considerations
**Lower Timeframes (1m-15m):**
- More signals, less reliable
- Use tight divergence parameters
- Focus on RSI crossovers
- Quick entries and exits
**Medium Timeframes (30m-4H):**
- Balanced signal frequency
- Default settings work well
- Best for divergence trading
- Swing trading optimal
**Higher Timeframes (Daily+):**
- Fewer but stronger signals
- Widen divergence ranges
- All indicators more reliable
- Position trading best
#### Divergence Trading Tips
1. **Wait for Confirmation**
- Divergence alone isn't enough
- Need price structure break
- Volume helps validate
2. **Best at Extremes**
- Divergences near 80/20 levels most reliable
- Mid-level divergences often fail
- Combine with support/resistance
3. **Multiple Divergences**
- Second divergence stronger than first
- Third divergence extremely powerful
- Watch for "triple divergence"
4. **Timeframe Alignment**
- Check higher timeframe for direction
- Trade divergences in direction of larger trend
- Counter-trend divergences riskier
### Indicator Combinations
**With Moving Averages:**
- Use EMAs (21/55/144) for trend
- KSI for entry timing
- Enter when both align
**With Volume:**
- Volume confirms breakouts
- Divergence + volume divergence = Stronger
- Low volume at extremes = Reversal likely
**With Support/Resistance:**
- Price levels for targets
- KSI for entry timing
- Divergences at levels = Highest probability
**With Bias Indicator:**
- Bias shows price deviation
- KSI shows momentum
- Both diverging = Strong reversal signal
**With OBV Indicator:**
- OBV shows volume trend
- KSI shows price momentum
- Volume/momentum divergence powerful
### Common Patterns
1. **Bullish Reversal**: All oscillators oversold + RSI bullish divergence
2. **Bearish Reversal**: All oscillators overbought + RSI bearish divergence
3. **Trend Acceleration**: RSI > 50, both CCIs rising, Williams %R not extreme
4. **Weakening Trend**: RSI declining while price rising (pre-divergence warning)
5. **Strong Trend**: All oscillators stay above/below 50 for extended period
6. **Consolidation**: Oscillators crossing 50 frequently without extremes
7. **Exhaustion**: Multiple oscillators at extreme + hidden divergence failure
### Performance Tips
- Start simple: RSI only
- Add indicators gradually as you learn
- Disable unused features for cleaner charts
- Use labels strategically (not always on)
- Test different RSI lengths for your market
- Adjust divergence parameters based on volatility
### Alert Conditions
The indicator includes alerts for:
- RSI crossing above 50
- RSI crossing below 50
- RSI regular bullish divergence
- RSI regular bearish divergence
- RSI hidden bullish divergence
- RSI hidden bearish divergence
---
## 中文说明文档
### 概述
Scout Regiment - KSI(关键随机指标)是一个综合性动量振荡器,将三个强大的技术指标 - RSI、CCI和威廉指标 - 组合到一个统一的显示中。这种多指标方法为交易者提供了市场动量、超买超卖状况和通过高级背离检测发现潜在反转点的多元视角。
### 什么是KSI?
KSI代表"关键随机指标" - 一个综合动量指标:
- 显示多个振荡器,标准化到0-100刻度
- 使用标准化波段(20/50/80)便于一致解读
- 结合RSI用于趋势、CCI用于周期、威廉指标用于反转检测
- 专门为RSI提供增强的背离检测
### 核心功能
#### 1. **三重振荡器系统**
**① RSI(相对强弱指数)** - 主要指标
- **用途**:测量动量并识别超买超卖状况
- **默认长度**:22周期
- **显示**:蓝色线(2像素)
- **关键水平**:
- 50以上:看涨动量
- 50以下:看跌动量
- 80以上:超买
- 20以下:超卖
- **特殊功能**:
- 背景颜色指示(绿色/红色)
- 50水平穿越标签
- 完整背离检测(4种类型)
**② CCI(顺势指标)** - 双周期
- **用途**:识别周期性趋势和极端状况
- **双重显示**:
- CCI(33):短期周期 - 绿色线(1像素)
- CCI(77):中期周期 - 橙色线(1像素)
- **默认数据源**:HLC3(典型价格)
- **标准化刻度**:从±100映射到0-100以保持一致性
- **解读**:
- 80以上:强劲上升动量
- 20以下:强劲下降动量
- 50水平:中性
- 周期间背离:趋势变化警告
**③ 威廉指标 %R** - 可选
- **用途**:识别超买超卖极值
- **默认长度**:28周期
- **显示**:洋红色线(2像素)
- **刻度**:反转并标准化到0-100
- **最适合**:短期反转信号
- **默认**:禁用(需要额外确认时启用)
#### 2. **标准化波段系统**
**三层结构:**
- **上轨(80)**:超买区域
- 强动量区域
- 注意反转信号
- 此处的背离最可靠
- **中线(50)**:均衡线
- 分隔看涨/看跌区域
- 穿越表示动量转变
- 关键决策水平
- **下轨(20)**:超卖区域
- 弱动量区域
- 寻找反弹信号
- 此处的背离预示潜在反转
**波段填充**:20-80之间的深色背景,增强视觉清晰度
#### 3. **RSI视觉增强**
**背景颜色指示**
- 绿色背景:RSI在50以上(看涨偏向)
- 红色背景:RSI在50以下(看跌偏向)
- 可选显示,图表更清爽
- 帮助识别整体动量方向
**穿越标签**
- "突破":RSI向上穿越50
- "跌破":RSI向下穿越50
- 标记动量转变点
- 可开关
#### 4. **高级RSI背离检测**
指标仅为RSI(最可靠的振荡器)提供全面背离检测:
**常规看涨背离(黄色)**
- **价格**:更低的低点
- **RSI**:更高的低点
- **信号**:潜在向上反转
- **标签**:"涨"
- **最常见**:在超卖水平附近(30以下)
**常规看跌背离(蓝色)**
- **价格**:更高的高点
- **RSI**:更低的高点
- **信号**:潜在向下反转
- **标签**:"跌"
- **最常见**:在超买水平附近(70以上)
**隐藏看涨背离(浅黄色)**
- **价格**:更高的低点
- **RSI**:更低的低点
- **信号**:上升趋势延续
- **标签**:"隐涨"
- **用途**:加仓现有多头
**隐藏看跌背离(浅蓝色)**
- **价格**:更低的高点
- **RSI**:更高的高点
- **信号**:下降趋势延续
- **标签**:"隐跌"
- **用途**:加仓现有空头
**背离参数**(完全可自定义):
- **右侧回溯**:枢轴点右侧K线数(默认:5)
- **左侧回溯**:枢轴点左侧K线数(默认:5)
- **最大范围**:枢轴点之间最大K线数(默认:60)
- **最小范围**:枢轴点之间最小K线数(默认:5)
### 配置设置
#### KSI显示设置
- **显示RSI**:切换RSI指标
- **显示CCI**:切换两条CCI线
- **显示威廉指标 %R**:切换威廉指标(可选)
#### RSI设置
- **RSI长度**:计算周期(默认:22)
- **数据源**:价格源(默认:收盘价)
- **显示背景**:切换绿色/红色背景
- **显示穿越标签**:切换50水平穿越标签
#### RSI背离设置
- **右侧回溯**:枢轴检测右侧
- **左侧回溯**:枢轴检测左侧
- **回溯范围最大值**:最大回溯距离
- **回溯范围最小值**:最小回溯距离
- **显示常规背离**:启用常规背离线
- **显示常规背离标签**:启用常规背离标签
- **显示隐藏背离**:启用隐藏背离线
- **显示隐藏背离标签**:启用隐藏背离标签
#### CCI设置
- **CCI长度**:短期周期(默认:33)
- **CCI中期长度**:中期周期(默认:77)
- **数据源**:价格计算(默认:HLC3)
- **显示CCI(33)**:切换短期CCI
- **显示CCI(77)**:切换中期CCI
#### 威廉指标 %R 设置
- **长度**:计算周期(默认:28)
- **数据源**:价格源(默认:收盘价)
### 使用方法
#### 基础动量交易
1. **仅启用RSI**(主要指标)
- 关注50水平穿越
- 启用穿越标签获取信号
2. **识别动量方向**
- RSI > 50 = 看涨动量
- RSI < 50 = 看跌动量
- 背景颜色确认方向
3. **寻找极值**
- RSI > 80 = 超买(考虑卖出)
- RSI < 20 = 超卖(考虑买入)
4. **交易设置**
- RSI从超卖区向上穿越50时做多
- RSI从超买区向下穿越50时做空
#### 背离交易
1. **启用RSI和背离检测**
- 打开常规背离
- 可选添加隐藏背离
2. **等待背离信号**
- 黄色标签 = 看涨背离
- 蓝色标签 = 看跌背离
3. **用价格结构确认**
- 等待支撑/阻力突破
- 寻找K线形态
- 检查成交量确认
4. **进入仓位**
- 确认后进入
- 止损设在背离枢轴点之外
- 目标下一个关键水平
#### 多振荡器确认
1. **启用全部三个指标**
- RSI(动量)
- CCI双周期(周期分析)
- 威廉指标 %R(极值)
2. **寻找一致性**
- 全部在50以上 = 强劲看涨
- 全部在50以下 = 强劲看跌
- 信号混合 = 盘整
3. **识别极值**
- 所有指标 > 80 = 极度超买
- 所有指标 < 20 = 极度超卖
4. **交易反转**
- 所有指标在极值一致时逆势进入
- 可能的话用背离确认
- 使用紧密止损
#### CCI双周期分析
1. **启用两条CCI线**
- CCI(33) = 短期
- CCI(77) = 中期
2. **观察穿越**
- 绿色线穿越橙色线向上 = 看涨加速
- 绿色线穿越橙色线向下 = 看跌加速
3. **分析周期间背离**
- 短期上升,中期下降 = 潜在反转
- 两者同时上升 = 强趋势
4. **相应交易**
- 跟随穿越方向
- 线条汇合时退出
### 交易策略
#### 策略1:RSI 50水平穿越
**设置:**
- 启用RSI及背景和标签
- 等待明确趋势
- 寻找回调至50水平
**入场:**
- 多头:回调后出现"突破"标签
- 空头:反弹后出现"跌破"标签
**止损:**
- 多头:近期波动低点之下
- 空头:近期波动高点之上
**离场:**
- 出现相反穿越标签
- 或预定目标(2:1风险收益比)
**适合:**趋势跟随、明确市场
#### 策略2:RSI背离反转
**设置:**
- 启用RSI和常规背离
- 等待极端水平(>70或<30)
- 寻找背离信号
**入场:**
- 多头:超卖水平出现黄色"涨"标签
- 空头:超买水平出现蓝色"跌"标签
**确认:**
- 等待价格突破结构
- 检查成交量增加
- 寻找K线反转形态
**止损:**
- 背离枢轴点之外
**离场:**
- 在50水平部分获利
- 其余在相反极值或背离处离场
**适合:**波段交易、震荡市场
#### 策略3:三重振荡器汇合
**设置:**
- 启用全部三个指标
- 等待全部达到极值(>80或<20)
- 寻找一致性
**入场:**
- 多头:三个全部低于20,第一个向上穿越20
- 空头:三个全部高于80,第一个向下穿越80
**确认:**
- 所有指标必须一致
- 价格在支撑/阻力位
- 成交量激增有帮助
**止损:**
- 固定百分比或基于ATR
**离场:**
- 任一指标穿越50水平时
- 或在预定目标
**适合:**高概率反转、波动市场
#### 策略4:CCI双周期系统
**设置:**
- 仅启用两条CCI线
- 禁用RSI和威廉指标以保持清晰
- 观察穿越
**入场:**
- 多头:CCI(33)在50线下方向上穿越CCI(77)
- 空头:CCI(33)在50线上方向下穿越CCI(77)
**确认:**
- 两者都应朝入场方向移动
- 价格突破关键水平有帮助
**止损:**
- CCI反向穿越时
**离场:**
- 两条CCI进入相反极值区域
- 或移动止损
**适合:**捕捉趋势延续、动量交易
#### 策略5:隐藏背离延续
**设置:**
- 启用RSI和隐藏背离
- 确认现有趋势
- 等待回调
**入场:**
- 上升趋势:回调期间出现"隐涨"标签
- 下降趋势:反弹期间出现"隐跌"标签
**确认:**
- 价格守住关键移动平均线
- 趋势结构完整
**止损:**
- 回调极值之外
**离场:**
- 出现常规背离(反转警告)
- 或趋势结构破坏
**适合:**加仓、趋势交易
### 最佳实践
#### 选择显示哪些指标
**新手:**
- 仅使用RSI
- 启用背景颜色和标签
- 关注50水平穿越
- 简单有效
**中级交易者:**
- RSI + 常规背离
- 添加CCI确认
- 使用双重视角
- 更高准确度
**高级交易者:**
- 全部三个指标
- 完整背离检测
- 多时间框架分析
- 信息最大化
#### 振荡器优先级
**主要**:RSI (22)
- 最可靠
- 最佳背离检测
- 适用所有时间框架
- 用作主要决策依据
**次要**:CCI (33/77)
- 添加周期分析
- 确认效果好
- 双周期穿越有价值
- 用于确认RSI信号
**第三**:威廉指标 %R (28)
- 极值读数有用
- 更波动
- 最适合短期
- 谨慎使用以获额外确认
#### 时间框架考虑
**低时间框架(1分钟-15分钟):**
- 更多信号,可靠性较低
- 使用紧密背离参数
- 关注RSI穿越
- 快速进出
**中等时间框架(30分钟-4小时):**
- 信号频率平衡
- 默认设置效果好
- 最适合背离交易
- 波段交易最优
**高时间框架(日线+):**
- 信号较少但更强
- 扩大背离范围
- 所有指标更可靠
- 最适合仓位交易
#### 背离交易技巧
1. **等待确认**
- 仅背离不够
- 需要价格结构突破
- 成交量帮助验证
2. **极值处最佳**
- 80/20水平附近的背离最可靠
- 中间水平背离常失败
- 结合支撑/阻力
3. **多重背离**
- 第二次背离强于第一次
- 第三次背离极其强大
- 注意"三重背离"
4. **时间框架对齐**
- 检查更高时间框架方向
- 顺大趋势方向交易背离
- 逆势背离风险更大
### 指标组合
**与移动平均线配合:**
- 使用EMA(21/55/144)确定趋势
- KSI用于入场时机
- 两者一致时进入
**与成交量配合:**
- 成交量确认突破
- 背离 + 成交量背离 = 更强
- 极值处低成交量 = 可能反转
**与支撑/阻力配合:**
- 价格水平作为目标
- KSI用于入场时机
- 水平处的背离 = 最高概率
**与Bias指标配合:**
- Bias显示价格偏离
- KSI显示动量
- 两者都背离 = 强反转信号
**与OBV指标配合:**
- OBV显示成交量趋势
- KSI显示价格动量
- 成交量/动量背离强大
### 常见形态
1. **看涨反转**:所有振荡器超卖 + RSI看涨背离
2. **看跌反转**:所有振荡器超买 + RSI看跌背离
3. **趋势加速**:RSI > 50,两条CCI上升,威廉指标不极端
4. **趋势减弱**:价格上升时RSI下降(背离前警告)
5. **强趋势**:所有振荡器长时间保持在50上方/下方
6. **盘整**:振荡器频繁穿越50无极值
7. **衰竭**:多个振荡器在极值 + 隐藏背离失败
### 性能提示
- 从简单开始:仅RSI
- 学习时逐渐添加指标
- 禁用未使用功能以保持图表清晰
- 策略性使用标签(不总是开启)
- 为您的市场测试不同RSI长度
- 根据波动性调整背离参数
### 警报条件
指标包含以下警报:
- RSI向上穿越50
- RSI向下穿越50
- RSI常规看涨背离
- RSI常规看跌背离
- RSI隐藏看涨背离
- RSI隐藏看跌背离
---
## Technical Support
For questions or issues, please refer to the TradingView community or contact the indicator creator.
## 技术支持
如有问题,请参考TradingView社区或联系指标创建者。

EMA Dynamic Crossover Detector with Real-Time Signal TableDescriptionWhat This Indicator Does:This indicator monitors all possible crossovers between four key exponential moving averages (20, 50, 100, and 200 periods) and displays them both visually on the chart and in an organized data table. Unlike standard EMA indicators that only plot the lines, this tool actively detects every crossover event, marks the exact crossover point with a circle, records the precise price level, and maintains a running log of all crossovers during the trading session. It's designed for traders who want comprehensive EMA crossover analysis without manually watching multiple moving average pairs.Key Features:
Four Essential EMAs: Plots 20, 50, 100, and 200-period exponential moving averages with color-coded thin lines for clean chart presentation
Complete Crossover Detection: Monitors all 6 possible EMA pair combinations (20×50, 20×100, 20×200, 50×100, 50×200, 100×200) in both directions
Precise Price Marking: Places colored circles at the exact average price where crossovers occur (not just at candle close)
Real-Time Signal Table: Displays up to 10 most recent crossovers with timestamp, direction, exact price, and signal type
Session Filtering: Only records crossovers during active trading hours (10:00-18:00 Istanbul time) to avoid noise from low-liquidity periods
Automatic Daily Reset: Clears the signal table at the start of each new trading day for fresh analysis
Built-In Alerts: Two alert conditions (bullish and bearish crossovers) that can be configured to send notifications
How It Works:The indicator calculates four exponential moving averages using the standard EMA formula, then continuously monitors for crossover events using Pine Script's ta.crossover() and ta.crossunder() functions:Bullish Crossovers (Green ▲):
When a faster EMA crosses above a slower EMA, indicating potential upward momentum:
20 crosses above 50, 100, or 200
50 crosses above 100 or 200
100 crosses above 200 (Golden Cross when it's the 50×200)
Bearish Crossovers (Red ▼):
When a faster EMA crosses below a slower EMA, indicating potential downward momentum:
20 crosses below 50, 100, or 200
50 crosses below 100 or 200
100 crosses below 200 (Death Cross when it's the 50×200)
Price Calculation:
Instead of marking crossovers at the candle's close price (which might not be where the actual cross occurred), the indicator calculates the average price between the two crossing EMAs, providing a more accurate representation of the crossover point.Signal Table Structure:The table in the top-right corner displays four columns:
Saat (Time): Exact time of crossover in HH:MM format
Yön (Direction): Arrow indicator (▲ green for bullish, ▼ red for bearish)
Fiyat (Price): Calculated average price at the crossover point
Durum (Status): Signal classification ("ALIŞ" for buy signals, "SATIŞ" for sell signals) with color-coded background
The table shows up to 10 most recent crossovers, automatically updating as new signals appear. If no crossovers have occurred during the session within the time filter, it displays "Henüz kesişim yok" (No crossovers yet).EMA Color Coding:
EMA 20 (Aqua/Turquoise): Fastest-reacting, most sensitive to recent price changes
EMA 50 (Green): Short-term trend indicator
EMA 100 (Yellow): Medium-term trend indicator
EMA 200 (Red): Long-term trend baseline, key support/resistance level
How to Use:For Day Traders:
Monitor 20×50 crossovers for quick entry/exit signals within the day
Use the time filter (10:00-18:00) to focus on high-volume trading hours
Check the signal table throughout the session to track momentum shifts
Look for confirmation: if 20 crosses above 50 and price is above EMA 200, bullish bias is stronger
For Swing Traders:
Focus on 50×200 crossovers (Golden Cross/Death Cross) for major trend changes
Use higher timeframes (4H, Daily) for more reliable signals
Wait for price to close above/below the crossover point before entering
Combine with support/resistance levels for better entry timing
For Position Traders:
Monitor 100×200 crossovers on daily/weekly charts for long-term trend changes
Use as confirmation of major market shifts
Don't react to every crossover—wait for sustained movement after the cross
Consider multiple timeframe analysis (if crossovers align on weekly and daily, signal is stronger)
Understanding EMA Hierarchies:The indicator becomes most powerful when you understand EMA relationships:Bullish Hierarchy (Strongest to Weakest):
All EMAs ascending (20 > 50 > 100 > 200): Strong uptrend
20 crosses above 50 while both are above 200: Pullback ending in uptrend
50 crosses above 200 while 20/50 below: Early trend reversal signal
Bearish Hierarchy (Strongest to Weakest):
All EMAs descending (20 < 50 < 100 < 200): Strong downtrend
20 crosses below 50 while both are below 200: Rally ending in downtrend
50 crosses below 200 while 20/50 above: Early trend reversal signal
Trading Strategy Examples:Pullback Entry Strategy:
Identify major trend using EMA 200 (price above = uptrend, below = downtrend)
Wait for pullback (20 crosses below 50 in uptrend, or above 50 in downtrend)
Enter when 20 re-crosses 50 in the trend direction
Place stop below/above the recent swing point
Exit when 20 crosses 50 against the trend again
Golden Cross/Death Cross Strategy:
Wait for 50×200 crossover (appears in the signal table)
Verify: Check if crossover occurs with increasing volume
Entry: Enter in the direction of the cross after a pullback
Stop: Place stop below/above the 200 EMA
Target: Swing high/low or when opposite crossover occurs
Multi-Crossover Confirmation:
Watch for multiple crossovers in the same direction within a short period
Example: 20×50 crossover followed by 20×100 = strengthening momentum
Enter after the second confirmation crossover
More crossovers = stronger signal but also means you're entering later
Time Filter Benefits:The 10:00-18:00 Istanbul time filter prevents recording crossovers during:
Pre-market volatility and gaps
Low-volume overnight sessions (for 24-hour markets)
After-hours erratic movements
