Sonic R + Linear Reg + Kumo Cloud + Barcolor MACDSoni R with Linear Reg + Kumo CLoud + Barclolor MACD:
Buy or Sell signal, stoploss and take profit with 3:1 RR don't close when appear signal close.
When barcolor is red, don't buy, and when it is green, don't sell.
Enjoy, and goodluck!
Sr for bad english.
在腳本中搜尋"科创板医药板块股票技术指标分析(MACD、成交量、支撑位压力位)"

RSI Convergence DivergenceRSI based oscillator inspired by the MACD.
Indicator that consists of two RSI calibrated at different lengths to take advantage of their convergence, divergence, overall direction, overall strength and several other metrics to extract signals from the price action.
This indicator includes:
- Fast RSI
- Slow RSI
- Signal line to identify convergence/divergence
- Simple moving average applied to the average of the two RSI
- DEMA applied to the average of the two RSI
- An average moving average of the SMA and DEMA
Some of the applications of this indicator:
- Simple convergence/divergence signaled by the moving average going above or below zero.
- Crossover between SMA and DEMA
- Combination of convergence/divergence and one of the 3 MAs reaching overbought or oversold threshold
- Average moving average going above or below 50
The combinations of different conditions are countless and limited only by the imagination of the user.
The visualization inputs, besides allowing to choose the candle coloring, give the user the ability to keep the chart clean and only see the signals he is interested into.

Momentum-based ZigZag (incl. QQE) NON-REPAINTINGI spent a lot of time searching for the best ZigZag indicator. Difficulty with all of them is that they are always betting on some pre-defined rules which identify or confirm pivot points. Usually it is time factor - pivot point gets confirmed after a particular number of candles. This methodology is probably the best when market is moving relatively slow, but when price starts chopping up and down, there is no way the ZigZag follows accurately. On the other hand if you set it too tight (for example pivot confirmation after only 2 or even 1 candle), you will get hundreds of zigzag lines and they will tell you nothing.
My point of view is to follow the market. If it has reversed, then it has reversed, and there is no need to wait pre-defined number of candles for the confirmation. Such reversals will always be visible on momentum indicators, such as the most popular MACD. But a single-line moving average can be also good enough to notice reversals. Or my favourite one - QQE, which I borrowed (and improved) from JustUncleL, who borrowed it from Glaz, who borrowed it from... I don't even know where Quantitative Qualitative Estimation originates from. Thanks to all these guys for their input and code.
So whichever momentum indicator you choose - yes, there is a pick-your-poison-type selector as in in-famous Moving Average indicators - once it reverses, a highest (or lowest) point from the impulse is caught and ZigZag gets printed.
One thing I need to emphasize. This indicator DOES NOT REPAINT. It might look like the lines are a bit delayed, especially when compared to all the other ZigZag indicators on TradingView, but they are actually TRUE. There is a value in this - my indicator prints pivot points and Zigzag exactly on the moment they have been noticed, not earlier faking to be faster than they could be.
As a bonus, the indicator marks which impulse had strength in it. It is very nice to see a progressing impulse, but without force - a very likely that reversal on a bigger move is happening.
I'm about to publish some more scripts based on this ZigZag algo, so follow me on TradingView to get notified.
Enjoy!

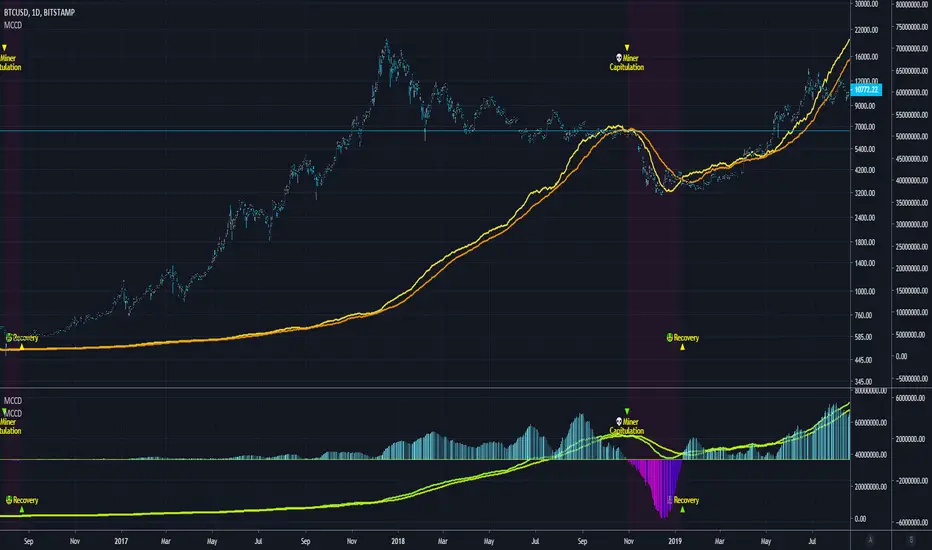
Blockchain Fundamentals - MCCD - Miner Capitulation Conv/Div🔗Blockchain Fundamentals - MCCD - Miner Capitulation & Convergence Divergence
(a.k.a. Hash Ribbons)
Intro
Miner Capitulation has been talked about alot recently in the news and on twitter. I wanted to join the in fun and add my own spin on things.
Description
This shows the 30 (yellow) and 60 (orange) day moving average of the hash rate of bitcoin. I added an option to show the convergence/divergence of the two moving averages in a visual manner similar to the MACD.
I also added the ability to select both the length and type of MA used in the calculation of the capitulation so you can experiment.
Other additions include bar coloration by trade state, and background highlighting of capitulation periods.
Editable Capitulation/Recovery plots will show clearly when the crosses happen.
The way to replicate my display is to add the indicator twice below the chart and combine in the same pane. First indicator displays the averages by default. The second one you enable convergence/divergence display option and uncheck the rest.
Last I add the indicator one more time and dragged it on chart. Do not combine the scales into one, of else it will ruin the scale (you want them separate scales). Its just showing you possibilities, use whatever works for you!
👍 We hope you enjoyed this indicator and find it useful! We post free crypto analysis, strategies and indicators regularly. This is our 73rd script on Tradingview!
💬Check my Signature for other information
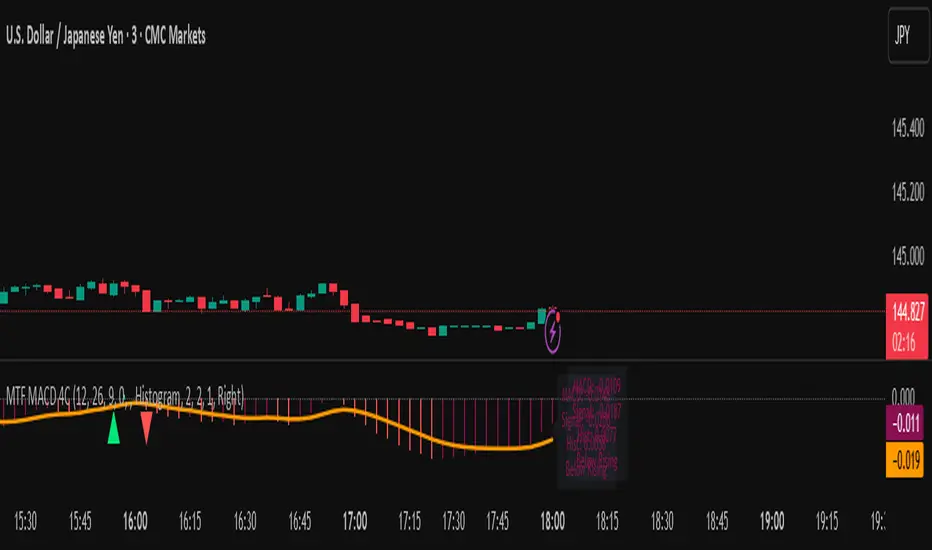
Easy-Read MACD (Signals & Zones)This Pine Script transforms the traditional MACD into a much clearer, more visual momentum tool. It calculates the standard MACD (12, 26, 9) and then enhances readability using color cues and signal markers. The histogram bars dynamically change brightness to show whether momentum is strengthening or weakening — bright green/red means increasing strength, while faded colors mean losing momentum.
Background colors further simplify interpretation: green when MACD is above zero and above the signal (bullish), red when below zero and below the signal (bearish), and pale yellow in neutral or transition periods. Arrows clearly mark signal-line and zero-line crossovers, giving instant visual confirmation of bullish or bearish momentum shifts. The indicator also includes optional alerts for these events, so you can get notified when momentum flips even without watching the chart.
⚡ Quick-Read Sheet
Green background:
→ MACD > 0 and above signal — bullish momentum zone. Market trending up.
Red background:
→ MACD < 0 and below signal — bearish momentum zone. Market trending down.
Yellow background:
→ Transition or sideways momentum. Trend is uncertain — avoid strong directional trades.
Bright green histogram bars:
→ Positive momentum increasing — bulls gaining strength.
Faded green histogram bars:
→ Positive momentum weakening — rally may be losing steam.
Bright red histogram bars:
→ Negative momentum increasing — bears gaining control.
Faded red histogram bars:
→ Negative momentum weakening — possible bottoming or reversal setup.
Up arrow “MACD↑Sig”:
→ MACD crosses above signal line — bullish shift, potential buy or long continuation signal.
Down arrow “MACD↓Sig”:
→ MACD crosses below signal line — bearish shift, possible sell or short signal.
Up arrow “MACD>0”:
→ MACD crosses above zero line — confirms bullish trend bias.
Down arrow “MACD<0”:
→ MACD crosses below zero line — confirms bearish trend bias.

Squeeze Momentum MACDSqueeze Momentum MACD
🧠 Description
Squeeze Momentum MACD combines the concept of market volatility compression (the “squeeze”) from Bollinger Bands (BB) and Keltner Channels (KC) with a MACD-style momentum oscillator to reveal potential breakout phases.
The indicator first calculates:
BB Width = Upper Band − Lower Band
KC Width = Upper Band − Lower Band
Then it computes their difference:
Δ = BB Width − KC Width
When Δ > 0 → BB width is greater than KC width → volatility is expanding → potential momentum breakout.
When Δ < 0 → BB is inside KC → volatility is compressing → potential squeeze phase before expansion.
This Δ value is then processed through a MACD-style calculation:
MACD Line = EMA(fast) − EMA(slow)
Signal Line = EMA(MACD, signal length)
Histogram = MACD − Signal
The result is a visual momentum oscillator that behaves like MACD but measures volatility expansion instead of price direction.
🔹 Features:
Dynamic 4-color MACD & Signal lines (positive/negative + rising/falling)
Optional display of raw BB & KC widths
Fully adjustable parameters for BB, KC, and MACD
Works on all timeframes and instruments
🔹 Ideal For:
Detecting market squeezes and breakout momentum
Timing entries before volatility expansion
Integrating volatility and momentum into a single framework

Multi-Timeframe MACD with Color Mix (Nikko)Multi-Timeframe MACD with Color Mix (Nikko) Indicator
This documentation explains the benefits of the "Multi-Timeframe MACD with Color Mix (Nikko)" indicator for traders and provides easy-to-follow steps on how to use it. Written as of 05:06 AM +07 on Saturday, October 04, 2025, this guide focuses on helping you, as a trader, get the most out of this tool with clear, practical advice before diving into the technical details.
Benefits for Traders
1. Multi-Timeframe Insight
This indicator lets you see momentum trends across 15-minute, 1-hour, 1-day, and 1-week timeframes all on one chart. This big-picture view helps you catch both quick market moves and long-term trends without flipping between charts, saving you time and giving you a fuller understanding of the market.
2. Visual Momentum Representation
The background changes from red to green based on short-term (15m) momentum, giving you a quick, easy-to-see signal—red means bearish (prices might drop), and green means bullish (prices might rise). The histogram uses a mix of red, green, and blue colors to show the combined strength of the 1-hour, 1-day, and 1-week timeframes, helping you spot strong trends at a glance (e.g., a bright mix for strong momentum, darker for weaker).
3. Enhanced Decision-Making
The background and histogram colors work together to confirm trends across different timeframes, making it less likely you’ll act on a false signal. This helps you feel more confident when deciding when to buy, sell, or hold.
4. Proactive Alert System
You can set alerts to notify you when the percentage of bullish timeframes hits your chosen levels (e.g., below 10% for bearish, above 90% for bullish). This keeps you in the loop on big momentum shifts without needing to watch the chart all day—perfect for when you’re busy.
5. Flexibility and Efficiency
You can turn timeframes on or off, adjust settings like speed of the moving averages, and tweak transparency to fit your trading style—whether you’re a fast scalper or a patient swing trader. Everything is shown on one chart, saving you effort, and the colors make it simple to read, even if you’re new to trading.
How to Use It
Getting Started
Add the Indicator: Load the "Multi-Timeframe MACD with Color Mix (Nikko)" onto your TradingView chart using the Pine Script editor or indicator library.
Pick Your Timeframes: Turn on the timeframes that match your trading—use 15m and 1h for quick trades, or 1d and 1w for longer holds—using the enable_15m, enable_1h, enable_1d, enable_1w, and enable_background options.
Reading the Colors
Background Gradient: Watch for red to signal bearish 15m momentum and green for bullish momentum. Adjust the Background_transparency (default 75%, or 25% opacity) if the chart feels too busy—try lowering it to 50 for clearer candlesticks in fast markets.
Histogram and EMA Colors:
The histogram and its Exponential Moving Average (EMA) line show a mix of red (1-week), green (1-day), and blue (1-hour) based on how strong the momentum is in each timeframe.
Brighter colors mean stronger momentum—white (all bright) shows all timeframes are pushing up hard, while darker shades (like gray or black) mean weaker or mixed momentum.
Turn off a timeframe (e.g., enable_1h = false) to see how it changes the color mix and focus on what matters to you.
Setting Alerts
Set Your Levels: Choose a threshold_low (default 10%) and threshold_high (default 90%) based on your comfort zone or past market patterns to catch big turns.
Get Notifications: Use TradingView alerts to get pings when the market hits your set levels, so you can act without staring at the screen.
Practical Tips
Pair with Other Tools: Use it with support/resistance lines or the RSI to double-check your moves and build a solid plan.
Tweak Settings: Adjust fast_length, slow_length, and signal_smoothing to match your asset’s speed, and bump up the lookback (default 50) for steadier trends in wild markets.
Practice First: Test different timeframe combos on a demo account to find what works best for you.
Understanding the Colors (Simple Explanation)
How Colors Work
The histogram and its EMA line use a color mix based on a simple idea from color theory, like mixing paints with red, green, and blue (RGB):
Red comes from the 1-week timeframe, green from 1-day, and blue from 1-hour.
When all three timeframes show strong upward momentum, they blend into bright white—the brightest color, like a super-bright light telling you the market’s roaring up.
If some timeframes are weak or pulling down, the mix gets darker (like gray or black), warning you the momentum might not be solid.
Brighter is Better
Bright Colors = Strong Opportunity: The brighter the histogram and EMA (closer to white), the more all your chosen timeframes are in agreement that prices are rising. This is your signal to think about buying or holding, as it points to a powerful trend you can ride.
Dark Colors = Caution: A darker mix (toward black) means some timeframes are lagging or bearish, suggesting you might wait or consider selling. It’s like a dim light saying, “Hold on, check again.”
Benefit in Practice: Watching the brightness helps you jump on the best trades fast. For example, a bright white histogram on a green background is like a green traffic light—go for it! A dark gray on red is like a red light—pause and rethink. This quick color check can save you from bad moves and boost your profits when the trend is strong.
Why It Helps
These colors are your fast friend in trading. A bright histogram means all your timeframes are cheering for an uptrend, giving you the confidence to act. A dull one tells you to be careful, helping you avoid traps. It’s like having a color-coded guide to pick the hottest market moments!
Technical Details
Input Parameters
Fast Length (default: 12): Short-term moving average speed.
Slow Length (default: 26): Long-term moving average speed.
Source (default: close): Price data used.
Signal Smoothing (default: 9): Smooths the signal line.
MA Type (default: EMA): Choose EMA or SMA.
Timeframe and Scaling
Timeframes: 15m, 1h, 1d, 1w, with on/off switches.
Lookback Period (default: 50): Sets the data window for trends.
Background Transparency (default: 75%): Controls background see-through level.
MACD Calculation
Per Timeframe: Uses request.security():
MACD Line: ta.ema(src, fast_length) - ta.ema(src, slow_length).
Signal Line: ta.ema(MACD, signal_length).
Histogram: (macd - signal) / 3.0.
Background Gradient
15m Normalization: norm_value = (hist_15m - hist_15m_min) / max(hist_15m_range, 1e-10), limited to 0-1.
RGB Mix: Red drops from 255 to 0, green rises from 0 to 255, blue stays 0.
Apply: color.new(color.rgb(r_val, g_val, b_val), Background_transparency).
Histogram and EMA Colors
Color Assignment:
1h: Blue (#0000FF) if hist_1h >= 0, else black.
1d: Green (#00FF00) if hist_1d >= 0, else black.
1w: Red (#FF0000) if hist_1w >= 0, else black.
Final Color: final_color = color.rgb(min(r, 255), min(g, 255), min(b, 255)).
Plotting: Histogram and EMA use final_color; MACD (#2962FF), signal (#FF6D00).
Alerts
Bullish Percentage: bullish_pct = (bullish_count / bullish_total) * 100, counting hist >= 0.
Triggers: Below threshold_low or above threshold_high.
--------------------------------------------------------------------
Conclusion
The "Multi-Timeframe MACD with Color Mix (Nikko)" is your all-in-one tool to spot trends, confirm moves, and trade smarter with its bright, easy-to-read colors. By using it wisely, you can sharpen your market edge and trade with more confidence.
This README is tailored for traders and reflects the indicator's practical value as of 05:06 AM +07 on October 04, 2025.

Volume-Weighted RSI & Multi-Normalized MACD### Description for Publishing: Volume-Weighted RSI & Multi-Normalized MACD
**Overview**
The "Volume-Weighted RSI & Multi-Normalized MACD" indicator is a powerful and versatile tool designed for traders seeking enhanced momentum and trend analysis. Combining a volume-weighted Relative Strength Index (VW-RSI) with a customizable Moving Average Convergence Divergence (MACD) featuring multiple normalization methods, this indicator provides deep insights into market dynamics. It supports multi-timeframe (MTF) analysis and includes an optional stepped plotting mode for discrete signal visualization, making it ideal for both trend-following and mean-reversion strategies across various markets (stocks, forex, crypto, etc.).
**Key Features**
1. **Volume-Weighted RSI (VW-RSI)**:
- A modified RSI that incorporates trading volume for greater sensitivity to market activity.
- Normalized to a user-defined range (default: -50 to +50) for consistent analysis.
- Optional smoothing with multiple moving average types (SMA, EMA, WMA, VWMA, SMMA, or SMA with Bollinger Bands) to reduce noise and highlight trends.
- Overbought (+20) and oversold (-20) levels for quick reference.
2. **Multi-Normalized MACD**:
- Offers six normalization methods for MACD, allowing traders to tailor the output to their strategy:
- Normalized Volume Weighted MACD (unbounded).
- Min-Max Normalization (bounded).
- Volatility Normalization (unbounded, volatility-adjusted).
- Volatility Normalization with Min-Max (bounded).
- Hyperbolic Tangent Normalization (bounded).
- Arctangent Normalization (bounded).
- Min-Max with Smoothing (bounded).
- All bounded methods scale to the user-defined range (default: -50 to +50), ensuring comparability with VW-RSI.
- Dynamic color changes for MACD line (lime/red) and histogram (aqua/blue/red/maroon) based on momentum and signal line crosses.
3. **Stepped Plotting Mode**:
- Optional mode to plot RSI and MACD as discrete, stepped lines, reducing noise by only updating when values change significantly (configurable thresholds).
- Ideal for traders focusing on clear, actionable signal changes.
4. **Multi-Timeframe Support**:
- Configurable timeframe input (default: chart timeframe) for analyzing RSI and MACD on higher or lower timeframes, enhancing cross-timeframe strategies.
5. **Customizable Display**:
- Toggle options to show/hide MACD line, signal line, histogram, and cross dots.
- Bollinger Bands for RSI smoothing (optional) with adjustable standard deviation multiplier.
- Clear visual cues with horizontal lines for overbought/oversold levels, midline, and MACD bounds.
**Usage Instructions**
1. **Add to Chart**: Apply the indicator to any symbol (e.g., BTCUSD, SPY) on any timeframe (1H, 1D, etc.).
2. **Configure Settings**:
- **General**: Adjust `Lower Bound` (-50 default) and `Upper Bound` (+50 default) for the output range. Set `Timeframe` for MTF analysis. Enable `Stepped?` for discrete plotting.
- **RSI**: Choose `Price Source` (default: ohlc4), `RSI Length` (default: 9), and smoothing options (e.g., EMA, Bollinger Bands). Adjust `RSI Diff Threshold` for stepped mode.
- **MACD**: Select `Price Source`, `Fast Length` (9), `Slow Length` (21), `Signal Length` (9), and a normalization method (default: Volatility Min-Max). Adjust `MACD Diff Threshold` for stepped mode.
- **Display Options**: Toggle MACD components and histogram colors for clarity.
3. **Interpretation**:
- **VW-RSI**: Watch for crosses above +20 (overbought) or below -20 (oversold) for potential reversals. Use smoothed RSI or Bollinger Bands for trend confirmation.
- **MACD**: Look for MACD/Signal line crosses (dots indicate crossings) and histogram changes for momentum shifts. Bounded normalizations align with RSI for unified analysis.
- **Stepped Mode**: Focus on significant changes in RSI/MACD for clearer signals.
4. **Companion Overlay**: For visualization on the main price chart, use the companion script "VW-RSI & MACD Price Overlay" (available separately, requires this script to be published). It plots RSI and MACD as price-scaled echo lines, with toggles to show/hide and customizable scaling (high/low or ATR).
**Who Is This For?**
- **Trend Traders**: Use MACD normalizations and MTF to identify momentum shifts across timeframes.
- **Mean-Reversion Traders**: Leverage VW-RSI’s overbought/oversold signals for entry/exit points.
- **Technical Analysts**: Customize normalization and smoothing to match specific market conditions.
- **All Markets**: Works on stocks, forex, cryptocurrencies, and more, with any timeframe.
**Notes**
- Unbounded MACD normalizations (`enable_nvw`, `enable_vol`) may produce values outside -50/+50, suitable for volatility-focused strategies.
- For price chart overlay, publish this script and use its ID in the companion script’s `request.security` call.
- Adjust scaling inputs in the companion script for optimal visualization on volatile or stable assets.
**Author’s Note**
Developed by NEPOLIX, this indicator combines volume-weighted precision with flexible normalization for robust technical analysis. Feedback and suggestions are welcome to enhance future versions!

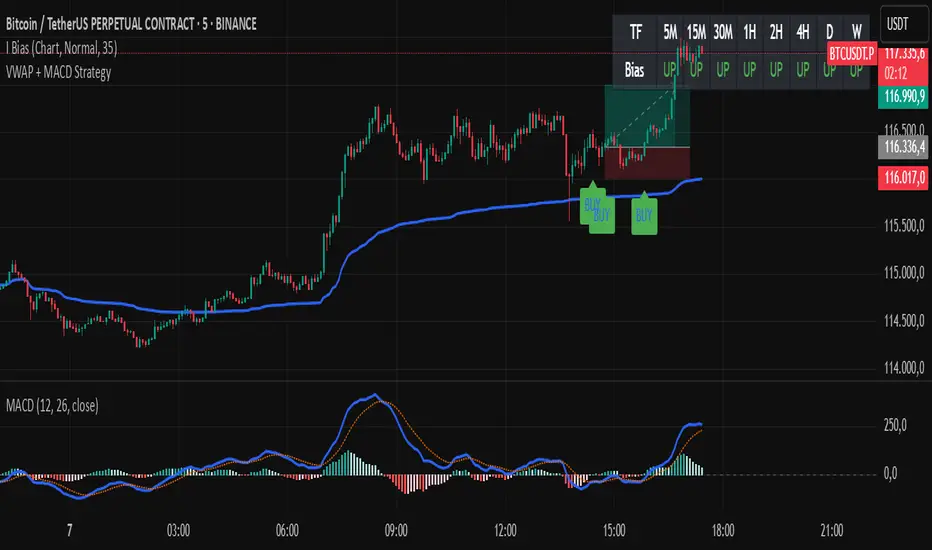
VWAP + MACD Estrategia MilloVWAP + MACD Strategy
This indicator combines the VWAP (Volume Weighted Average Price) with MACD (Moving Average Convergence Divergence) to create buy and sell signals. It helps traders identify potential market entry and exit points based on price action and momentum.
Conditions for Buy:
The price must be above the VWAP.
The MACD line crosses above the signal line (bullish crossover).
The MACD line is below the zero line.
Conditions for Sell:
The price must be below the VWAP.
The MACD line crosses below the signal line (bearish crossover).
The MACD line is above the zero line.
Features:
The VWAP line is plotted to represent the average price, weighted by volume, over a specified period.
Buy signals appear when all conditions are met for an upward price movement.
Sell signals appear when all conditions are met for a downward price movement.
MACD and Signal Line: The MACD helps to confirm momentum, while the signal line indicates possible trend reversals.
Customizable: You can modify the VWAP and MACD parameters to suit different trading strategies.
This strategy is designed for intraday traders and scalpers, aiming to catch quick movements while being aware of market momentum.
Feel free to share this description along with the code! Let me know if you need any adjustments or further explanations.
SCTI-MACDEnglish Description
SCTI-MACD is an advanced multi-feature MACD indicator that combines traditional MACD analysis with divergence detection and flexible display options. This enhanced version offers:
Key Features:
Customizable MACD parameters (fast EMA, slow EMA, signal line periods)
Multi-timeframe capability - analyze MACD from different timeframes on your current chart
Visual customization:
Toggle MACD line, signal line, and histogram visibility
Color-changing MACD line based on signal line crossovers
4-color histogram for better trend visualization
Signal cross markers
Advanced divergence detection:
Regular and hidden divergences for both histogram and MACD line
Configurable lookback periods and price reference (wicks or bodies)
Visual labels for easy identification
Flexible display options to show only the elements you need
The indicator helps identify trend direction, momentum shifts, and potential reversal points through its comprehensive divergence detection system.
中文描述
SCTI-MACD 是一个集成了多种功能的高级MACD指标,结合了传统MACD分析与背离检测功能,并提供灵活的显示选项。这个增强版本提供:
主要功能:
可定制的MACD参数(快EMA、慢EMA、信号线周期)
多时间周期功能 - 在当前图表上分析不同时间周期的MACD
可视化定制:
可切换显示MACD线、信号线和直方图
根据信号线交叉变化颜色的MACD线
四种颜色的直方图,提供更好的趋势可视化
信号交叉标记点
高级背离检测:
直方图和MACD线的常规背离和隐藏背离
可配置的回溯周期和价格参考(影线或实体)
视觉标签便于识别
灵活的显示选项,只显示您需要的元素
该指标通过其全面的背离检测系统,帮助识别趋势方向、动量变化和潜在反转点。
Publishing Notes
When uploading to the community, you may want to include:
Suggested Settings: Recommend your preferred parameter combinations
Usage Tips: Explain how to interpret the different divergence signals
Screenshots: Include images showing the indicator in action with different features enabled
Version Info: Note that it requires Pine Script v5
The indicator name "SCTI-MACD" suggests it may be part of a trading system or methodology - you may want to explain what "SCTI" stands for if it's meaningful to your approach.

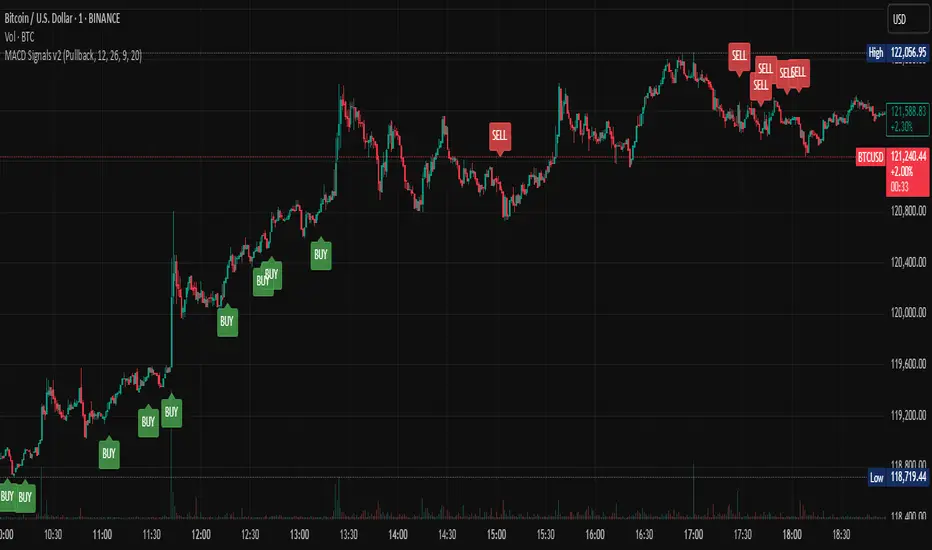
Multi-Mode MACD Signals v2Multi-Mode MACD Signals v2
Signal Types Explained ⚙️
You can now choose your preferred signal from a dropdown menu in the indicator's settings:
Pullback (Default): The original, high-probability strategy. It identifies "buy the dip" and "sell the rally" opportunities within an established trend.
Buy: Triggers on a bullish MACD/Signal line cross above the zero line.
Sell: Triggers on a bearish MACD/Signal line cross below the zero line.
Standard Crossover: The most common MACD signal. It's a pure momentum signal that triggers whenever the MACD line crosses the signal line, regardless of the trend.
Buy: MACD line crosses above the Signal line.
Sell: MACD line crosses below the Signal line.
Zero Line Cross: A trend-change signal. It identifies when the overall momentum shifts from bullish to bearish or vice-versa.
Buy: MACD line crosses above the Zero line.
Sell: MACD line crosses below the Zero line.
How Signals Are Displayed (Real-time vs. Confirmed)
This indicator addresses your request to have signals "display as it occurs" automatically. Here is how it works:
Real-time Alert (As it Occurs): On a live, developing candle, a "BUY" or "SELL" label may appear the instant the MACD conditions are met. This gives you the earliest possible warning.
Signal Repainting: Because the price is still moving within the live candle, the signal may appear and later disappear if the conditions are no longer met by the time the candle closes. This is known as "repainting".
Confirmed Signal: Once the candle closes, the signal is locked in and will never change. This is the confirmed, non-repainting signal.
To create alerts based on these signals, right-click a label on the chart, select "Add alert on Multi-Mode MACD Signals," and choose "Once Per Bar Close" for a confirmed signal or "Once Per Bar" for an earlier, real-time alert.
Adaptive MACD Deluxe [AlgoAlpha]OVERVIEW
This script is an advanced rework of the classic MACD indicator, designed to be more adaptive, visually informative, and customizable. It enhances the original MACD formula using a dynamic feedback loop and a correlation-based weighting system that adjusts in real-time based on how deterministic recent price action is. The signal line is flexible, offering several smoothing types including Heiken Ashi, while the histogram is color-coded with gradients to help users visually identify momentum shifts. It also includes optional normalization by volatility, allowing MACD values to be interpreted as relative percentage moves, making the indicator more consistent across different assets and timeframes.
CONCEPTS
This version of MACD introduces a deterministic weight based on R-squared correlation with time, which modulates how fast or slow the MACD adapts to price changes. Higher correlation means smoother, slower MACD responses, and low correlation leads to quicker reaction. The momentum calculation blends traditional EMA math with feedback and damping components to create a smoother, less noisy series. Heiken Ashi is optionally used for signal smoothing to better visualize short-term trend bias. When normalization is enabled, the MACD is scaled by an EMA of the high-low range, converting it into a bounded, volatility-relative indicator. This makes extreme readings more meaningful across markets.
FEATURES
The script offers six distinct options for signal line smoothing: EMA, SMA, SMMA (RMA), WMA, VWMA, and a custom Heiken Ashi mode based on the MACD series. Each option provides a different response speed and smoothing behavior, allowing traders to match the indicator’s behavior to their strategy—whether it's faster reaction or reduced noise.
Normalization is another key feature. When enabled, MACD values are scaled by a volatility proxy, converting the indicator into a relative percentage. This helps standardize the MACD across different assets and timeframes, making overbought and oversold readings more consistent and easier to interpret.
Threshold zones can be customized using upper and lower boundaries, with inner zones for early warnings. These zones are highlighted on the chart with subtle background fills and directional arrows when MACD enters or exits key levels. This makes it easier to spot strong or weak reversals at a glance.
Lastly, the script includes multiple built-in alerts. Users can set alerts for MACD crossovers, histogram flips above or below zero, and MACD entries into strong or weak reversal zones. This allows for hands-free monitoring and quick decision-making without staring at the chart.
USAGE
To use this script, choose your preferred signal smoothing type, enable normalization if you want MACD values relative to volatility, and adjust the threshold zones to fit your asset or timeframe. Use the colored histogram to detect changes in momentum strength—brighter colors indicate rising strength, while faded colors imply weakening. Heiken Ashi mode smooths out noise and provides clearer signals, especially useful in choppy conditions. Use alert conditions for crossover and reversal detection, or monitor the arrow markers for entries into potential exhaustion zones. This setup works well for trend following, momentum trading, and reversal spotting across all market types.

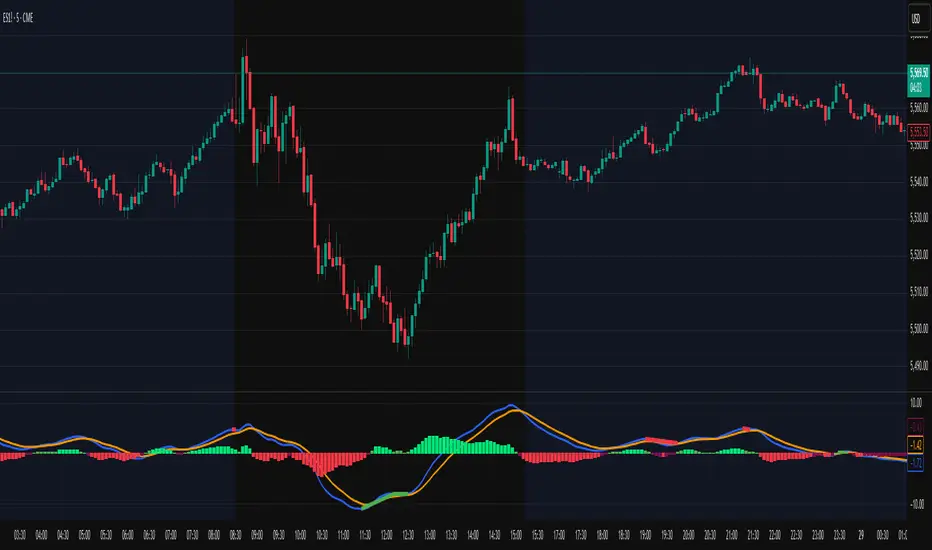
MTF MACD 4-Color Momentum System🎯 Overview
The MTF MACD 4-Color Momentum System is an advanced MACD indicator that provides crystal-clear momentum visualization through an innovative 4-color state system. Unlike traditional MACD indicators that only show positive/negative values, this indicator identifies four distinct market states to help traders make more informed decisions.
📊 Key Features
1. Four-State Color System:
🟢 Lime: Above zero + Rising (Strong Bullish Momentum)
🟢 Dark Green: Above zero + Falling (Weakening Bullish Momentum)
🔴 Red: Below zero + Falling (Strong Bearish Momentum)
🔴 Maroon: Below zero + Rising (Weakening Bearish Momentum)
2. Multi-Timeframe Analysis:
View higher timeframe MACD on lower timeframe charts
Confirm trends across multiple timeframes
Reduce false signals with multi-timeframe confluence
3. Flexible Display Options:
Three visualization styles: Histogram, Columns, or Line
Toggle individual color states on/off
Customizable colors and line widths
4. Advanced Features:
Optional histogram smoothing to reduce noise
Zero-cross alerts with visual markers
Color state change alerts
Real-time value display
Customizable signal line overlay
💡 How to Use
1. Momentum Identification:
Lime bars indicate strong upward momentum - ideal for long entries
Dark green suggests momentum is slowing - consider taking profits
Red bars show strong downward momentum - ideal for short entries
Maroon indicates potential reversal brewing - prepare for direction change
2. Zero Line Crosses:
Blue triangles mark bullish crosses above zero
Pink triangles mark bearish crosses below zero
Use these as confirmation signals with other indicators
3. Multi-Timeframe Confirmation:
Set to higher timeframe (e.g., 4H on 15m chart)
Look for alignment between timeframes before entering trades
Avoid trades against higher timeframe momentum
⚙️ Settings Guide
MACD Parameters:
Fast EMA: 12 (default) - Adjust for more/less sensitivity
Slow EMA: 26 (default) - Standard MACD setting
Signal: 9 (default) - Smoothing period
Display Customization:
Choose between Histogram, Columns, or Line display
Enable/disable specific color states
Adjust visual properties to match your chart theme
Alerts:
Zero cross alerts for trend changes
Color state alerts for momentum shifts
📈 Trading Strategies
1. Momentum Continuation:
Enter longs when MACD turns lime (above zero + rising)
Enter shorts when MACD turns red (below zero + falling)
Exit when color shifts to "weakening" state
2. Reversal Trading:
Watch for maroon in downtrends (potential bottom)
Watch for dark green in uptrends (potential top)
Confirm with price action and support/resistance
3. Multi-Timeframe Confluence:
Use daily MACD on 1H chart for trend direction
Enter on lower timeframe signals in direction of higher timeframe
Avoid counter-trend trades when higher timeframe shows strong momentum
🎓 Pro Tips
Combine with volume indicators for confirmation
Use with support/resistance levels for better entries
Enable smoothing in choppy markets to reduce false signals
Pay attention to divergences between price and MACD
⚠️ Risk Disclaimer
This indicator is for educational purposes only. Always use proper risk management and combine with other analysis methods. Past performance does not guarantee future results.
Smart Adaptive MACDAn advanced MACD variant that dynamically adapts to market volatility using ATR-based scaling.
Key Features:
Volatility-sensitive MACD and Signal lengths
Optional smoothed MACD line
Dynamic histogram heatmap (strong vs. weak momentum)
Built-in Regular and Hidden Divergence detection
Clear visual signals via solid (regular) and dashed (hidden) divergence lines
What makes this different:
Unlike traditional MACD indicators with fixed-length settings, this version adapts in real time
to changing volatility conditions. It shortens during high-momentum environments for faster
reaction, and lengthens during low-volatility phases to reduce noise. This allows better
alignment with market behavior and cleaner momentum signals.
Divergence Detection – How It Works
The Smart Adaptive MACD detects both regular and hidden divergences by comparing price action with the smoothed MACD line. It uses recent pivot highs and lows to evaluate divergence and draws lines on the chart when conditions are met.
Regular Divergence Detection
This type of divergence signals potential reversals. It occurs when the price moves in one
direction while the MACD moves in the opposite.
Bullish Regular Divergence:
Price makes lower lows, but MACD makes higher lows.
Result: A solid green line is plotted beneath the MACD curve.
Bearish Regular Divergence:
Price makes higher highs, but MACD makes lower highs.
Result: A solid red line is plotted above the MACD curve.
Hidden Divergence Detection
This type of divergence signals trend continuation. It occurs when price pulls back slightly,
but the MACD shows deeper movement in the opposite direction.
Bullish Hidden Divergence:
Price makes higher lows, but MACD makes lower lows.
Result: A dashed green line is plotted below the MACD curve.
Bearish Hidden Divergence:
Price makes lower highs, but MACD makes higher highs.
Result: A dashed red line is plotted above the MACD curve.
How to Use:
This tool is best used alongside price structure, key support/resistance levels, or as a
secondary confirmation for your trend or reversal strategy. It is designed to enhance your
interpretation of market momentum and divergence without needing extra chart clutter.
Disclaimer:
This script is provided for educational and informational purposes only. It is not intended as
financial advice or a recommendation to buy or sell any asset. Always conduct your own
research and consult with a licensed financial advisor before making trading decisions. Use
at your own risk.
License:
This script is published under the Mozilla Public License 2.0 and is fully open-source.
Built by AresIQ | 2025
Fibonacci Levels with MACD ConfirmationHow to Understand and Use the Fibonacci Levels with MACD Confirmation Script
This custom Pine Script is designed to give traders a clear visual framework by combining dynamic Fibonacci retracement levels, MACD histogram confirmation, and volatility-based swing zones. It aims to simplify trend analysis, improve entry timing, and adapt to various market conditions.
How to Interpret the 23.6% & 61.8% Labels
These Fibonacci levels represent key retracement zones where price often reacts during trend pullbacks or reversals.
The 23.6% level indicates a shallow retracement, useful in strong trends where price resumes early.
The 61.8% level is a deeper retracement, often a "last line of defense" before trend invalidation.
The script labels these zones with "CC 23.6" and "CC 61.8" when the price crosses them with MACD histogram confirmation:
Green label (CC) = bullish confirmation
Red label (CC) = bearish confirmation
How to Modify Inputs (Manual Adjustments)
Input Purpose Default How to Use
ATR Period Measures volatility 14 Increase for smoother, slower reactions; reduce for faster swings
Min Lookback Minimum bars for swing zone 20 Avoids short-term noise
Max Lookback Cap for swing zone scan 100 Avoids excessively wide retracement levels
Inverse Candle Chart Flips high/low logic false Enable for inverted analysis or backtesting "opposite logic"
How to Use the Inverse Candle Chart Option
Activating inverse mode flips candle logic:
Highs become negative lows, and vice versa.
Useful for:
Contrarian analysis
Inverse ETFs or short-biased views
Backtesting reverse-pattern behavior
How to Adjust the Style
You can manually personalize the script’s visual appearance:
Change line width in plot(..., linewidth=2) for bolder or thinner Fib levels.
Change colors from color.green, color.red, etc., to suit your theme.
Modify label.size, label.style, and label.color for different labeling visuals.
Customize MACD histogram style from plot.style_columns to other styles like style_histogram.
How the MACD is Set and Displayed
The MACD uses non-standard values:
Fast Length = 24
Slow Length = 52
Signal Smoothing = 18
These values slow down the indicator, reducing noise and aligning better with medium- to long-term trends.
MACD histogram is plotted directly on the main chart for faster, on-screen decision making.
Color-coded histogram:
Green/Lime = Bullish momentum increasing or steady
Red/Maroon = Bearish momentum increasing or steady
How to Use the Indicator in Real-World Trading
This indicator is most effective when used to:
✅ 1. Spot High-Probability Trend Continuation Zones
In a strong trend, price will often retrace to 23.6% or 61.8%, then resume.
Wait for:
Price to cross 23.6 or 61.8
MACD histogram rising (bullish) or falling (bearish)
"CC 23.6" or "CC 61.8" label to appear
🟢 Entry Example: Price retraces to Fib 61.8%, crosses up with green MACD histogram → take long position
✅ 2. Validate Reversal or Breakout Zones
These Fib levels also act as support/resistance.
If price crosses a Fib level but MACD fails to confirm, it may be a fake breakout.
Use confirmation labels only when MACD aligns.
✅ 3. Add Volatility Context (ATR) for Risk Management
The ATR label shows both value and %.
Use ATR to:
Set dynamic stop-losses (e.g., 1.5x ATR below entry)
Decide trade size based on volatility
How to Combine the Indicator With Other Tools
You can combine this script with other technical tools for a powerful trading framework:
🔁 With Moving Averages
Use 50/200 MA for overall trend direction
Take signals only in the direction of MA slope
🔄 With Price Action Patterns
Use the Fib/MACD signals at confluence points:
Support/resistance zones
Breakout retests
Candlestick patterns (pin bars, engulfing)
🔺 With Volume or Order Flow
Combine with volume spikes or order book signals
Confirm that Fib/MACD signals align with strong volume for conviction
✅ Trade Setup Summary
Criteria Long Setup Short Setup
Price at Fib Level At or crossing Fib 23.6 / 61.8 Same
MACD Histogram Rising and above previous bar Falling and below previous bar
Label Appears Green "CC 23.6" or "CC 61.8" Red "CC 23.6" or "CC 61.8"
Optional Filters Trend direction, ATR range, volume, price pattern Same

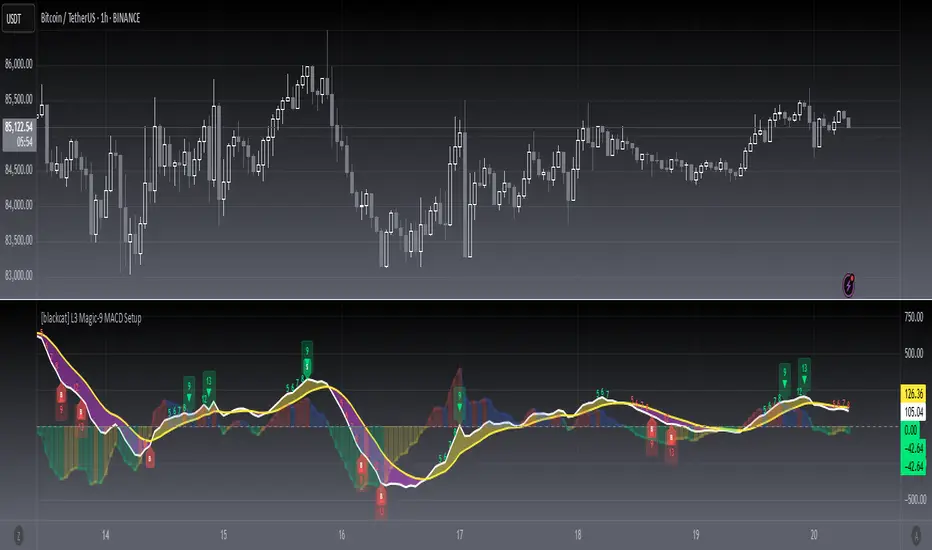
[blackcat] L3 Magic-9 MACD SetupOVERVIEW
The L3 Magic-9 MACD Setup indicator is meticulously crafted to assist traders in identifying precise buy and sell signals through an enhanced Moving Average Convergence Divergence (MACD) methodology. This advanced tool integrates the Magic-9 Sequential technique to refine signal accuracy by filtering out market noise. By providing clear visual cues via labeled charts and real-time alerts, it empowers users to make informed trading decisions swiftly and confidently 📈✅.
FEATURES
Customizable MACD Parameters:
Fast Length: Adjustable parameter to control the sensitivity of the fast moving average.
Slow Length: Configurable setting for the slow moving average to balance responsiveness and stability.
Signal Length: Modifiable value to determine the smoothing factor applied to the MACD line.
Dynamic Plot Visuals:
MACD Line: Representing the difference between short-term and long-term EMAs.
Signal Line: A smoothed version of the MACD line used to generate crossover signals.
Histogram: Illustrating the distance between the MACD and Signal lines, highlighting momentum changes.
All elements feature adjustable colors and styles for personalized visualization preferences 🎨.
Advanced Filtering Mechanism:
Utilizes the Magic-9 Sequential method to analyze consecutive price movements, enhancing signal reliability.
Counts sequential occurrences above or below initial values to detect trends more accurately 🔍.
Sequential Labels:
Displays numerical labels (e.g., '5', '6', etc.) at key points where sequential conditions are met, offering insights into trend strength.
Highlights significant reversals with special labels like '9' and '13' for critical decision-making moments 🏷️.
Buy/Sell Signals:
Generates clear 'B' (buy) and 'S' (sell) labels based on predefined conditions derived from sequential analysis.
Provides actionable trade suggestions directly on the chart for easy interpretation.
Alert System:
Supports customizable alerts to notify users instantly when buy/sell conditions are triggered.
Ensures timely responses to market movements without constant monitoring 🔔.
HOW TO USE
Add Indicator to Chart:
Access the TradingView platform and navigate to the indicators section.
Select ' L3 Magic-9 MACD Setup' from the list and add it to your desired chart.
Configure Settings:
Open the settings panel to adjust MACD parameters such as Fast Length, Slow Length, and Signal Length according to your trading strategy.
Modify plot colors and styles to suit your visual preferences for better readability.
Analyze Chart Labels:
Monitor the chart for sequentially numbered labels indicating trend strength and potential reversal points.
Pay close attention to special labels like '9' and '13' for crucial trading signals.
Combine with Other Tools:
Use additional technical indicators or fundamental analysis to confirm signals generated by the L3 Magic-9 MACD Setup.
Enhance decision-making accuracy by cross-verifying multiple data sources.
LIMITATIONS
Market Conditions Sensitivity:
The indicator may produce fewer reliable signals during periods of low volatility or range-bound markets.
Traders should be cautious of false positives in highly choppy environments 🌪️.
Dependency on Historical Data:
Accurate performance requires sufficient historical price data; insufficient data may lead to inaccurate calculations.
Regular updates and backtesting are essential to maintain effectiveness over time.
Single Indicator Risk:
Relying solely on MACD-based signals can miss broader market context; combining with other analytical tools is recommended.
Always validate signals through multiple lenses to mitigate risks associated with single-indicator strategies.
NOTES
Data Sufficiency:
Ensure your chart has enough historical data loaded to support robust MACD computations.
Periodically review and update data inputs to reflect current market dynamics.
Testing and Validation:
Conduct thorough testing on demo accounts before deploying the indicator in live trading scenarios.
Backtest across various market cycles to assess its resilience under different conditions.
Parameter Optimization:
Experiment with different parameter settings tailored to specific asset classes or trading styles.
Fine-tune the lookback period and other configurable options to align with personal trading objectives.