MA+ADX+DMICOINBASE:BTCUSD
BINANCE:BTCUSDT
Use long and short moving average to look for a potential price in/out. (default as 14 and 7, bases on the history experience)
ADX and DMI to prevent the small volatility and tangling MA.
Test it in 4HR, "BINANCE:BTCUSDT"
From 12/1/2017- 11/1/2020 (Mixed Bull/Bear market)
Overall Profit: 560.89%
From 1/1/2018 - 1/1/2019 (Bear market)
Overall Profit: -2.19%
From 4/1/2020 - 11/1/2020 (Bull Market)
Overall Profit: 274.74%
Any suggestion is welcome to discuss.
在腳本中搜尋"美国11月非农数据"

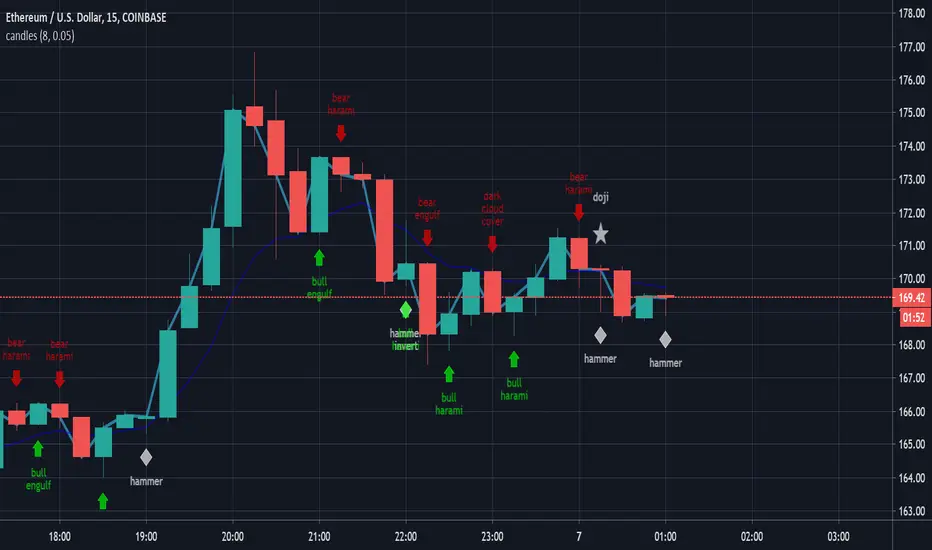
Bullish and Bearish by NicolErazoFThis indicator changes the color of the candlesticks when there’s a change in the trend to the rising or falling trend.
BEARISH ENGULFING: Yellow candlestick. It is an engulfing falling trend reversal; you must make a sell decision.
BEARISH HARAMI: White candlestick. Indicates a possible falling trend change, you must be alert for a possible sale.
BULLISH ENGULFING: Black candlestick. It is a change in the engulfing rising trend, you must make a purchase decision.
BULLISH HARAMI: Blue candlestick. Indicates a possible rising trend change, you should be alert for a possible purchase.
On the chart, you can see the 4 candles, on September 11 the black candle appears indicating a change in the uptrend. But today, the white candle is seen, which appears on September 8, indicating a rebound with a possible change in trend to bearish.
Previous days, on August 26, you see the blue candle with a possible change in the upward trend, which then, on August 28, a yellow candle appears with a change in the downward trend.
The Engulfing indicator (yellow and black) says that the candle has an engulfing change that is radical.
On the other hand, the Harami (blue and white) indicates a possible change in trend that must be previously analyzed.
Harami candles are smaller than Engulfing candles, since Harami in a Japanese term that means pregnancy, where the previous candle is the woman and the next candle is the baby.
___________________________________________________________________________
ESPAÑOL
Este indicador cambia las velas de color cuando ocurre un cambio de tendencia ALCISTA o BAJISTA
BEARISH ENGULFING: Vela de color amarillo. Es una cambio de tendencia bajista envolvente, debes tomar una decisión de venta.
BEARISH HARAMI: Vela de color blanco. Indica un posible cambio de tendencia bajista, debes estar alerta para una posible venta.
BULLISH ENGULFING: Vela de color negro. Es un cambio de tendencia alcista envolvente, debes tomar una decisión de compra.
BULLISH HARAMI: Vela de color azul. Indica un posible cambio de tendencia alcista, debes estar alerta para una posible compra.
En el gráfico, se pueden ver las 4 velas, el 11 de Septiembre aparece la vela negra que indica un cambio de tendencia alcista. Pero hoy, se ve la vela blanca, que aparece el 8 de septiembre, indicando un rebote con un posible cambio de tendencia a bajista.
Días anteriores, el 26 de Agosto, se ve la vela azul con un posible cambio de tendencia alcista, que luego, el 28 de agosto aparece una vela amarilla con cambio de tendencia bajista.
El indicador Engulfing (amarillo y negro) dice que la vela tiene un cambio envolvente que es radical.
En cambio, el Harami (azul y blanco) indica un posible cambio de tendencia que debe ser previamente analizado.
Las velas Harami son más pequeñas que las Engulfing , ya que Harami en un término japonés que significa embarazo, en donde la vela anterior es la mujer y la vela siguiente es el bebé.

KingEMA21-55ZoneI used the moving average with the habit of 21-55, so added two moving average
When the price runs above 55, it only looks for the buy signal.
When the price runs below 55, it only looks for sell signals.
The first step up through the 55 moving average after the first confirmation can buy homeoply,
The first pull down after crossing the 55 moving average for the first time confirms that it can be sold in line with the trend.
Price horizontal finishing, moving average frequently across the field observation.
The yellow area in the interval from 81to 55 is the homeopathic warehouse addition signal.
When the price is above the 55 moving average, the k-line closes below the 21-day moving average as a callback signal
Prices below the 55 ema close above the 21 - day ema as a rebound signal
After the correction and rebound signals come out, we should make half of the profit and the other half of the stop loss in the break-even place.
Moving average is very suitable for the trend of strong varieties, is not suitable for volatile market.
Only at the end of the shock market moving average upward or downward divergent when it is possible to be used.
1. Repeatedly entangle the mean line of horizontal disk stage and observe it from the field
2. Sell the three EMA moving averages when they can't exceed 89EMA with downward crossing
3, many times can not break the new low when prices go sideways profit
4. Buy when the price reaches 89EMA after the convergence of triangle 3 is broken
5, the Angle of price rise slowed and closed below the 21 moving average when profit
6. Left field observation during transverse oscillation.
Sit tight while news or data cause prices to fall quickly
8. Buy when the price triangle breaks through the 55 moving average upward
9, the price does not rise to slow down when the horizontal closed below the 21 moving average when profit
10, price horizontal shock finishing at the same time the average line also transverse finishing field observation
11, the price of the triangle after finishing through the 89 moving average to buy.At this point all the averages have turned up
12, the second time can not break through the new high when the negative line can profit
13, the price of the first time in the same period of time through 89 after the first step back can be re-bought.
中文翻译
价格在55上面运行时时只找买入信号、
价格在55下面运行时只寻找卖出信号、
第一次向上穿过55均线后的第一次回踩确认可以顺势买入、
第一次向下穿过55均线后的第一次回抽确认可以顺势卖出、
价格横盘整理,均线频繁穿越时离场观察。
21-55区间里面黄色区域为顺势加仓信号,
价格在55均线上面时K线收盘在21天均线下面时为回调信号
价格在55均线下面时K线收盘在21天均线上面时为反弹信号
在回调和反弹信号出来之后我们应该获利一半的头寸,另外一半止损放到盈亏平衡的地方。
均线非常适合趋势性很强的品种,并不适合震荡行情。
只有在震荡行情结束时均线向上或向下发散时才有被运用的可能。
1、横盘阶段均线反复纠缠,离场观察
2、三条EMA均线向下交叉回抽无法超越55EMA时卖出
3、多次不能破新低时价格走横时获利
4、价格在3处三角形收敛被突破后站上了55EMA时买入
5、价格上涨角度变缓并收盘在21均线下面时获利
6、横盘震荡时离场观察。
7、见死不救新闻或数据导致价格快速下跌时观望
8、价格三角形向上突破时穿过55均线时买入
9、价格不升减速走横时收盘于21均线下面时获利
10、价格横盘震荡整理同时均线也横向整理时离场观察
11、价格突破三角形整理后重新穿过89均线时买入。此时所有均线已经向上翘头
12、第二次不能突破新高时收阴线可以获利
13、价格在同一个时间周期内第一次穿过89以后的第一次回踩可以重新买入
14、21-55作为牛熊的分水岭。在21-55区域之下只考虑做空,21-55之上只考虑做多。如果21-55走横则以位置决定高位倾向空低位倾向多。
15、K线会因为指标的设置自动变成两个颜色块,绿色看涨,红色看跌。做趋势看K线颜色。牛市的红色可以当成入场K熊市绿色当成入场K

KingEMA21-55-89-144I used the moving average with the habit of 21-55, so added two moving average, one is the short line 8EMA, the other is the medium and long line 89ema
Explain the application of moving averages through the disk surface:
When the price runs above 89, it only looks for the buy signal.
When the price runs below 89, it only looks for sell signals.
The first step up through the 89 moving average after the first confirmation can buy homeoply,
The first pull down after crossing the 89 moving average for the first time confirms that it can be sold in line with the trend.
Price horizontal finishing, moving average frequently across the field observation.
The yellow area in the interval from 8 to 21 is the homeopathic warehouse addition signal.
When the price is above the 89 moving average, the k-line closes below the 21-day moving average as a callback signal
Prices below the 89 ema close above the 21 - day ema as a rebound signal
After the correction and rebound signals come out, we should make half of the profit and the other half of the stop loss in the break-even place.
Moving average is very suitable for the trend of strong varieties, is not suitable for volatile market.
Only at the end of the shock market moving average upward or downward divergent when it is possible to be used.
1. Repeatedly entangle the mean line of horizontal disk stage and observe it from the field
2. Sell the three EMA moving averages when they can't exceed 89EMA with downward crossing
3, many times can not break the new low when prices go sideways profit
4. Buy when the price reaches 89EMA after the convergence of triangle 3 is broken
5, the Angle of price rise slowed and closed below the 21 moving average when profit
6. Left field observation during transverse oscillation.
Sit tight while news or data cause prices to fall quickly
8. Buy when the price triangle breaks through the 89 moving average upward
9, the price does not rise to slow down when the horizontal closed below the 21 moving average when profit
10, price horizontal shock finishing at the same time the average line also transverse finishing field observation
11, the price of the triangle after finishing through the 89 moving average to buy.At this point all the averages have turned up
12, the second time can not break through the new high when the negative line can profit
13, the price of the first time in the same period of time through 89 after the first step back can be re-bought.
中文翻译
价格在89上面运行时时只找买入信号、
价格在89下面运行时只寻找卖出信号、
第一次向上穿过89均线后的第一次回踩确认可以顺势买入、
第一次向下穿过89均线后的第一次回抽确认可以顺势卖出、
价格横盘整理,均线频繁穿越时离场观察。
8-21区间里面黄色区域为顺势加仓信号,
价格在89均线上面时K线收盘在21天均线下面时为回调信号
价格在89均线下面时K线收盘在21天均线上面时为反弹信号
在回调和反弹信号出来之后我们应该获利一半的头寸,另外一半止损放到盈亏平衡的地方。
均线非常适合趋势性很强的品种,并不适合震荡行情。
只有在震荡行情结束时均线向上或向下发散时才有被运用的可能。
1、横盘阶段均线反复纠缠,离场观察
2、三条EMA均线向下交叉回抽无法超越89EMA时卖出
3、多次不能破新低时价格走横时获利
4、价格在3处三角形收敛被突破后站上了89EMA时买入
5、价格上涨角度变缓并收盘在21均线下面时获利
6、横盘震荡时离场观察。
7、见死不救新闻或数据导致价格快速下跌时观望
8、价格三角形向上突破时穿过89均线时买入
9、价格不升减速走横时收盘于21均线下面时获利
10、价格横盘震荡整理同时均线也横向整理时离场观察
11、价格突破三角形整理后重新穿过89均线时买入。此时所有均线已经向上翘头
12、第二次不能突破新高时收阴线可以获利
13、价格在同一个时间周期内第一次穿过89以后的第一次回踩可以重新买入
14、21-55作为牛熊的分水岭。在21-55区域之下只考虑做空,21-55之上只考虑做多。如果21-55走横则以位置决定高位倾向空低位倾向多。
15、K线会因为指标的设置自动变成两个颜色块,绿色看涨,红色看跌。做趋势看K线颜色。牛市的红色可以当成入场K熊市绿色当成入场K

KingEMA8-21-55-89I used the moving average with the habit of 21-55, so added two moving average, one is the short line 8EMA, the other is the medium and long line 89ema
Explain the application of moving averages through the disk surface:
When the price runs above 89, it only looks for the buy signal.
When the price runs below 89, it only looks for sell signals.
The first step up through the 89 moving average after the first confirmation can buy homeoply,
The first pull down after crossing the 89 moving average for the first time confirms that it can be sold in line with the trend.
Price horizontal finishing, moving average frequently across the field observation.
The yellow area in the interval from 8 to 21 is the homeopathic warehouse addition signal.
When the price is above the 89 moving average, the k-line closes below the 21-day moving average as a callback signal
Prices below the 89 ema close above the 21 - day ema as a rebound signal
After the correction and rebound signals come out, we should make half of the profit and the other half of the stop loss in the break-even place.
Moving average is very suitable for the trend of strong varieties, is not suitable for volatile market.
Only at the end of the shock market moving average upward or downward divergent when it is possible to be used.
1. Repeatedly entangle the mean line of horizontal disk stage and observe it from the field
2. Sell the three EMA moving averages when they can't exceed 89EMA with downward crossing
3, many times can not break the new low when prices go sideways profit
4. Buy when the price reaches 89EMA after the convergence of triangle 3 is broken
5, the Angle of price rise slowed and closed below the 21 moving average when profit
6. Left field observation during transverse oscillation.
Sit tight while news or data cause prices to fall quickly
8. Buy when the price triangle breaks through the 89 moving average upward
9, the price does not rise to slow down when the horizontal closed below the 21 moving average when profit
10, price horizontal shock finishing at the same time the average line also transverse finishing field observation
11, the price of the triangle after finishing through the 89 moving average to buy.At this point all the averages have turned up
12, the second time can not break through the new high when the negative line can profit
13, the price of the first time in the same period of time through 89 after the first step back can be re-bought.
中文翻译
价格在89上面运行时时只找买入信号、
价格在89下面运行时只寻找卖出信号、
第一次向上穿过89均线后的第一次回踩确认可以顺势买入、
第一次向下穿过89均线后的第一次回抽确认可以顺势卖出、
价格横盘整理,均线频繁穿越时离场观察。
8-21区间里面黄色区域为顺势加仓信号,
价格在89均线上面时K线收盘在21天均线下面时为回调信号
价格在89均线下面时K线收盘在21天均线上面时为反弹信号
在回调和反弹信号出来之后我们应该获利一半的头寸,另外一半止损放到盈亏平衡的地方。
均线非常适合趋势性很强的品种,并不适合震荡行情。
只有在震荡行情结束时均线向上或向下发散时才有被运用的可能。
1、横盘阶段均线反复纠缠,离场观察
2、三条EMA均线向下交叉回抽无法超越89EMA时卖出
3、多次不能破新低时价格走横时获利
4、价格在3处三角形收敛被突破后站上了89EMA时买入
5、价格上涨角度变缓并收盘在21均线下面时获利
6、横盘震荡时离场观察。
7、见死不救新闻或数据导致价格快速下跌时观望
8、价格三角形向上突破时穿过89均线时买入
9、价格不升减速走横时收盘于21均线下面时获利
10、价格横盘震荡整理同时均线也横向整理时离场观察
11、价格突破三角形整理后重新穿过89均线时买入。此时所有均线已经向上翘头
12、第二次不能突破新高时收阴线可以获利
13、价格在同一个时间周期内第一次穿过89以后的第一次回踩可以重新买入
14、21-55作为牛熊的分水岭。在21-55区域之下只考虑做空,21-55之上只考虑做多。如果21-55走横则以位置决定高位倾向空低位倾向多。
15、K线会因为指标的设置自动变成两个颜色块,绿色看涨,红色看跌。做趋势看K线颜色。牛市的红色可以当成入场K熊市绿色当成入场K

Bernoulli Process - Binary Entropy FunctionThis indicator is the Bernoulli Process or Wikipedia - Binary Entropy Function . Within Information Theory, Entropy is the measure of available information, here we use a binary variable 0 or 1 (P) and (1-P) (Bernoulli Function/Distribution), and combined with the Shannon Entropy measurement. As you can see below, it produces some wonderful charts and signals, using price, volume, or both summed together. The chart below shows you a couple of options and some critical details on the indicator. The best part about this is the simplicity, all of this information in a couple of lines of code.
Using the indicator:
The longer the Entropy measurement the more information you are capturing, so the analogy is, the shorter the signal, the less information you have available to utilize. You'll run into your Nyquist frequencies below a length of 5. I've found values between 9 and 22 work well to gather enough measurements. You also have an averaging summation that measures the weight or importance of the information over the summation period. This is also used for highlighting when you have an information signal above the 5% level (2 sigma) and then can be adjusted using the Percent Rank Variable. Finally, you can plot the individual signals (Price or Volume) to get another set of measurements to utilize. As can be seen in the chart below, the volume moves before price (but hopefully you already knew that)
At its core, this is taking the Binary Entropy measurement (using a Bernoulli distribution) for price and volume. I've subtracted the volume from the price so that you can use it like a MACD, also for shorter time frames (7, 9, 11) you can get divergences on the histogram. These divergences are primarily due to the weekly nature of the markets (5 days, 10 days is two weeks,...so 9 is measuring the last day of the past two weeks...so 11 is measuring the current day and the past two weeks).
Here are a couple of other examples, assuming you just love BTC, Stocks, or FOREX. I fashioned up a strategy to show the potential of the indicator.
BTC-Strategy
Stock-Strategy (#loveyouNFLX)
FOREX - (for everyone hopped up on 40X leverage)

Divergence Histogram for Many IndicatorHello Traders,
This script analyses divergences for 11 predefined indicators and then draws column on the graph. Red columns for negatif divergence (means prices may go down or trend reversal), Lime columns for positive divergences (means prices may go up or trend reversal)
The script uses Pivot Points and on each bar it checks divergence between last Pivot Point and current High/Low and if it finds any divergence then immediately draws column. There is no Latency/Lag.
There are predefined 11 indicators in the script, which are RSI , MACD , MACD Histogram, Stochastic , CCI , Momentum, OBV, Diosc, VWMACD, CMF and MFI.
Smaller Pivot Point Period check smaller areas and if you use smaller numbers it would be more sensitive and may give alerts very often. So you should set it accordingly.
There is "Check Cut-Through in indicators" option, I recomment you to enable it. it checks that there is cut-through in indicators or not, if no cut-through then it's shown as valid divergence.
You should see following one as well if you haven't yet:
Enjoy!

candlestick patternsCleaning up and updating vcsWo8mh-Candlestick-Patterns-Identified-updated-3-11-15 .
As I learn more candlestick patterns I'll add them in.
Please post requests and any potential implementations I could port to pine script.
I'm applying autopep8 as best I can for readability.
MAC-Z & MACD Leader signal [ChuckBanger]This is a combination of my MACD Leader script and MAC-Z with option to add Laguerre filter. The advantage of the MAC-Z over MACD is that it is a more accurate and “assumption-free” indicator that can more accurately describe how a market actually perform. But you can use this as a regular MACD indicator.
Crossovers signals
The MAC-Z line and signal line can be utilized in the same way as a stochastic oscillator, with the crossover between the two lines providing buy and sell signals. As with most crossover strategies, a buy signal comes when the shorter-term, more reactive line – in this case the MAC-Z line (blue line) crosses above the slower signal line (orange line). For example, when the MAC-Z line crosses below the signal line it provides a bearish sell signal.
Zero line crossing
The zero cross strategy is based on either of the lines crossing the zero line. If the MAC-Z crosses the zero line from below, it is a signal for a possible new uptrend, while the MAC-Z crossing from above is a signal that a new downtrend may be starting. This is special powerful if the lines has a fast up or down movement but the price action doesn't reflect that movement.
Divergences
Bearish and bullish divergences is my favorite signals. When price action and oscillators follow the same path it is called Convergences, when they don’t, it’s called a Divergence. Don't confuse the two because they have not the same meaning. But be aware that for example during consolidation or low liquidity, some small divergences between price and indicators might form, but that doesn't mean we should consider them as real divergences.
There is many different types of divergences. It is easier to show a picture then explaining it so I recommend you to check out the link below. Especially the top image. It sums this up very well
medium.com
MACD Leader
The MACD leader is only showing the crossing of MACD as a vertical line
Green vertical line = MACD Leader Bullish Cross
Red vertical line = MACD Leader Bearish Cross
MACD Leader:
MAC-Z:
More Information
cssanalytics.wordpress.com
en.wikipedia.org
drive.google.com

Edward EMA 8-21-89-144Explain the application of moving averages through the disk surface:
When the price runs above 89, it only looks for the buy signal.
When the price runs below 89, it only looks for sell signals.
The first step up through the 89 moving average after the first confirmation can buy homeoply,
The first pull down after crossing the 89 moving average for the first time confirms that it can be sold in line with the trend.
Price horizontal finishing, moving average frequently across the field observation.
The yellow area in the interval from 8 to 21 is the homeopathic warehouse addition signal.
When the price is above the 89 moving average, the k-line closes below the 21-day moving average as a callback signal
Prices below the 89 ema close above the 21 - day ema as a rebound signal
After the correction and rebound signals come out, we should make half of the profit and the other half of the stop loss in the break-even place.
Moving average is very suitable for the trend of strong varieties, is not suitable for volatile market.
Only at the end of the shock market moving average upward or downward divergent when it is possible to be used.
1. Repeatedly entangle the mean line of horizontal disk stage and observe it from the field
2. Sell the three EMA moving averages when they can't exceed 89EMA with downward crossing
3, many times can not break the new low when prices go sideways profit
4. Buy when the price reaches 89EMA after the convergence of triangle 3 is broken
5, the Angle of price rise slowed and closed below the 21 moving average when profit
6. Left field observation during transverse oscillation.
Sit tight while news or data cause prices to fall quickly
8. Buy when the price triangle breaks through the 89 moving average upward
9, the price does not rise to slow down when the horizontal closed below the 21 moving average when profit
10, price horizontal shock finishing at the same time the average line also transverse finishing field observation
11, the price of the triangle after finishing through the 89 moving average to buy.At this point all the averages have turned up
12, the second time can not break through the new high when the negative line can profit
13, the price of the first time in the same period of time through 89 after the first step back can be re-bought.
通过盘面讲解均线运用:
价格在89上面运行时时只找买入信号、
价格在89下面运行时只寻找卖出信号、
第一次向上穿过89均线后的第一次回踩确认可以顺势买入、
第一次向下穿过89均线后的第一次回抽确认可以顺势卖出、
价格横盘整理,均线频繁穿越时离场观察。
8-21区间里面黄色区域为顺势加仓信号,
价格在89均线上面时K线收盘在21天均线下面时为回调信号
价格在89均线下面时K线收盘在21天均线上面时为反弹信号
在回调和反弹信号出来之后我们应该获利一半的头寸,另外一半止损放到盈亏平衡的地方。
均线非常适合趋势性很强的品种,并不适合震荡行情。
只有在震荡行情结束时均线向上或向下发散时才有被运用的可能。
1、横盘阶段均线反复纠缠,离场观察
2、三条EMA均线向下交叉回抽无法超越89EMA时卖出
3、多次不能破新低时价格走横时获利
4、价格在3处三角形收敛被突破后站上了89EMA时买入
5、价格上涨角度变缓并收盘在21均线下面时获利
6、横盘震荡时离场观察。
7、见死不救新闻或数据导致价格快速下跌时观望
8、价格三角形向上突破时穿过89均线时买入
9、价格不升减速走横时收盘于21均线下面时获利
10、价格横盘震荡整理同时均线也横向整理时离场观察
11、价格突破三角形整理后重新穿过89均线时买入。此时所有均线已经向上翘头
12、第二次不能突破新高时收阴线可以获利
13、价格在同一个时间周期内第一次穿过89以后的第一次回踩可以重新买入
14、89-144作为牛熊的分水岭。在89-144区域之下只考虑做空,89-144只考虑做多。如果89-144走横则以位置决定高位倾向空低位倾向多。
15、K线会因为指标的设置自动变成两个颜色块,绿色看涨,红色看跌。做趋势看K线颜色。牛市的红色可以当成入场K熊市绿色当成入场K
Moving Averages & Bollinger Bands with ForecastsMoving Averages & Bollinger Bands with Forecasts
11 Moving Averages
SMA, EMA, WMA
Highly Customizable
Linear Regression Forecast
Bollonger Bands
Personal Setup: Add indicator twice
1st indicator = SMA using #4, 7, 10, 11 (20, 50, 100, 200 SMAs) with bollonger bands on 20.
2nd indicator = EMA using #1, 2, 3, 5, 6, 8, 9 (5, 8, 13, 21 ,34, 55, 89 EMAs).
This allows easy toggling between SMAs/Bolls and Fib EMAs
Thank you to yatrader2 for the forecast code

[astropark] MACD, RSI+, AO, DMI, ADX, OBV, ADI//******************************************************************************
// Copyright by astropark v4.1.0
// MACD, RSI+, Awesome Oscillator, DMI, ADX, OBV, ADI
// 24/10/2018 Added RSI with Center line to have clear glue of current trend
// 10/12/2018 Added MACD
// 13/12/2018 Added multiplier for MACD in order to make it clearly visible over RSI graph
// 11/01/2019 Added Awesome Ascillator (AO)
// 11/01/2019 Added Directional Movement Index (DMI) with ADX
// 14/01/2019 Added On Balance Volume (OBV)
// 14/01/2019 Added Accelerator Decelerator Indicator (ADI)
//******************************************************************************

[astropark] MACD, RSI+, Awesome Oscillator, DMI, ADX, OBV//******************************************************************************
// Copyright by astropark v4.0.0
// MACD, RSI+, Awesome Oscillator, DMI, ADX, OBV
// 24/10/2018 Added RSI with Center line to have clear glue of current trend
// 10/12/2018 Added MACD
// 13/12/2018 Added multiplier for MACD in order to make it clearly visible over RSI graph
// 11/01/2019 Added Awesome Oscillator (AO)
// 11/01/2019 Added Directional Movement Index (DMI) with ADX
// 14/01/2019 Added On Balance Volume (OBV)
//******************************************************************************

[astropark] MACD, RSI+, Awesome Oscillator, DMI with ADX//******************************************************************************
// Copyright by astropark v3.1.0
// MACD, RSI+, Awesome Oscillator, DMI, ADX
// 24/10/2018 Added RSI with Center line to have clear glue of current trend
// 10/12/2018 Added MACD
// 13/12/2018 Added multiplier for MACD in order to make it clearly visible over RSI graph
// 11/01/2019 Added Awesome Ascillator (AO)
// 11/01/2019 Added Directional Movement Index (DMI) with ADX
//******************************************************************************

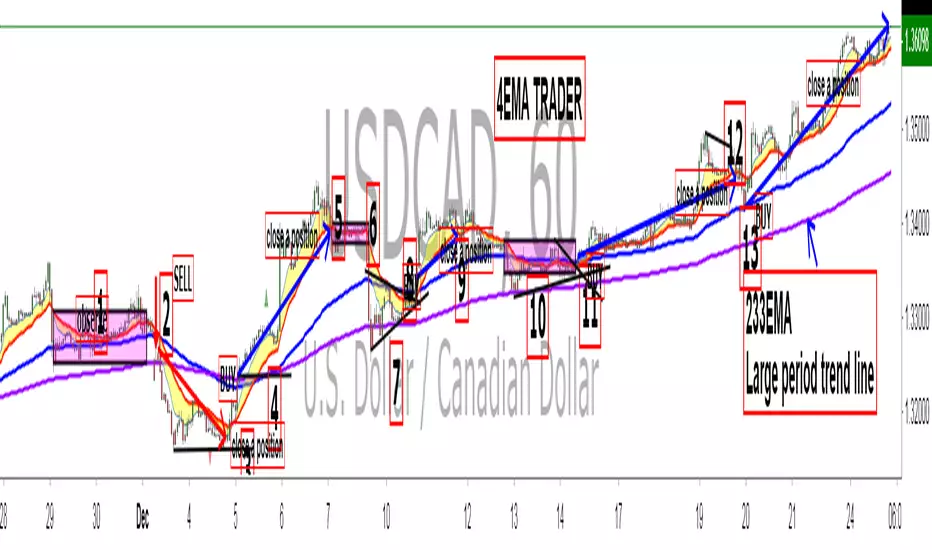
King 4EMA TraderKing 4EMA trader 8/21/89EMA+(233)V3.3
Explain the application of moving averages through the disk surface:
When the price runs above 89, it only looks for the buy signal.
When the price runs below 89, it only looks for sell signals.
The first step up through the 89 moving average after the first confirmation can buy homeoply,
The first pull down after crossing the 89 moving average for the first time confirms that it can be sold in line with the trend.
Price horizontal finishing, moving average frequently across the field observation.
The yellow area in the interval from 8 to 21 is the homeopathic warehouse addition signal.
When the price is above the 89 moving average, the k-line closes below the 21-day moving average as a callback signal
Prices below the 89 ema close above the 21 - day ema as a rebound signal
After the correction and rebound signals come out, we should make half of the profit and the other half of the stop loss in the break-even place.
Moving average is very suitable for the trend of strong varieties, is not suitable for volatile market.
Only at the end of the shock market moving average upward or downward divergent when it is possible to be used.
1. Repeatedly entangle the mean line of horizontal disk stage and observe it from the field
2. Sell the three EMA moving averages when they can't exceed 89EMA with downward crossing
3, many times can not break the new low when prices go sideways profit
4. Buy when the price reaches 89EMA after the convergence of triangle 3 is broken
5, the Angle of price rise slowed and closed below the 21 moving average when profit
6. Left field observation during transverse oscillation.
Sit tight while news or data cause prices to fall quickly
8. Buy when the price triangle breaks through the 89 moving average upward
9, the price does not rise to slow down when the horizontal closed below the 21 moving average when profit
10, price horizontal shock finishing at the same time the average line also transverse finishing field observation
11, the price of the triangle after finishing through the 89 moving average to buy.At this point all the averages have turned up
12, the second time can not break through the new high when the negative line can profit
13, the price of the first time in the same period of time through 89 after the first step back can be re-bought.
通过盘面讲解均线运用:
价格在89上面运行时时只找买入信号、
价格在89下面运行时只寻找卖出信号、
第一次向上穿过89均线后的第一次回踩确认可以顺势买入、
第一次向下穿过89均线后的第一次回抽确认可以顺势卖出、
价格横盘整理,均线频繁穿越时离场观察。
8-21区间里面黄色区域为顺势加仓信号,
价格在89均线上面时K线收盘在21天均线下面时为回调信号
价格在89均线下面时K线收盘在21天均线上面时为反弹信号
在回调和反弹信号出来之后我们应该获利一半的头寸,另外一半止损放到盈亏平衡的地方。
均线非常适合趋势性很强的品种,并不适合震荡行情。
只有在震荡行情结束时均线向上或向下发散时才有被运用的可能。
1、横盘阶段均线反复纠缠,离场观察
2、三条EMA均线向下交叉回抽无法超越89EMA时卖出
3、多次不能破新低时价格走横时获利
4、价格在3处三角形收敛被突破后站上了89EMA时买入
5、价格上涨角度变缓并收盘在21均线下面时获利
6、横盘震荡时离场观察。
7、见死不救新闻或数据导致价格快速下跌时观望
8、价格三角形向上突破时穿过89均线时买入
9、价格不升减速走横时收盘于21均线下面时获利
10、价格横盘震荡整理同时均线也横向整理时离场观察
11、价格突破三角形整理后重新穿过89均线时买入。此时所有均线已经向上翘头
12、第二次不能突破新高时收阴线可以获利
13、价格在同一个时间周期内第一次穿过89以后的第一次回踩可以重新买入。
Bitfinex Longs/Shorts Multi-Coin [acatwithcharts]This script plots the longs/shorts ratio derived from Bitfinex for BTCUSDLONGS, BTCUSDSHORTS, and similar for 11 top cryptocurrencies chosen selected based on marketcap, trading volume on Bitfinex, and the maximum number of times that TradingView would let me call the "security" function in one script. Included coins:
BTC, ETH, LTC, BCH, XRP, EOS, IOT (IOTA), ETC, ZEC, NEO, XMR
In addition to just plotting the ratios for the individual coins, this script also calculates for a customizable selection of the 11 coins both the average ratio and a weighted average weighted by (USD price of coin * sum of long and short positions).
I wrote it both to use both for a big picture overview of leveraged positions across major coins and to use as a Swiss army knife of longs/shorts ratio indicators for individual coins, most of which do not currently have individual scripts published.
I'm an amateur and you definitely shouldn't take anything I say or use any of my scripts as financial advice. I'd appreciate any feedback.

Stochastic Momentum IndexStochastic Momentum Index indicator script. This indicator was originally developed by William Blau (Stocks & Commodities V. 11:1 (11-18)).

Market Maker Position Bars (Position Size)**Market Maker Position Bars (Position Size) – Indicator Description for TradingView**
This indicator is a clean, professional visualization tool designed for traders who track suspected **market maker / institutional positioning** (especially popular in ICT/SMC communities) on indices like the SPX, NDX, ES, etc.
It draws up to **20 horizontal position bars** directly on the chart, anchored to the very last bar, representing hypothetical long and short positions at specific price levels with corresponding position sizes.
### Key Features & Visual Logic
- **Green bars (Boxes 1–10)** → Extend to the **right** of the last bar
Represent **long positions** (bullish interest)
Default translucent green fill
- **Red bars (Boxes 11–20)** → Extend to the **left** of the last bar
Represent **short positions** (bearish interest)
Default translucent red fill
- **Bar width = Position size**
The length of each box is automatically scaled based on the absolute value you enter in “Position Size”.
Larger position → wider (longer) bar
- Each box displays **Price / Position Size** text inside (e.g., `5720.50 / 1250`)
### Fully Customizable Settings
**Global Geometry**
- Total Box Height (default 10.0) – controls vertical thickness of all boxes
**Position Size Scaling**
- Base Box Width (bars)
- Width per Position Unit – fine-tune how aggressively width grows with size
- Minimum & Maximum Bar Width – prevents boxes from becoming too tiny or excessively long
**Global Text Settings**
- Text color, size (Tiny → Huge), and bold option
**Individual Box Controls (20 independent boxes)**
- Show/Hide toggle
- SPX Price (or any symbol price level)
- Position Size (any positive/negative number; absolute value determines width)
- Fill color (override default green/red if desired)
### How It Works Internally
- All boxes are drawn only on the **last confirmed bar** (`barstate.islast`)
- Width calculation:
`Width = BaseWidth + (|Position Size| × Width per Unit)`
Clamped between Min and Max Bar Width
- Green boxes start at the current bar and extend forward (right)
- Red boxes end at the current bar and extend backward (left)
- Uses Pine Script v6 `box.new()` with `xloc.bar_index` for perfect alignment and performance
### Ideal Use Cases
- Visualizing daily/weekly **order block** or **fair value gap** interest levels with estimated size
- Mapping **dealer positioning**, gamma exposure levels, or large options interest
- Quickly seeing where the “smart money” is theoretically stacked on both sides of the market
- Clean chart markup for screenshots, mentoring, or live trading journals
A minimalist yet powerful tool favored by ICT, SMC, and footprint-style traders who want to see **where the big players might be positioned** — all in one glance without cluttering the chart with hundreds of objects.
Clean. Visual. Size-aware. Perfect for high-level market profiling.

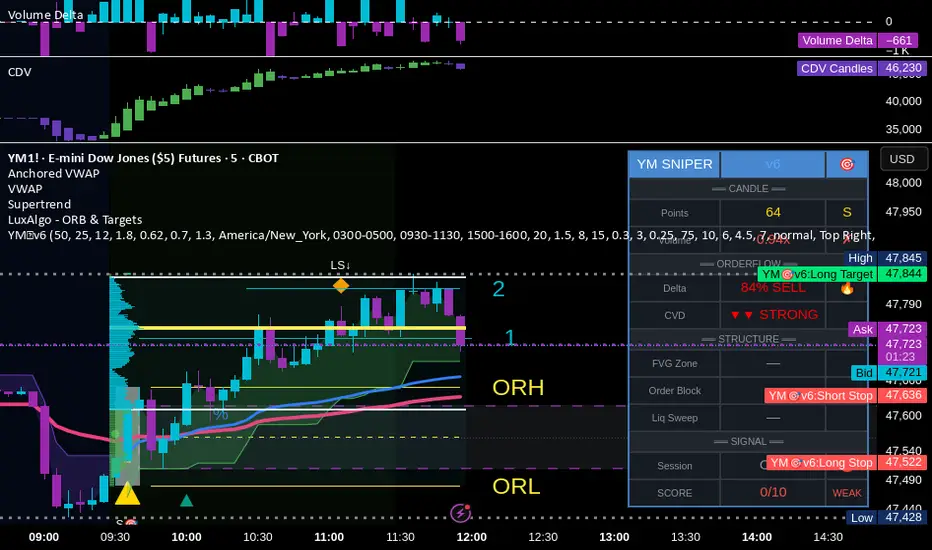
YM Ultimate SNIPER v6# YM Ultimate SNIPER v6 - Documentation & Trading Guide
## 🎯 ORDERFLOW EDITION | Order Blocks + Liquidity Sweeps + IFVG
**TARGET: 3-7 High-Confluence Trades per Day**
**Philosophy: "Zones That Matter"**
---
## ⚡ WHAT'S NEW IN v6
### Major Additions
| Feature | Description | Orderflow Purpose |
|---------|-------------|-------------------|
| **Order Blocks** | Last opposing candle before significant move | Shows where institutions absorbed orders |
| **Liquidity Sweeps** | Sweep of swing H/L with rejection | Identifies stop hunts / trap reversals |
| **IFVG** | Inverse FVG when price reclaims a gap | Failed institutional move = reversal signal |
| **Zone Quality Score** | 0-10 rating for each zone | Only "zones that matter" display |
| **3-Tier Scoring** | Weak/Medium/Excellent classification | Better trade selection |
| **Enhanced Table** | Larger, categorized, color-coded | Instant situation awareness |
### Orderflow Mindset
This version is built around **institutional order flow concepts**:
1. **Institutions leave footprints** → Order Blocks mark where they filled orders
2. **Retail gets trapped** → Liquidity Sweeps show the trap before reversal
3. **Failed moves reverse hard** → IFVG marks failed institutional attempts
4. **Not all zones are equal** → Quality scoring filters noise
---
## 🎯 QUICK REFERENCE
```
┌─────────────────────────────────────────────────────────────────────────┐
│ YM ULTIMATE SNIPER v6 │
├─────────────────────────────────────────────────────────────────────────┤
│ │
│ SIGNALS: │
│ S🎯 = S-Tier (50+ pts) → HOLD position │
│ A🎯 = A-Tier (25-49 pts) → SWING trade │
│ B🎯 = B-Tier (12-24 pts) → SCALP quick │
│ Z = Zone entry (quality FVG/OB zone) │
│ LS↑ = Bullish Liquidity Sweep (lows swept + rejection) │
│ LS↓ = Bearish Liquidity Sweep (highs swept + rejection) │
│ │
│ ZONES: │
│ 🟦 Blue boxes = Bullish Order Block (buy zone) │
│ 🟪 Pink boxes = Bearish Order Block (sell zone) │
│ 🟩 Green boxes = Bullish FVG (buy zone) │
│ 🟥 Red boxes = Bearish FVG (sell zone) │
│ 🟣 Purple dashed = IFVG (inverse - strong reversal zone) │
│ │
│ SCORE CLASSIFICATION: │
│ EXCELLENT (7.0+) = Full size, high confidence │
│ MEDIUM (4.5-6.9) = Standard size, good setup │
│ WEAK (<4.5) = No signal shown │
│ │
│ SESSIONS (ET): │
│ LDN = 3:00-5:00 AM (London) │
│ NY = 9:30-11:30 AM (New York Open) │
│ PWR = 3:00-4:00 PM (Power Hour) │
│ │
└─────────────────────────────────────────────────────────────────────────┘
```
---
## 📦 ORDER BLOCKS (OB)
### What Are Order Blocks?
Order blocks mark the **last opposing candle before a significant move**. This is where institutional traders absorbed retail orders before moving price in their intended direction.
### Detection Logic (Breaker Style)
```
BULLISH OB:
├── Last BEARISH candle before strong bullish move
├── Move after must be ≥ 1.5x ATR
├── Shows where institutions absorbed selling
└── Expect support when price returns
BEARISH OB:
├── Last BULLISH candle before strong bearish move
├── Move after must be ≥ 1.5x ATR
├── Shows where institutions absorbed buying
└── Expect resistance when price returns
```
### OB Quality Scoring
Each Order Block gets a strength score (0-10) based on:
- **Move strength** after the OB (ATR multiple)
- **Volume** on the OB candle
- **Body ratio** of the OB candle
Only OBs with strength ≥ 4 are displayed.
### Trading Order Blocks
| Scenario | Action |
|----------|--------|
| Price returns to Bull OB + buy delta | Look for LONG |
| Price returns to Bear OB + sell delta | Look for SHORT |
| OB + FVG overlap (thick border) | HIGH PROBABILITY |
| OB tested once (gray) | Still valid, often best entry |
| OB broken (closes through) | Invalidated, removed |
---
## 💎 LIQUIDITY SWEEPS
### What Are Liquidity Sweeps?
A liquidity sweep occurs when price **hunts stop losses** by briefly breaking a swing high/low, then **immediately reverses** back. This is the classic "stop hunt" or "liquidity grab."
### Detection Logic
```
BULLISH SWEEP (LS↑):
├── Price sweeps BELOW a recent swing low
├── Closes BACK ABOVE the swing level
├── Shows lower wick (rejection)
├── Buy delta dominance on the candle
└── SIGNAL: Lows swept, shorts trapped → GO LONG
BEARISH SWEEP (LS↓):
├── Price sweeps ABOVE a recent swing high
├── Closes BACK BELOW the swing level
├── Shows upper wick (rejection)
├── Sell delta dominance on the candle
└── SIGNAL: Highs swept, longs trapped → GO SHORT
```
### Why Sweeps Matter for Orderflow
1. **Retail stops get hit** → Liquidity provided to institutions
2. **Institutions fill orders** → At better prices thanks to the sweep
3. **Price reverses** → Move in intended direction begins
4. **You enter with institutions** → Not against them
### Sweep + Zone = High Probability
When a liquidity sweep happens AT or NEAR an Order Block or FVG zone, the probability increases significantly.
---
## 🔄 IFVG (INVERSE FVG)
### What Is an IFVG?
An Inverse FVG forms when price **fills an FVG and then reclaims it** in the opposite direction. This signals a **failed institutional move**.
### Detection Logic
```
BULLISH IFVG:
├── Bearish FVG was created (gap down)
├── Price fills the gap (tests zone)
├── Price CLOSES ABOVE the gap with buy delta
└── SIGNAL: Bears failed → Strong reversal UP
BEARISH IFVG:
├── Bullish FVG was created (gap up)
├── Price fills the gap (tests zone)
├── Price CLOSES BELOW the gap with sell delta
└── SIGNAL: Bulls failed → Strong reversal DOWN
```
### Why IFVG Is Powerful
- Shows institutional failure → Other side takes control
- Pre-assigned quality score of 8.0 (high priority)
- Often marks significant reversals
- Purple dashed boxes for easy identification
---
## 📊 ZONE QUALITY SCORING
### The "Zones That Matter" Filter
Not all FVGs and OBs are created equal. v6 implements a **Zone Quality Score** (0-10) that filters out low-quality zones.
### Quality Calculation
| Factor | Max Points | How Measured |
|--------|------------|--------------|
| Gap Size | 2.5 | Larger gap = more points |
| Impulse Strength | 2.5 | Stronger move = more points |
| Volume | 2.0 | Higher volume = more points |
| OB Alignment | 2.0 | FVG overlaps with OB = bonus |
| Session | 1.0 | Created in active session = bonus |
### Min Quality Threshold (Default: 6.0)
Zones scoring below this threshold **are not displayed**. Adjust in settings:
- **Conservative**: Set to 7.0+ (fewer, better zones)
- **Standard**: 6.0 (balanced)
- **Aggressive**: 4.0-5.0 (more zones, more noise)
### Visual Quality Indicators
- **Thick border**: Zone aligns with Order Block (high quality)
- **Bright color**: Fresh zone
- **Gray color**: Tested zone (still valid)
- **Removed**: Broken zone (invalidated)
---
## 📊 CONFLUENCE SCORING SYSTEM
### Score Components (Max ~12, normalized to 10)
| Factor | Points | Condition |
|--------|--------|-----------|
| **Tier** | 1-3 | B=1, A=2, S=3 |
| **FVG Zone** | +1.5 | Price in quality FVG |
| **Order Block** | +1.5 | Price in OB |
| **IFVG** | +1.0 | Price in Inverse FVG |
| **Strong Volume** | +1.0 | Volume ≥ 2x average |
| **Extreme Volume** | +0.5 | Volume ≥ 2.5x average |
| **Strong Delta** | +1.0 | Delta ≥ 70% |
| **Extreme Delta** | +0.5 | Delta ≥ 78% |
| **CVD Momentum** | +0.5-1.0 | CVD trending with signal |
| **Liquidity Sweep** | +1.5 | Recent sweep confirms direction |
### Score Classification
| Score | Class | Confidence | Position Size |
|-------|-------|------------|---------------|
| **7.0+** | EXCELLENT | Very High | Full size (100%) |
| **4.5-6.9** | MEDIUM | Good | Standard (75%) |
| **< 4.5** | WEAK | Low | No signal shown |
### Score Displayed in Table
The table shows both the numeric score and classification:
- Green background + "EXCELLENT" = Top tier setup
- Orange background + "MEDIUM" = Decent setup
- Gray + "WEAK" = Below threshold
---
## 📊 ENHANCED TABLE REFERENCE
The v6 table is organized into **4 sections**:
### CANDLE Section
| Row | What It Shows |
|-----|---------------|
| Points | Candle range in points + Tier (S/A/B/X) |
| Volume | Volume ratio + grade (🔥/✓✓/✓/✗) |
### ORDERFLOW Section
| Row | What It Shows |
|-----|---------------|
| Delta | Buy/Sell % + grade (🔥/✓✓/✓/—) |
| CVD | Direction + strength (▲▲ STRONG, ▲ UP, etc.) |
### STRUCTURE Section
| Row | What It Shows |
|-----|---------------|
| FVG Zone | Current zone status + quality score |
| Order Block | OB status (BULL OB / BEAR OB / —) |
| Liq Sweep | Recent sweep status + 🎯 indicator |
### SIGNAL Section
| Row | What It Shows |
|-----|---------------|
| Session | Current session (NY/LDN/PWR/OFF) + 🟢/🔴 |
| SCORE | Numeric score /10 + classification |
### Color Coding
- **🟢 Green/Lime**: Good, meets threshold, bullish
- **🟠 Orange/Amber**: Caution, borderline, medium
- **🔴 Red**: Bad, below threshold, bearish
- **⚪ Gray**: Inactive/neutral
- **🔥**: Extreme/exceptional reading
---
## ✅ ENTRY CHECKLIST v6
Before entering any trade:
### Basic Requirements
- Signal present (S🎯/A🎯/B🎯 or Z)
- Score ≥ 4.5 (MEDIUM or better)
- Session active (LDN/NY/PWR shows 🟢)
### Orderflow Confirmation
- Delta colored (not gray)
- CVD arrow matches direction
- Volume shows ✓ or better
### Structure Bonus (Any = Better)
- In FVG Zone
- In Order Block
- Recent Liquidity Sweep
- IFVG present
### Execute
- Enter at signal candle close
- Stop below/above candle (shown on chart)
- Target at calculated R:R level
---
## 🎯 IDEAL SETUPS (HIGH WIN RATE)
### Setup 1: Sweep + Zone + Tier
```
Conditions:
├── Liquidity Sweep just occurred (LS↑ or LS↓)
├── Price is at Order Block or FVG
├── Tier signal fires (S/A/B)
├── Score: 7+ EXCELLENT
└── Win Rate: ~75-85%
```
### Setup 2: IFVG + Delta Confirmation
```
Conditions:
├── IFVG just formed (purple zone)
├── Strong delta (70%+) in IFVG direction
├── CVD confirming
├── Score: 7+ EXCELLENT
└── Win Rate: ~70-80%
```
### Setup 3: OB + FVG Overlap
```
Conditions:
├── Order Block present
├── FVG zone overlaps with OB (thick border)
├── Price returns to overlap zone
├── Delta confirms direction
└── Win Rate: ~70-78%
```
### Setup 4: Clean Zone Entry
```
Conditions:
├── Quality zone (score 6+)
├── No tier signal but Z entry shows
├── Delta matches zone direction
├── In active session
└── Win Rate: ~65-72%
```
---
## ⛔ DO NOT TRADE
- Session shows "OFF" or 🔴
- Score < 4.5 (WEAK)
- Delta shows "—" (no dominance)
- CVD conflicts with signal direction
- Multiple conflicting zones
- Zone quality < 6
- Major news imminent (FOMC, NFP, CPI)
- Price chopping between zones
---
## 🔧 SETTINGS GUIDE
### Recommended Configurations
**Conservative (2-4 trades/day):**
```
Min Score Medium: 5.5
Min Score Excellent: 7.5
Min Zone Quality: 7.0
Min Volume Ratio: 2.0
Delta Threshold: 65%
```
**Standard (4-6 trades/day):**
```
Min Score Medium: 4.5
Min Score Excellent: 7.0
Min Zone Quality: 6.0
Min Volume Ratio: 1.8
Delta Threshold: 62%
```
**Aggressive (6-8 trades/day):**
```
Min Score Medium: 4.0
Min Score Excellent: 6.5
Min Zone Quality: 5.0
Min Volume Ratio: 1.5
Delta Threshold: 60%
```
---
## 🚨 ALERTS PRIORITY
### Must-Have Alerts
| Alert | Priority | Action |
|-------|----------|--------|
| ⭐ EXCELLENT LONG/SHORT | 🔴 CRITICAL | Drop everything, check NOW |
| 🎯 S-TIER | 🟠 HIGH | Evaluate within 10 seconds |
| 💎 LIQUIDITY SWEEP | 🟠 HIGH | Check for zone confluence |
| 🔄 IFVG | 🟡 MEDIUM | Note reversal potential |
### Useful Context Alerts
| Alert | Purpose |
|-------|---------|
| 📦 NEW OB | Mark institutional zone |
| 📦 NEW FVG | Mark gap zone |
| SESSION OPEN | Prepare to trade |
---
## 📈 TRADE JOURNAL v6
```
DATE: ___________
SESSION: ☐ LDN ☐ NY ☐ PWR
SETUP TYPE:
☐ Sweep + Zone ☐ IFVG ☐ OB+FVG ☐ Zone Entry
TRADE:
├── Time: _______
├── Signal: S🎯 / A🎯 / B🎯 / Z / LS
├── Direction: LONG / SHORT
├── Score: ___/10 (EXCELLENT / MEDIUM)
├── Entry: _______
├── Stop: _______
├── Target: _______
│
├── In FVG Zone: ☐ Yes ☐ No
├── In Order Block: ☐ Yes ☐ No
├── Liquidity Sweep: ☐ Yes ☐ No
├── IFVG Present: ☐ Yes ☐ No
│
├── Result: +/- ___ pts ($_____)
└── Notes: _______________________
DAILY SUMMARY:
├── Trades: ___
├── EXCELLENT setups: ___
├── MEDIUM setups: ___
├── Wins: ___ | Losses: ___
├── Net P/L: $_____
└── Best setup type: _______________________
```
---
## 🏆 GOLDEN RULES v6
> **"Institutions sweep, then move. Wait for the sweep."**
> **"Order Blocks show where they filled. Trade there."**
> **"IFVG = They failed. Take the other side."**
> **"Zone Quality 6+ or walk away."**
> **"EXCELLENT score = Green light. MEDIUM = Yellow light. WEAK = Red light."**
> **"Confluence beats conviction. Stack the factors."**
> **"Leave every trade with money. The next setup is coming."**
---
## 🔧 TROUBLESHOOTING
| Issue | Solution |
|-------|----------|
| No signals | Lower Min Score Medium to 4.0 |
| Too many signals | Raise Min Score Medium to 5.5+ |
| Too many zones | Raise Min Zone Quality to 7.0+ |
| Zones cluttering | Reduce Max Zones to 6-8 |
| OBs everywhere | Raise OB Min Strength to 1.8+ |
| Missing sweeps | Lower Sweep Lookback, reduce Min Wick Ratio |
| Table too small | Change Table Size to "large" |
| Wrong timezone | Check Session Timezone setting |
---
## 📝 TECHNICAL NOTES
- **Pine Script v6** (latest syntax)
- **Works on**: YM, MYM, NQ, MNQ, ES, MES, GC, MGC
- **Auto-detects** instrument for proper point calculation
- **Recommended TF**: 1-5 minute for day trading
- **Min TradingView Plan**: Free (no premium features required)
- **Max visual elements**: 500 labels, 500 boxes, 500 lines
---
*© Alexandro Disla - YM Ultimate SNIPER v6*
*Orderflow Edition | Zones That Matter*