在腳本中搜尋"股价站上60月线"

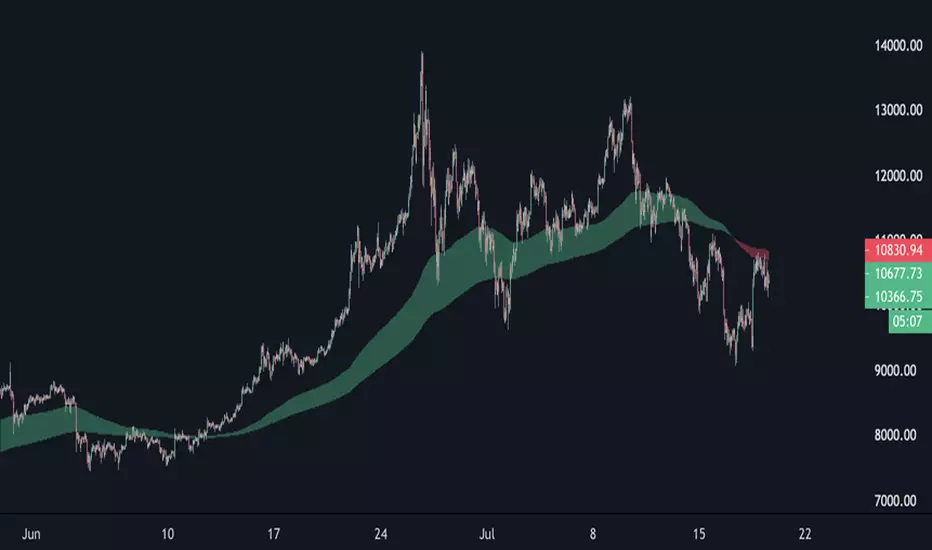
EMA Cloud 9/30/60 – Visual Trend Strength - CryptowitchThis indicator displays three Exponential Moving Averages (EMAs):
🔸 EMA 9 (short-term)
🔸 EMA 30 (mid-term)
🔸 EMA 60 (long-term)
A dynamic cloud is drawn between EMA 9 and EMA 30 to visually highlight trend momentum:
Green cloud = bullish momentum (EMA 9 above EMA 30)
Red cloud = bearish momentum (EMA 9 below EMA 30)
This cloud setup helps quickly identify trend direction, momentum shifts, consolidation zones, and potential entry/exit points.
Clean, visual, and effective – suitable for scalpers, swing traders, and trend followers alike.


Emre AOI Zonen Daily & Weekly (mit Alerts, max 60 Pips)This TradingView indicator automatically highlights Areas of Interest (AOI) for Forex or other markets on Daily and Weekly timeframes. It identifies zones based on the high and low of the previous period, but only includes zones with a width of 60 pips or less.
Features:
Daily AOI Zones in blue, Weekly AOI Zones in yellow with 20% opacity, so candlesticks remain visible.
Persistent zones: AOI boxes stay on the chart until the price breaks the zone.
Multiple zones: Supports storing multiple Daily and Weekly AOIs simultaneously.
Break Alerts: Sends alerts whenever a Daily or Weekly AOI is broken, helping traders spot key levels in real-time.
Fully automated: No manual drawing needed; zones are updated and extended automatically.
Use Case:
Ideal for traders using a top-down approach, combining Weekly trend analysis with Daily entry signals. Helps identify support/resistance, supply/demand zones, and critical price levels efficiently.

EMA band 12/60/150/200EMA band consisting of 12/60/150/200
Specifically for Indian stock market, can be used for other trading scripts after testing.
Best use case : on Daily TF.
Bull run entry criteria, Not bear market or Bottom catching.

15-Minute and 60-Minute ORB with Wicks15 and 60 minute ORBs for each trading day. Simple, yet effective.


EMA (10,20,60) + Bollinger BandsCombination of bollinger bands and exponential moving averages (10, 20, 60)
The coloring is optimized for dark background, and it is editable
This indicator combined 3 exponential moving average lines and bollinger bands . The EMA lines can be add or deleted in pine editor, and its parameters can be changed too. Same to the bollinger bands . Defaulted value for BB is 20SMA with 2 standard deviations.
Useful as a supplmentary indicators

EMA30,60,100 EMA 30 (orange),60(red),100(green)
Bullish: green below the other two
Bearish: green above other two
when lines cross, no clear trend.
When Price touches the orange = entry point
Thanks to CFXtrader for the basic script


[STRATEGY]EMA 30/60 Cross Strategystrategy based on EMA 30/60 cross
works best on 4hr timeframes & high-midcaps


120/60 Trend ModelCombination of 120 & 60 EMAs used to determine entries as well as the over all trend.
Guppy MMA 3, 5, 8, 10, 12, 15 and 30, 35, 40, 45, 50, 60Guppy Multiple Moving Average
Short Term EMA 3, 5, 8, 10, 12, 15
Long Term EMA 30, 35, 40, 45, 50, 60
Use for SFTS Class

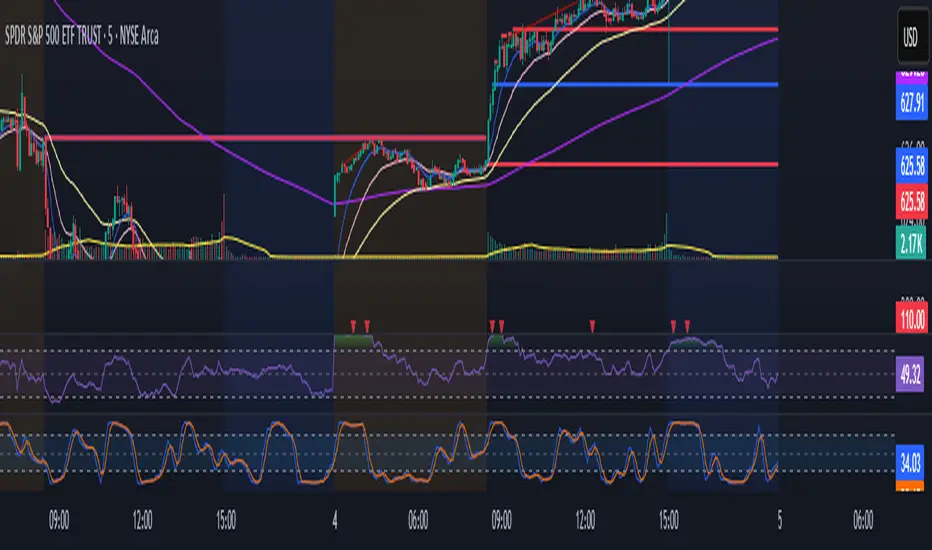
3-EMA Ribbon Scalping System 3-EMA Ribbon Scalping System V2 - Trading Guide
Overview
This indicator combines a triple EMA ribbon with VWAP, RSI, and volume analysis to catch high-probability scalping setups for short pip hunting on highly liquid Forex pairs such as EUR/USD
The Core Strategy
The system waits for three conditions to align before firing a signal:
1. EMA Stack** - The 8/13/21 EMAs must be properly stacked (bullish: 8>13>21, bearish: 8<13<21)
2. VWAP Position** - Price needs to be on the right side of VWAP for the trade direction
3. Pullback Entry** - Price pulls back to test the fast EMA while maintaining the trend structure
When these line up with proper RSI readings and a volume spike, you get your entry signal.
Reading the Signals
LONG Entries
Triggered when:
- EMAs are bullishly stacked (green background)
- Price is above VWAP
- We get a pullback to the 8 EMA that holds
- RSI is between 40-70 (momentum present but not overbought)
- Volume exceeds the 20-period average by 1.2x
SHORT Entries
Mirror opposite conditions:
- Bearish EMA stack (red background)
- Price below VWAP
- Rejection at the 8 EMA
- RSI between 30-60
- Volume confirmation present
Risk Management Built In (freely adjustable to match your own approach when it comes to taking risk)
Each signal automatically calculates:
- Stop Loss: 1x ATR from entry
- Target 1: 1:1 risk/reward ratio
- *arget 2: 2:1 risk/reward ratio
You can display these as lines or labels, or turn them off entirely if you prefer your own levels.
Quick Setup Tips
Start with the default settings - they work well on most timeframes from 1-minute to 1-hour charts. The sweet spot for scalping is typically the 3-minute or 5-minute timeframe.
The info panel in the top right gives you a quick market snapshot without cluttering your chart:
- Trend direction
- VWAP position
- RSI value
- Volume status
- Current signal state
If you're getting too many signals, increase the "Min Bars Between Signals" to filter out choppy action. For cleaner charts during analysis, you can toggle off individual components like the ribbon, backgrounds, or signals.
Tips for Live Trading
1. Don't chase - Wait for price to come to the 8 EMA, not the other way around
2. Volume matters - That volume spike filter catches the moves with real momentum behind them
3. Respect the trend - The EMA stack keeps you trading with the flow, not against it
4. Use multiple timeframes - Check a higher timeframe for overall bias before taking signals
The indicator includes alerts that fire with exact entry, stop, and target levels - perfect for quick execution or logging trades.
Remember, this is a scalping system designed for active trading. It works best in trending markets with good volatility. During ranging or low-volume periods, consider sitting on your hands or reducing position size. Trade at your own risk, I created this solely for educational purposes!
Customization Options
Display Settings
- Show/hide EMA ribbon
- Toggle entry signals
- Background colors with adjustable opacity
- Info panel size options
- VWAP visibility
Technical Parameters
- EMA Settings: Adjustable lengths for fast (8), medium (13), and slow (21) EMAs
- RSI Settings: Customizable overbought/oversold levels and momentum thresholds
- Volume Settings: Multiplier for volume confirmation and MA length
- Risk Management: ATR multiplier for stops, customizable R:R ratios
Nearly everything is adjustable, but the defaults are solid. Focus on reading the market structure first before tweaking settings.
Visual Features
Background Colors
- Green: Bullish trend (EMAs stacked bullishly)
- Red: Bearish trend (EMAs stacked bearishly)
- Gray: Neutral/choppy conditions
Signal Styles
Choose between:
- Text labels
- Arrow markers
- Both combined
Stop Loss & Take Profit Display
Three modes available:
- None: No SL/TP visualization
- Current: Shows lines for active trade
- Labels: Displays small labels at price levels
Best Markets & Timeframes
Optimal Markets:
- Forex pairs (especially majors)
- Stock indices
- Liquid cryptocurrencies
- High-volume stocks
Alert System
Comprehensive alerts include:
- Entry signal notification
- Exact entry price
- Stop loss level with pip distance
- Take profit levels with pip distances
- Trade direction and symbol
Important Notes
- This is a "momentum-based scalping system" - not suitable for ranging markets
- Best results come from pairing with your understanding of key levels and market context
- The volume filter helps avoid false signals during low-liquidity periods
- Consider overall market conditions and news events before trading
Version Info
3-EMA Ribbon Scalping System
- Refined entry logic
- Improved visual clarity
- Enhanced risk management tools
- Optimized performance tracking

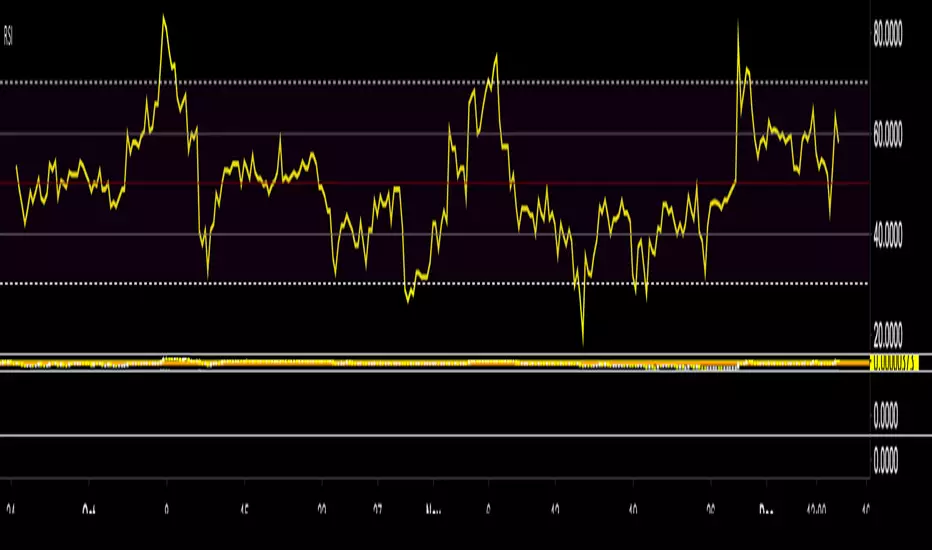
BTC Halving Cycle SignalsBTC Halving Cycle Signals
What signals does this script give in real history (2011-2025):
2015 → BUY (bear market bottom)
2019 → BUY (post-2018 bottom)
October 2020 → BUY
November 2023 → BUY
And right now (Nov 2025) → green bottom + price above weekly EMA200 → about to give a buy signal if it breaks $72k strongly.
BUY signal: ~500 days pre-halving + price > weekly EMA200 + monthly RSI <60 (accumulation).
SELL signal: ~1064 days post-halving + RSI >75 or close < SuperTrend (distribution).
Hardcoded halving dates (can be edited). Works on BTCUSD weekly/monthly, gives 1-2 signals per cycle.


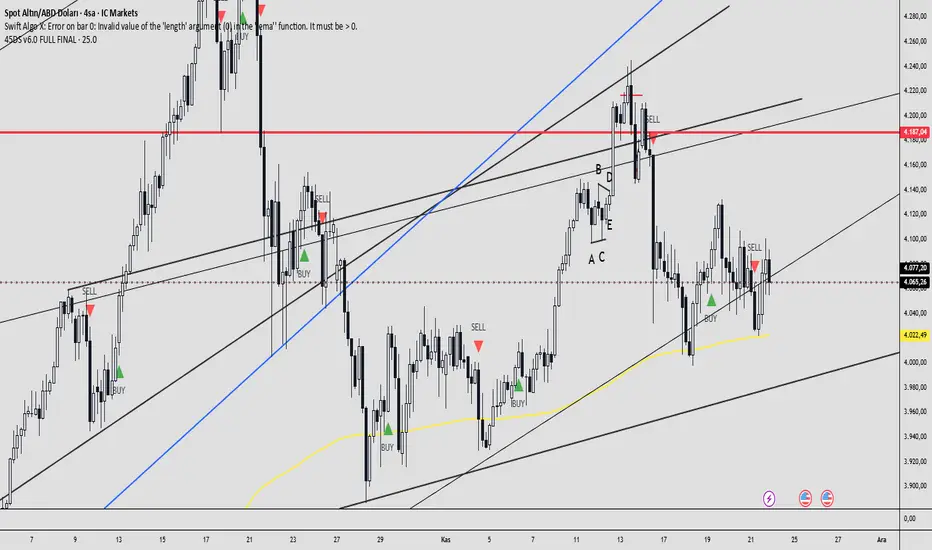
45DS v6.0 FULL FINAL1-5-15-30-60 dakıkalık zaman dlimlerinde sculp indikatörü . Başarısına inanamayacalsınız..