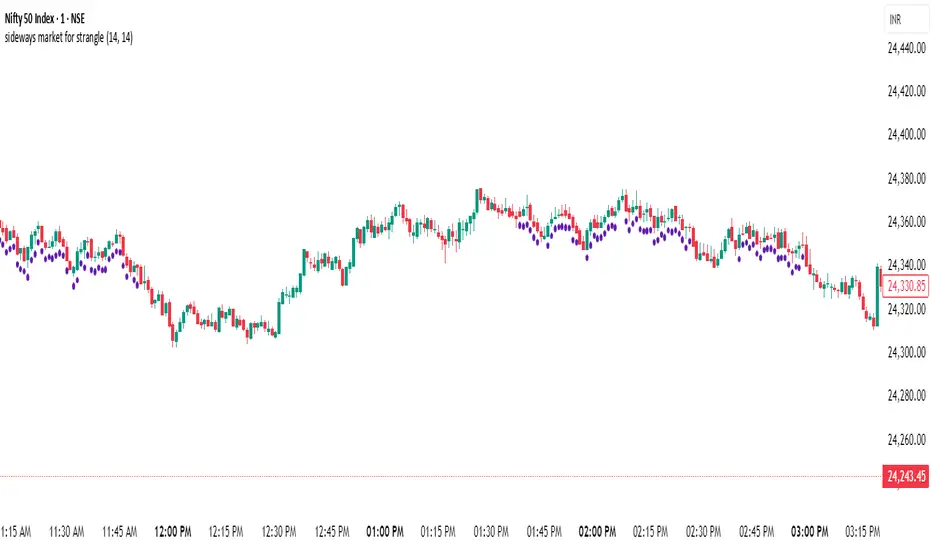
sideways market for strangleThis Pine Script is designed to identify **sideways or range-bound markets**, which are often ideal conditions for trading **options strangle strategies**. Here's a breakdown of what the script does:
---
### 🛠 **Purpose:**
To **detect low-volatility, sideways market conditions** where price is not trending strongly in either direction — suitable for **neutral options strategies like short strangles**.
---
### 📌 **Key Components:**
#### 1. **Inputs:**
- `RSI Length`: Default 14 — used for calculating the Relative Strength Index (RSI).
- `ADX Length`: Default 14 — used for calculating the Average Directional Index (ADX), DI+ (positive directional movement), and DI- (negative directional movement).
#### 2. **RSI Calculation:**
- `rsiValue` is calculated using the built-in `ta.rsi(close, rsiLength)`.
- A **sideways market** is expected when RSI is in the **40–60 range**, indicating lack of strong momentum.
#### 3. **ADX and Directional Indicators (DI+ and DI-):**
- `diPlus` and `diMinus` are calculated based on recent price movements and the True Range.
- `dx` (Directional Index) measures the strength of trend direction using the difference between DI+ and DI-.
- `adx` is a smoothed version of `dx` and represents **overall trend strength**.
#### 4. **Sideways Market Conditions:**
- **RSI Condition**: RSI is between 40 and 60.
- **ADX Condition**:
- `adx <= 25` → Weak or no trend.
- `adx < diPlus` and `adx < diMinus` → Confirms ADX is lower than directional components, reducing likelihood of a trending market.
#### 5. **Signal Plot:**
- A **green label below the bar** (`shape.labelup`) is plotted when both conditions are met.
- Indicates potential sideways market conditions.
---
### ✅ **Use Case:**
- This signal can help identify **low-volatility zones** suitable for **short strangles** or **iron condors**, where you profit from time decay while expecting the price to stay within a range.
在腳本中搜尋"股价站上60月线"
PowerHouse SwiftEdge AI v2.10 StrategyOverview
The PowerHouse SwiftEdge AI v2.10 Strategy is a sophisticated trading system designed to identify high-probability trade setups in forex, stocks, and cryptocurrencies. By combining multi-timeframe trend analysis, momentum signals, volume confirmation, and smart money concepts (Change of Character and Break of Structure ), this strategy offers traders a robust tool to capitalize on market trends while minimizing false signals. The strategy’s unique “AI” component analyzes trends across multiple timeframes to provide a clear, actionable dashboard, making it accessible for both novice and experienced traders. The strategy is fully customizable, allowing users to tailor its filters to their trading style.
What It Does
This strategy generates Buy and Sell signals based on a confluence of technical indicators and smart money concepts. It uses:
Multi-Timeframe Trend Analysis: Confirms the market’s direction by analyzing trends on the 1-hour (60M), 4-hour (240M), and daily (D) timeframes.
Momentum Filter: Ensures trades align with strong price movements to avoid choppy markets.
Volume Filter: Validates signals with above-average volume to confirm market participation.
Breakout Filter: Requires price to break key levels for added confirmation.
Smart Money Signals (CHoCH/BOS): Identifies reversals (CHoCH) and trend continuations (BOS) based on pivot points.
AI Trend Dashboard: Summarizes trend strength, confidence, and predictions across timeframes, helping traders make informed decisions without needing to analyze complex data manually.
The strategy also plots dynamic support and resistance trendlines, take-profit (TP) levels, and “Get Ready” signals to alert users of potential setups before they fully develop. Trades are executed with predefined take-profit and stop-loss levels for disciplined risk management.
How It Works
The strategy integrates multiple components to create a cohesive trading system:
Multi-Timeframe Trend Analysis:
The strategy evaluates trends on three timeframes (1H, 4H, Daily) using Exponential Moving Averages (EMA) and Volume-Weighted Average Price (VWAP). A trend is considered bullish if the price is above both the EMA and VWAP, bearish if below, or neutral otherwise.
Signals are only generated when the trend on the user-selected higher timeframe aligns with the trade direction (e.g., Buy signals require a bullish higher timeframe trend). This reduces noise and ensures trades follow the broader market context.
Momentum Filter:
Measures the percentage price change between consecutive bars and compares it to a volatility-adjusted threshold (based on the Average True Range ). This ensures trades are taken only during significant price movements, filtering out low-momentum conditions.
Volume Filter (Optional):
Checks if the current volume exceeds a long-term average and shows positive short-term volume change. This confirms strong market participation, reducing the risk of false breakouts.
Breakout Filter (Optional):
Requires the price to break above (for Buy) or below (for Sell) recent highs/lows, ensuring the signal aligns with a structural shift in the market.
Smart Money Concepts (CHoCH/BOS):
Change of Character (CHoCH): Detects potential reversals when the price crosses under a recent pivot high (for Sell) or over a recent pivot low (for Buy) with a bearish or bullish candle, respectively.
Break of Structure (BOS): Confirms trend continuations when the price breaks below a recent pivot low (for Sell) or above a recent pivot high (for Buy) with strong momentum.
These signals are plotted as horizontal lines with labels, making it easy to visualize key levels.
AI Trend Dashboard:
Combines trend direction, momentum, and volatility (ATR) across timeframes to calculate a trend score. Scores above 0.5 indicate an “Up” trend, below -0.5 indicate a “Down” trend, and otherwise “Neutral.”
Displays a table summarizing trend strength (as a percentage), AI confidence (based on trend alignment), and Cumulative Volume Delta (CVD) for market context.
A second table (optional) shows trend predictions for 1H, 4H, and Daily timeframes, helping traders anticipate future market direction.
Dynamic Trendlines:
Plots support and resistance lines based on recent swing lows and highs within user-defined periods (shortTrendPeriod, longTrendPeriod). These lines adapt to market conditions and are colored based on trend strength.
Why This Combination?
The PowerHouse SwiftEdge AI v2.10 Strategy is original because it seamlessly integrates traditional technical analysis (EMA, VWAP, ATR, volume) with smart money concepts (CHoCH, BOS) and a proprietary AI-driven trend analysis. Unlike standalone indicators, this strategy:
Reduces False Signals: By requiring confluence across trend, momentum, volume, and breakout filters, it minimizes trades in choppy or low-conviction markets.
Adapts to Market Context: The ATR-based momentum threshold adjusts dynamically to volatility, ensuring signals remain relevant in both trending and ranging markets.
Simplifies Decision-Making: The AI dashboard distills complex multi-timeframe data into a user-friendly table, eliminating the need for manual analysis.
Leverages Smart Money: CHoCH and BOS signals capture institutional price action patterns, giving traders an edge in identifying reversals and continuations.
The combination of these components creates a balanced system that aligns short-term trade entries with longer-term market trends, offering a unique blend of precision, adaptability, and clarity.
How to Use
Add to Chart:
Apply the strategy to your TradingView chart on a liquid symbol (e.g., EURUSD, BTCUSD, AAPL) with a timeframe of 60 minutes or lower (e.g., 15M, 60M).
Configure Inputs:
Pivot Length: Adjust the number of bars (default: 5) to detect pivot highs/lows for CHoCH/BOS signals. Higher values reduce noise but may delay signals.
Momentum Threshold: Set the base percentage (default: 0.01%) for momentum confirmation. Increase for stricter signals.
Take Profit/Stop Loss: Define TP and SL in points (default: 10 each) for risk management.
Higher/Lower Timeframe: Choose timeframes (60M, 240M, D) for trend filtering. Ensure the chart timeframe is lower than or equal to the higher timeframe.
Filters: Enable/disable momentum, volume, or breakout filters to suit your trading style.
Trend Periods: Set shortTrendPeriod (default: 30) and longTrendPeriod (default: 100) for trendline plotting. Keep below 2000 to avoid buffer errors.
AI Dashboard: Toggle Enable AI Market Analysis to show/hide the prediction table and adjust its position.
Interpret Signals:
Buy/Sell Labels: Green "Buy" or red "Sell" labels indicate trade entries with predefined TP/SL levels plotted.
Get Ready Signals: Yellow "Get Ready BUY" or orange "Get Ready SELL" labels warn of potential setups.
CHoCH/BOS Lines: Aqua (CHoCH Sell), lime (CHoCH Buy), fuchsia (BOS Sell), or teal (BOS Buy) lines mark key levels.
Trendlines: Green/lime (support) or fuchsia/purple (resistance) dashed lines show dynamic support/resistance.
AI Dashboard: Check the top-right table for trend strength, confidence, and CVD. The optional bottom table shows trend predictions (Up, Down, Neutral).
Backtest and Trade:
Use TradingView’s Strategy Tester to evaluate performance. Adjust TP/SL and filters based on results.
Trade manually based on signals or automate with TradingView alerts (set alerts for Buy/Sell labels).
Originality and Value
The PowerHouse SwiftEdge AI v2.10 Strategy stands out by combining multi-timeframe analysis, smart money concepts, and an AI-driven dashboard into a single, user-friendly system. Its adaptive momentum threshold, robust filtering, and clear visualizations empower traders to make confident decisions without needing advanced technical knowledge. Whether you’re a day trader or swing trader, this strategy provides a versatile, data-driven approach to navigating dynamic markets.
Important Notes:
Risk Management: Always use appropriate position sizing and risk management, as the strategy’s TP/SL levels are customizable.
Symbol Compatibility: Test on liquid symbols with sufficient historical data (at least 2000 bars) to avoid buffer errors.
Performance: Backtest thoroughly to optimize settings for your market and timeframe.

ChopFlow ATR Scalp StrategyA lean, high-velocity scalp framework for NQ and other futures that blends trend clarity, volume confirmation, and adaptive exits to give you precise, actionable signals—no cluttered bands or lagging indicators.
⸻
🔍 Overview
This strategy locks onto rapid intraday moves by:
• Filtering for directional momentum with the Choppiness Index (CI)
• Confirming conviction via On-Balance Volume (OBV) against its moving average
• Automatically sizing stops and targets with a multiple of the Average True Range (ATR)
It’s designed for scalp traders who need clean, timely entries without wading through choppy noise.
⸻
⚙️ Key Features & Inputs
1. ATR Length & Multiplier
• Controls exit distances based on current volatility.
2. Choppiness Length & Threshold
• Measures trend strength; only fires when the market isn’t “stuck in the mud.”
3. OBV SMA Length
• Smoothes volume flow to confirm genuine buying or selling pressure.
4. Custom Session Hours
• Avoid overnight gaps or low-liquidity periods.
All inputs are exposed for rapid tuning to your preferred scalp cadence.
🚀 How It Works
1. Long Entry triggers when:
• CI < threshold (strong trend)
• OBV > its SMA (positive volume flow)
• You’re within the defined session
2. Short Entry mirrors the above (CI < threshold, OBV < SMA)
3. Exit uses ATR × multiplier for both stop-loss and take-profit
⸻
🎯 Usage Tips
• Start with defaults (ATR 14, multiplier 1.5; CI 14, threshold 60; OBV SMA 10).
• Monitor signal frequency, then tighten/loosen CI or OBV look-back as needed.
• Pair with a fast MA crossover or price-action trigger if you want even sharper timing.
• Backtest across different sessions (early open vs. power hours) to find your edge.
⸻
⚠️ Disclaimer
This script is provided “as-is” for educational and research purposes. Always paper-trade any new setup extensively before deploying live capital, and adjust risk parameters to your personal tolerance.
⸻
Elevate your scalp game with ChopFlow ATR—where trend, volume, and volatility converge for clear, confident entries. Happy scalping!

Dskyz (DAFE) Adaptive Regime - Quant Machine ProDskyz (DAFE) Adaptive Regime - Quant Machine Pro:
Buckle up for the Dskyz (DAFE) Adaptive Regime - Quant Machine Pro, is a strategy that’s your ultimate edge for conquering futures markets like ES, MES, NQ, and MNQ. This isn’t just another script—it’s a quant-grade powerhouse, crafted with precision to adapt to market regimes, deliver multi-factor signals, and protect your capital with futures-tuned risk management. With its shimmering DAFE visuals, dual dashboards, and glowing watermark, it turns your charts into a cyberpunk command center, making trading as thrilling as it is profitable.
Unlike generic scripts clogging up the space, the Adaptive Regime is a DAFE original, built from the ground up to tackle the chaos of futures trading. It identifies market regimes (Trending, Range, Volatile, Quiet) using ADX, Bollinger Bands, and HTF indicators, then fires trades based on a weighted scoring system that blends candlestick patterns, RSI, MACD, and more. Add in dynamic stops, trailing exits, and a 5% drawdown circuit breaker, and you’ve got a system that’s as safe as it is aggressive. Whether you’re a newbie or a prop desk pro, this strat’s your ticket to outsmarting the markets. Let’s break down every detail and see why it’s a must-have.
Why Traders Need This Strategy
Futures markets are a gauntlet—fast moves, volatility spikes (like the April 28, 2025 NQ 1k-point drop), and institutional traps that punish the unprepared. Meanwhile, platforms are flooded with low-effort scripts that recycle old ideas with zero innovation. The Adaptive Regime stands tall, offering:
Adaptive Intelligence: Detects market regimes (Trending, Range, Volatile, Quiet) to optimize signals, unlike one-size-fits-all scripts.
Multi-Factor Precision: Combines candlestick patterns, MA trends, RSI, MACD, volume, and HTF confirmation for high-probability trades.
Futures-Optimized Risk: Calculates position sizes based on $ risk (default: $300), with ATR or fixed stops/TPs tailored for ES/MES.
Bulletproof Safety: 5% daily drawdown circuit breaker and trailing stops keep your account intact, even in chaos.
DAFE Visual Mastery: Pulsing Bollinger Band fills, dynamic SL/TP lines, and dual dashboards (metrics + position) make signals crystal-clear and charts a work of art.
Original Craftsmanship: A DAFE creation, built with community passion, not a rehashed clone of generic code.
Traders need this because it’s a complete, adaptive system that blends quant smarts, user-friendly design, and DAFE flair. It’s your edge to trade with confidence, cut through market noise, and leave the copycats in the dust.
Strategy Components
1. Market Regime Detection
The strategy’s brain is its ability to classify market conditions into five regimes, ensuring signals match the environment.
How It Works:
Trending (Regime 1): ADX > 20, fast/slow EMA spread > 0.3x ATR, HTF RSI > 50 or MACD bullish (htf_trend_bull/bear).
Range (Regime 2): ADX < 25, price range < 3% of close, no HTF trend.
Volatile (Regime 3): BB width > 1.5x avg, ATR > 1.2x avg, HTF RSI overbought/oversold.
Quiet (Regime 4): BB width < 0.8x avg, ATR < 0.9x avg.
Other (Regime 5): Default for unclear conditions.
Indicators: ADX (14), BB width (20), ATR (14, 50-bar SMA), HTF RSI (14, daily default), HTF MACD (12,26,9).
Why It’s Brilliant:
Regime detection adapts signals to market context, boosting win rates in trending or volatile conditions.
HTF RSI/MACD add a big-picture filter, rare in basic scripts.
Visualized via gradient background (green for Trending, orange for Range, red for Volatile, gray for Quiet, navy for Other).
2. Multi-Factor Signal Scoring
Entries are driven by a weighted scoring system that combines candlestick patterns, trend, momentum, and volume for robust signals.
Candlestick Patterns:
Bullish: Engulfing (0.5), hammer (0.4 in Range, 0.2 else), morning star (0.2), piercing (0.2), double bottom (0.3 in Volatile, 0.15 else). Must be near support (low ≤ 1.01x 20-bar low) with volume spike (>1.5x 20-bar avg).
Bearish: Engulfing (0.5), shooting star (0.4 in Range, 0.2 else), evening star (0.2), dark cloud (0.2), double top (0.3 in Volatile, 0.15 else). Must be near resistance (high ≥ 0.99x 20-bar high) with volume spike.
Logic: Patterns are weighted higher in specific regimes (e.g., hammer in Range, double bottom in Volatile).
Additional Factors:
Trend: Fast EMA (20) > slow EMA (50) + 0.5x ATR (trend_bull, +0.2); opposite for trend_bear.
RSI: RSI (14) < 30 (rsi_bull, +0.15); > 70 (rsi_bear, +0.15).
MACD: MACD line > signal (12,26,9, macd_bull, +0.15); opposite for macd_bear.
Volume: ATR > 1.2x 50-bar avg (vol_expansion, +0.1).
HTF Confirmation: HTF RSI < 70 and MACD bullish (htf_bull_confirm, +0.2); RSI > 30 and MACD bearish (htf_bear_confirm, +0.2).
Scoring:
bull_score = sum of bullish factors; bear_score = sum of bearish. Entry requires score ≥ 1.0.
Example: Bullish engulfing (0.5) + trend_bull (0.2) + rsi_bull (0.15) + htf_bull_confirm (0.2) = 1.05, triggers long.
Why It’s Brilliant:
Multi-factor scoring ensures signals are confirmed by multiple market dynamics, reducing false positives.
Regime-specific weights make patterns more relevant (e.g., hammers shine in Range markets).
HTF confirmation aligns with the big picture, a quant edge over simplistic scripts.
3. Futures-Tuned Risk Management
The risk system is built for futures, calculating position sizes based on $ risk and offering flexible stops/TPs.
Position Sizing:
Logic: Risk per trade (default: $300) ÷ (stop distance in points * point value) = contracts, capped at max_contracts (default: 5). Point value = tick value (e.g., $12.5 for ES) * ticks per point (4) * contract multiplier (1 for ES, 0.1 for MES).
Example: $300 risk, 8-point stop, ES ($50/point) → 0.75 contracts, rounded to 1.
Impact: Precise sizing prevents over-leverage, critical for micro contracts like MES.
Stops and Take-Profits:
Fixed: Default stop = 8 points, TP = 16 points (2:1 reward/risk).
ATR-Based: Stop = 1.5x ATR (default), TP = 3x ATR, enabled via use_atr_for_stops.
Logic: Stops set at swing low/high ± stop distance; TPs at 2x stop distance from entry.
Impact: ATR stops adapt to volatility, while fixed stops suit stable markets.
Trailing Stops:
Logic: Activates at 50% of TP distance. Trails at close ± 1.5x ATR (atr_multiplier). Longs: max(trail_stop_long, close - ATR * 1.5); shorts: min(trail_stop_short, close + ATR * 1.5).
Impact: Locks in profits during trends, a game-changer in volatile sessions.
Circuit Breaker:
Logic: Pauses trading if daily drawdown > 5% (daily_drawdown = (max_equity - equity) / max_equity).
Impact: Protects capital during black swan events (e.g., April 27, 2025 ES slippage).
Why It’s Brilliant:
Futures-specific inputs (tick value, multiplier) make it plug-and-play for ES/MES.
Trailing stops and circuit breaker add pro-level safety, rare in off-the-shelf scripts.
Flexible stops (ATR or fixed) suit different trading styles.
4. Trade Entry and Exit Logic
Entries and exits are precise, driven by bull_score/bear_score and protected by drawdown checks.
Entry Conditions:
Long: bull_score ≥ 1.0, no position (position_size <= 0), drawdown < 5% (not pause_trading). Calculates contracts, sets stop at swing low - stop points, TP at 2x stop distance.
Short: bear_score ≥ 1.0, position_size >= 0, drawdown < 5%. Stop at swing high + stop points, TP at 2x stop distance.
Logic: Tracks entry_regime for PNL arrays. Closes opposite positions before entering.
Exit Conditions:
Stop-Loss/Take-Profit: Hits stop or TP (strategy.exit).
Trailing Stop: Activates at 50% TP, trails by ATR * 1.5.
Emergency Exit: Closes if price breaches stop (close < long_stop_price or close > short_stop_price).
Reset: Clears stop/TP prices when flat (position_size = 0).
Why It’s Brilliant:
Score-based entries ensure multi-factor confirmation, filtering out weak signals.
Trailing stops maximize profits in trends, unlike static exits in basic scripts.
Emergency exits add an extra safety layer, critical for futures volatility.
5. DAFE Visuals
The visuals are pure DAFE magic, blending function with cyberpunk flair to make signals intuitive and charts stunning.
Shimmering Bollinger Band Fill:
Display: BB basis (20, white), upper/lower (green/red, 45% transparent). Fill pulses (30–50 alpha) by regime, with glow (60–95 alpha) near bands (close ≥ 0.995x upper or ≤ 1.005x lower).
Purpose: Highlights volatility and key levels with a futuristic glow.
Visuals make complex regimes and signals instantly clear, even for newbies.
Pulsing effects and regime-specific colors add a DAFE signature, setting it apart from generic scripts.
BB glow emphasizes tradeable levels, enhancing decision-making.
Chart Background (Regime Heatmap):
Green — Trending Market: Strong, sustained price movement in one direction. The market is in a trend phase—momentum follows through.
Orange — Range-Bound: Market is consolidating or moving sideways, with no clear up/down trend. Great for mean reversion setups.
Red — Volatile Regime: High volatility, heightened risk, and larger/faster price swings—trade with caution.
Gray — Quiet/Low Volatility: Market is calm and inactive, with small moves—often poor conditions for most strategies.
Navy — Other/Neutral: Regime is uncertain or mixed; signals may be less reliable.
Bollinger Bands Glow (Dynamic Fill):
Neon Red Glow — Warning!: Price is near or breaking above the upper band; momentum is overstretched, watch for overbought conditions or reversals.
Bright Green Glow — Opportunity!: Price is near or breaking below the lower band; market could be oversold, prime for bounce or reversal.
Trend Green Fill — Trending Regime: Fills between bands with green when the market is trending, showing clear momentum.
Gold/Yellow Fill — Range Regime: Fills with gold/aqua in range conditions, showing the market is sideways/oscillating.
Magenta/Red Fill — Volatility Spike: Fills with vivid magenta/red during highly volatile regimes.
Blue Fill — Neutral/Quiet: A soft blue glow for other or uncertain market states.
Moving Averages:
Display: Blue fast EMA (20), red slow EMA (50), 2px.
Purpose: Shows trend direction, with trend_dir requiring ATR-scaled spread.
Dynamic SL/TP Lines:
Display: Pulsing colors (red SL, green TP for Trending; yellow/orange for Range, etc.), 3px, with pulse_alpha for shimmer.
Purpose: Tracks stops/TPs in real-time, color-coded by regime.
6. Dual Dashboards
Two dashboards deliver real-time insights, making the strat a quant command center.
Bottom-Left Metrics Dashboard (2x13):
Metrics: Mode (Active/Paused), trend (Bullish/Bearish/Neutral), ATR, ATR avg, volume spike (YES/NO), RSI (value + Oversold/Overbought/Neutral), HTF RSI, HTF trend, last signal (Buy/Sell/None), regime, bull score.
Display: Black (29% transparent), purple title, color-coded (green for bullish, red for bearish).
Purpose: Consolidates market context and signal strength.
Top-Right Position Dashboard (2x7):
Metrics: Regime, position side (Long/Short/None), position PNL ($), SL, TP, daily PNL ($).
Display: Black (29% transparent), purple title, color-coded (lime for Long, red for Short).
Purpose: Tracks live trades and profitability.
Why It’s Brilliant:
Dual dashboards cover market context and trade status, a rare feature.
Color-coding and concise metrics guide beginners (e.g., green “Buy” = go).
Real-time PNL and SL/TP visibility empower disciplined trading.
7. Performance Tracking
Logic: Arrays (regime_pnl_long/short, regime_win/loss_long/short) track PNL and win/loss by regime (1–5). Updated on trade close (barstate.isconfirmed).
Purpose: Prepares for future adaptive thresholds (e.g., adjust bull_score min based on regime performance).
Why It’s Brilliant: Lays the groundwork for self-optimizing logic, a quant edge over static scripts.
Key Features
Regime-Adaptive: Optimizes signals for Trending, Range, Volatile, Quiet markets.
Futures-Optimized: Precise sizing for ES/MES with tick-based risk inputs.
Multi-Factor Signals: Candlestick patterns, RSI, MACD, and HTF confirmation for robust entries.
Dynamic Exits: ATR/fixed stops, 2:1 TPs, and trailing stops maximize profits.
Safe and Smart: 5% drawdown breaker and emergency exits protect capital.
DAFE Visuals: Shimmering BB fill, pulsing SL/TP, and dual dashboards.
Backtest-Ready: Fixed qty and tick calc for accurate historical testing.
How to Use
Add to Chart: Load on a 5min ES/MES chart in TradingView.
Configure Inputs: Set instrument (ES/MES), tick value ($12.5/$1.25), multiplier (1/0.1), risk ($300 default). Enable ATR stops for volatility.
Monitor Dashboards: Bottom-left for regime/signals, top-right for position/PNL.
Backtest: Run in strategy tester to compare regimes.
Live Trade: Connect to Tradovate or similar. Watch for slippage (e.g., April 27, 2025 ES issues).
Replay Test: Try April 28, 2025 NQ drop to see regime shifts and stops.
Disclaimer
Trading futures involves significant risk of loss and is not suitable for all investors. Past performance does not guarantee future results. Backtest results may differ from live trading due to slippage, fees, or market conditions. Use this strategy at your own risk, and consult a financial advisor before trading. Dskyz (DAFE) Trading Systems is not responsible for any losses incurred.
Backtesting:
Frame: 2023-09-20 - 2025-04-29
Slippage: 3
Fee Typical Range (per side, per contract)
CME Exchange $1.14 – $1.20
Clearing $0.10 – $0.30
NFA Regulatory $0.02
Firm/Broker Commis. $0.25 – $0.80 (retail prop)
TOTAL $1.60 – $2.30 per side
Round Turn: (enter+exit) = $3.20 – $4.60 per contract
Final Notes
The Dskyz (DAFE) Adaptive Regime - Quant Machine Pro is more than a strategy—it’s a revolution. Crafted with DAFE’s signature precision, it rises above generic scripts with adaptive regimes, quant-grade signals, and visuals that make trading a thrill. Whether you’re scalping MES or swinging ES, this system empowers you to navigate markets with confidence and style. Join the DAFE crew, light up your charts, and let’s dominate the futures game!
(This publishing will most likely be taken down do to some miscellaneous rule about properly displaying charting symbols, or whatever. Once I've identified what part of the publishing they want to pick on, I'll adjust and repost.)
Use it with discipline. Use it with clarity. Trade smarter.
**I will continue to release incredible strategies and indicators until I turn this into a brand or until someone offers me a contract.
Created by Dskyz, powered by DAFE Trading Systems. Trade smart, trade bold.

Dskyz Options Flow Flux (OFF) - FuturesDskyz Options Flow Flux (OFF) - Futures
*This is a repost due to moderator intervention on use of ™ in my scripts. I'm in the process of getting this rectified. This was originally posted around mid-night CDT.
🧠 The Dskyz Options Flow Flux (OFF) - Futures indicator is a game changer for futures traders looking to tap into institutional activity with limited resources. Designed for TradingView this tool simulates options flow data (call/put volume and open interest) for futures contracts like MNQ MES NQ and ES giving u actionable insights through volume spike detection volatility adjustments and stunning visuals like aurora flux bands and round number levels. Whether u’re a beginner learning the ropes or a pro hunting for an edge this indicator delivers real time market sentiment and key price levels to boost ur trading game
Key Features
⚡ Simulated Options Flow: Breaks down call/put volume and open interest using market momentum and volatility
📈 Spike Detection: Spots big moves in volume and open interest with customizable thresholds
🧠 Volatility Filter: Adapts to market conditions using ATR for smarter spike detection
✨ Aurora Flux Bands: Glows with market sentiment showing u bullish or bearish vibes at a glance
🎯 Round Number Levels: Marks key psychological levels where big players might step in
📊 Interactive Dashboard: Real time metrics like sentiment score and volatility factor right on ur chart
🚨 Alerts: Get notified of bullish or bearish spikes so u never miss a move
How It Works
🧠 This indicator is built to make complex options flow analysis simple even with the constraints of Pine Script. Here’s the step by step:
Simulated Volume Data (Dynamic Split):
Pulls daily volume for ur chosen futures contract (MNQ1! MES1! NQ1! ES1!)
Splits it into call and put volume based on momentum (ta.mom) and volatility (ATR vs its 20 period average)
Estimates open interest (OI) for calls and puts (1.15x for calls 1.1x for puts)
Formula: callRatio = 0.5 + (momentum / close) * 10 + (volatility - 1) * 0.1 capped between 0.3 and 0.7
Why It Matters: Mimics how big players might split their trades giving u a peek into institutional sentiment
Spike Detection:
Compares current volume/OI to short term (lookbackShort) and long term (lookbackLong) averages
Flags spikes when volume/OI exceeds the average by ur set threshold (spikeThreshold for regular highConfidenceThreshold for strong)
Adjusts for volatility so u’re not fooled by choppy markets
Output: optionsSignal (2 for strong bullish -2 for strong bearish 1 for bullish -1 for bearish 0 for neutral)
Why It Matters: Pinpoints where big money might be stepping in
Volatility Filter:
Uses ATR (10 periods) and its 20 period average to calculate a volatility factor (volFactor = ATR / avgAtr)
Scales spike thresholds based on market conditions (volAdjustedThreshold = spikeThreshold * max(1 volFactor * volFilter))
Why It Matters: Keeps ur signals reliable whether the market is calm or wild
Sentiment Score:
Calculates a call/put ratio (callVolume / putVolume) and adjusts for volatility
Converts it to a 0 to 100 score (higher = bullish lower = bearish)
Formula: sentimentScore = min(max((volAdjustedSentiment - 1) * 50 0) 100)
Why It Matters: Gives u a quick read on market bias
Round Number Detection:
Finds the nearest round number (e.g. 100 for MNQ1! 50 for MES1!)
Checks for volume spikes (volume > 3 period SMA * spikeThreshold) and if price is close (within ATR * atrMultiplier)
Updates the top activity level every 15 minutes when significant activity is detected
Why It Matters: Highlights psychological levels where price often reacts
Visuals and Dashboard:
Combines aurora flux bands glow effects round number lines and a dashboard to make insights pop (see Visual Elements below)
Plots triangles for call/put spikes (green/red for strong lime/orange for regular)
Sets up alerts for key market moves
Why It Matters: Makes complex data easy to read at a glance
Inputs and Customization
⚙️ Beginners can tweak these settings to match their trading style while pros can dig deeper for precision:
Futures Symbol (symbol): Pick ur contract (MNQ1! MES1! NQ1! ES1!). Default: MNQ1!
Short Lookback (lookbackShort): Days for short term averages. Smaller = more sensitive. Range: 1+. Default: 5
Long Lookback (lookbackLong): Days for long term averages. Range: 5+. Default: 10
Spike Threshold (spikeThreshold): How big a spike needs to be (e.g. 1.1 = 10% above average). Range: 1.0+. Default: 1.1
High Confidence Threshold (highConfidenceThreshold): For strong spikes (e.g. 3.0 = 3x average). Range: 2.0+. Default: 3.0
Volatility Filter (volFilter): Adjusts for market volatility (e.g. 1.2 = 20% stricter in volatile markets). Range: 1.0+. Default: 1.2
Aurora Flux Transparency (glowOpacity): Controls band transparency (0 = solid 100 = invisible). Range: 0 to 100. Default: 65
Show Show OFF Dashboard (showDashboard): Toggles the dashboard with key metrics. Default: true
Show Nearest Round Number (showRoundNumbers): Displays round number levels. Default: true
ATR Multiplier for Proximity (atrMultiplier): How close price needs to be to a round number (e.g. 1.5 = within 1.5x ATR). Range: 0.5+. Default: 1.5
Functions and Logic
🧠 Here’s the techy stuff pros will love:
Simulated Volume Data : Splits daily volume into call/put volume and OI using momentum and volatility
Volatility Filter: Scales thresholds with volFactor = atr / avgAtr for adaptive detection
Spike Detection: Flags spikes and assigns optionsSignal (2, -2, 1, -1, 0) for sentiment
Sentiment Score: Converts call/put ratio into a 0-100 score for quick bias reads
Round Number Detection: Identifies key levels and significant activity for trading zones
Dashboard Display: Updates real time metrics like sentiment score and volatility factor
Visual Elements
✨ These visuals make data come alive:
Gradient Background: Green (bullish) red (bearish) or yellow (neutral/choppy) at 95% transparency to show trend
Aurora Flux Bands: Stepped bands (linewidth 3) around a 14 period EMA ± ATR * 1.8. Colors shift with sentiment (green red lime orange gray) with glow effects at 85% transparency
Round Number Visualization: Stepped lines (linewidth 2) at key levels (solid if active dashed if not) with labels (black background white text size.normal)
Visual Signals: Triangles above/below bars for spikes (size.small for strong size.tiny for regular)
Dashboard: Bottom left table (2 columns 10 rows) with a black background (29% transparency) gray border and metrics:
⚡ Round Number Activity: “Detected” or “None”
📈 Trend: “Bullish” “Bearish” or “Neutral” (colored green/red/gray)
🧠 ATR: Current 10 period ATR
📊 ATR Avg: 20 period SMA of ATR
📉 Volume Spike: “YES” (green) or “NO” (red)
📋 Call/Put Ratio: Current ratio
✨ Flux Signal: “Strong Bullish” “Strong Bearish” “Bullish” “Bearish” or “Neutral” (colored green/red/gray)
⚙️ Volatility Factor: Current volFactor
📈 Sentiment Score: 0-100 score
Usage and Strategy Recommendations
🎯 For Beginners: Use high confidence spikes (green/red triangles) for easy entries. Check the dashboard for a quick market read (sentiment score above 60 = bullish below 40 = bearish). Watch round number levels for support/resistance
💡 For Pros: Combine flux signals with round number activity for high probability setups. Adjust lookbackShort/lookbackLong for trending vs choppy markets. Use volFactor for position sizing (higher = smaller positions)

Smart Market Matrix Smart Market Matrix
This indicator is designed for intraday, scalping, providing automated detection of price pivots, liquidity traps, and breakout confirmations, along with a context dashboard featuring volatility, trend, and volume.
## Summary Description
### Menu Settings & Their Roles
- **Swing Pivot Strength**: Controls the sensitivity for detecting High/Low pivots.
- **Show Pivot Points**: Toggles the display of HH/LL markers on the chart.
- **VWMA Length for Trap Volume** & **Volume Spike Multiplier**: Identify concentrated volume spikes for liquidity traps.
- **Wick Ratio Threshold** & **Max Body Size Ratio**: Detect candles with disproportionate wicks and small bodies (doji-ish) for traps.
- **ATR Length for Trap**: Measures volatility specific to trap detection.
- **VWMA Length for Breakout Volume**, **ATR Multiplier for Breakout**, **ATR Length for Breakout**, **Min Body/Range Ratio**: Set adaptive breakout thresholds based on volatility and volume.
- **OBV Smooth Length**: Smooths OBV momentum for breakout confirmation.
- **Enable VWAP Filter for Confirmations**: Optionally validate breakouts against the VWAP.
- **Enable Higher-TF Trend Filter** & **Trend Filter Timeframe**: Align breakout signals with the 1h/4h/Daily trend.
- **ADX Length**, **EMA Fast/Slow Length for Context**: Parameters for the context dashboard (Volatility, Trend, Volume).
- **Show Intraday VWAP Line**, **VWAP Line Color/Width**: Display the intraday VWAP line with custom style.
### Signal Interpretation Map
| Signal | Description | Recommended Action |
|--------------------------------|-----------------------------------------------------------|-------------------------------------------|
| 📌 **HH / LL (pivot)** | Market structure (support/resistance) | Note key levels |
| **Bull Trap(green diamond)** | Sweep down + volume spike + wick + rejection | Go long with trend filter
| **Bear Trap(red diamond)** | Sweep up + volume spike + wick + rejection | Go short with trend filter
| 🔵⬆️ **Breakout Confirmed Up** | Close > ATR‑scaled high + volume + OBV↑ | Go long with trend filter |
| 🔵⬇️ **Breakout Confirmed Down** | Close < ATR‑scaled low + volume + OBV↓ | Go short with trend filter |
| 📊 **VWAP Line** | Intraday reference to guide price | Use as dynamic support/resistance |
| ⚡ **Volatility** | ATR ratio High/Med/Low | Adjust position size |
| 📈 **Trend Context** | ADX+EMA Strong/Moderate/Weak | Confirm trend direction |
| 🔍 **Volume Context** | Breakout / Rising / Falling / Calm | Check volume momentum |
*This summary gives you a quick overview of the key settings and how to interpret signals for efficient intraday scalping.*
### Suggested Settings
- **Intraday Scalping (5m–15m)**
- `Swing Pivot Strength = 5`
- `VWMA Length for Trap Volume = 10`, `Volume Spike Multiplier = 1.6`
- `ATR Length for Trap = 7`
- `VWMA Length for Breakout Volume = 12`, `ATR Length for Breakout = 9`, `ATR Multiplier for Breakout = 0.5`
- `Min Body/Range Ratio for Breakout = 0.5`, `OBV Smooth Length = 7`
- `Enable Higher-TF Trend Filter = true` (TF = 60)
- `Show Intraday VWAP Line = true` (Color = orange, Width = 2)
- **Swing Trading (4h–Daily)**
- `Swing Pivot Strength = 10`
- `VWMA Length for Trap Volume = 20`, `Volume Spike Multiplier = 2.0`
- `ATR Length for Trap = 14`
- `VWMA Length for Breakout Volume = 30`, `ATR Length for Breakout = 14`, `ATR Multiplier for Breakout = 0.8`
- `Min Body/Range Ratio for Breakout = 0.7`, `OBV Smooth Length = 14`
- `Enable Higher-TF Trend Filter = true` (TF = D)
- `Show Intraday VWAP Line = false`
*Adjust these values based on the symbol and market volatility for optimal performance.*

SynchroTrend Oscillator (STO) [PhenLabs]📊 SynchroTrend Oscillator
Version: PineScript™ v5
📌 Description
The SynchroTrend Oscillator (STO) is a multi-timeframe synchronization tool that combines trend information from three distinct timeframes into a single, easy-to-interpret oscillator ranging from -100 to +100.
This indicator solves the common problem of having to analyze multiple timeframe charts separately by consolidating trend direction and strength across different time horizons. The STO helps traders identify when markets are truly synchronized across timeframes, potentially indicating stronger trend conditions and higher probability trading opportunities.
Using either Moving Average crossovers or RSI analysis as the trend definition metric, the STO provides a comprehensive view of market structure that adapts to various trading strategies and market conditions.
🚀 Points of Innovation
Triple-timeframe synchronization in a single view eliminates chart switching
Dual trend detection methods (MA vs Price or RSI) for flexibility across different markets
Dynamic color intensity that automatically increases with signal strength
Scaled oscillator format (-100 to +100) for intuitive trend strength interpretation
Customizable signal thresholds to match your risk tolerance and trading style
Visual alerts when markets reach full synchronization states
🔧 Core Components
Trend Scoring System: Calculates a binary score (+1, -1, or 0) for each timeframe based on selected metrics, providing clear trend direction
Multi-Timeframe Synchronization: Combines and scales trend scores from all three timeframes into a single oscillator
Dynamic Visualization: Adjusts color transparency based on signal strength, creating an intuitive visual guide
Threshold System: Provides customizable levels for identifying potentially significant trading opportunities
🔥 Key Features
Triple Timeframe Analysis: Synchronizes three user-defined timeframes (default: 60min, 15min, 5min) into one view
Dual Trend Detection Methods: Choose between Moving Average vs Price or RSI-based trend determination
Adjustable Signal Smoothing: Apply EMA, SMA, or no smoothing to the oscillator output for your preferred signal responsiveness
Dynamic Color Intensity: Colors become more vibrant as signal strength increases, helping identify strongest setups
Customizable Thresholds: Set your own buy/sell threshold levels to match your trading strategy
Comprehensive Alerts: Six different alert conditions for crossing thresholds, zero line, and full synchronization states
🎨 Visualization
Oscillator Line: The main line showing the synchronized trend value from -100 to +100
Dynamic Fill: Area between oscillator and zero line changes transparency based on signal strength
Threshold Lines: Optional dotted lines indicating buy/sell thresholds for visual reference
Color Coding: Green for bullish synchronization, red for bearish synchronization
📖 Usage Guidelines
Timeframe Settings
Timeframe 1: Default: 60 (1 hour) - Primary higher timeframe for trend definition
Timeframe 2: Default: 15 (15 minutes) - Intermediate timeframe for trend definition
Timeframe 3: Default: 5 (5 minutes) - Lower timeframe for trend definition
Trend Calculation Settings
Trend Definition Metric: Default: “MA vs Price” - Method used to determine trend on each timeframe
MA Type: Default: EMA - Moving Average type when using MA vs Price method
MA Length: Default: 21 - Moving Average period when using MA vs Price method
RSI Length: Default: 14 - RSI period when using RSI method
RSI Source: Default: close - Price data source for RSI calculation
Oscillator Settings
Smoothing Type: Default: SMA - Applies smoothing to the final oscillator
Smoothing Length: Default: 5 - Period for the smoothing function
Visual & Threshold Settings
Up/Down Colors: Customize colors for bullish and bearish signals
Transparency Range: Control how transparency changes with signal strength
Line Width: Adjust oscillator line thickness
Buy/Sell Thresholds: Set levels for potential entry/exit signals
✅ Best Use Cases
Trend confirmation across multiple timeframes
Finding high-probability entry points when all timeframes align
Early detection of potential trend reversals
Filtering trade signals from other indicators
Market structure analysis
Identifying potential divergences between timeframes
⚠️ Limitations
Like all indicators, can produce false signals during choppy or ranging markets
Works best in trending market conditions
Should not be used in isolation for trading decisions
Past performance is not indicative of future results
May require different settings for different markets or instruments
💡 What Makes This Unique
Combines three timeframes in a single visualization without requiring multiple chart windows
Dynamic transparency feature that automatically emphasizes stronger signals
Flexible trend definition methods suitable for different market conditions
Visual system that makes multi-timeframe analysis intuitive and accessible
🔬 How It Works
1. Trend Evaluation:
For each timeframe, the indicator calculates a trend score (+1, -1, or 0) using either:
MA vs Price: Comparing close price to a moving average
RSI: Determining if RSI is above or below 50
2. Score Aggregation:
The three trend scores are combined and then scaled to a range of -100 to +100
A value of +100 indicates all timeframes show bullish conditions
A value of -100 indicates all timeframes show bearish conditions
Values in between indicate varying degrees of alignment
3. Signal Processing:
The raw oscillator value can be smoothed using EMA, SMA, or left unsmoothed
The final value determines line color, fill color, and transparency settings
Threshold levels are applied to identify potential trading opportunities
💡 Note:
The SynchroTrend Oscillator is most effective when used as part of a comprehensive trading strategy that includes proper risk management techniques. For best results, consider using the oscillator in conjunction with support/resistance levels, price action analysis, and other complementary indicators that align with your trading style.

Clenow MomentumClenow Momentum Method
The Clenow Momentum Method, developed by Andreas Clenow, is a systematic, quantitative trading strategy focused on capturing medium- to long-term price trends in financial markets. Popularized through Clenow’s book, Stocks on the Move: Beating the Market with Hedge Fund Momentum Strategies, the method leverages momentum—an empirically observed phenomenon where assets that have performed well in the recent past tend to continue performing well in the near future.
Theoretical Foundation
Momentum investing is grounded in behavioral finance and market inefficiencies. Investors often exhibit herding behavior, underreact to new information, or chase trends, causing prices to trend beyond fundamental values. Clenow’s method builds on academic research, such as Jegadeesh and Titman (1993), which demonstrated that stocks with high returns over 3–12 months outperform those with low returns over similar periods.
Clenow’s approach specifically uses **annualized momentum**, calculated as the rate of return over a lookback period (typically 90 days), annualized to reflect a yearly percentage. The formula is:
Momentum=(((Close N periods agoCurrent Close)^N252)−1)×100
- Current Close: The most recent closing price.
- Close N periods ago: The closing price N periods back (e.g., 90 days).
- N: Lookback period (commonly 90 days).
- 252: Approximate trading days in a year for annualization.
This metric ranks stocks by their momentum, prioritizing those with the strongest upward trends. Clenow’s method also incorporates risk management, diversification, and volatility adjustments to enhance robustness.
Methodology
The Clenow Momentum Method involves the following steps:
1. Universe Selection:
- A broad universe of liquid stocks is chosen, often from major indices (e.g., S&P 500, Nasdaq 100) or global exchanges.
- Filters should exclude illiquid stocks (e.g., low average daily volume) or those with extreme volatility.
2. Momentum Calculation:
- Stocks are ranked based on their annualized momentum over a lookback period (typically 90 days, though 60–120 days can be common tests).
- The top-ranked stocks (e.g., top 10–20%) are selected for the portfolio.
3. Volatility Adjustment (Optional):
- Clenow sometimes adjusts momentum scores by volatility (e.g., dividing by the standard deviation of returns) to favor stocks with smoother trends.
- This reduces exposure to erratic price movements.
4. Portfolio Construction:
- A diversified portfolio of 10–25 stocks is constructed, with equal or volatility-weighted allocations.
- Position sizes are often adjusted based on risk (e.g., 1% of capital per position).
5. Rebalancing:
- The portfolio is rebalanced periodically (e.g., weekly or monthly) to maintain exposure to high-momentum stocks.
- Stocks falling below a momentum threshold are replaced with higher-ranked candidates.
6. Risk Management:
- Stop-losses or trailing stops may be applied to limit downside risk.
- Diversification across sectors reduces concentration risk.
Implementation in TradingView
Key features include:
- Customizable Lookback: Users can adjust the lookback period in pinescript (e.g., 90 days) to align with Clenow’s methodology.
- Visual Cues: Background colors (green for positive, red for negative momentum) and a zero line help identify trend strength.
- Integration with Screeners: TradingView’s stock screener can filter high-momentum stocks, which can then be analyzed with the custom indicator.
Strengths
1. Simplicity: The method is straightforward, relying on a single metric (momentum) that’s easy to calculate and interpret.
2. Empirical Support: Backed by decades of academic research and real-world hedge fund performance.
3. Adaptability: Applicable to stocks, ETFs, or other asset classes, with flexible lookback periods.
4. Risk Management: Diversification and periodic rebalancing reduce idiosyncratic risk.
5. TradingView Integration: Pine Script implementation enables real-time visualization, enhancing decision-making for stocks like NVDA or SPY.
Limitations
1. Mean Reversion Risk: Momentum can reverse sharply in bear markets or during sector rotations, leading to drawdowns.
2. Transaction Costs: Frequent rebalancing increases trading costs, especially for retail traders with high commissions. This is not as prevalent with commission free trading becoming more available.
3. Overfitting Risk: Over-optimizing lookback periods or filters can reduce out-of-sample performance.
4. Market Conditions: Underperforms in low-momentum or highly volatile markets.
Practical Applications
The Clenow Momentum Method is ideal for:
Retail Traders: Use TradingView’s screener to identify high-momentum stocks, then apply the Pine Script indicator to confirm trends.
Portfolio Managers: Build diversified momentum portfolios, rebalancing monthly to capture trends.
Swing Traders: Combine with volume filters to target short-term breakouts in high-momentum stocks.
Cross-Platform Workflow: Integrate with Python scanners to rank stocks, then visualize on TradingView for trade execution.
Comparison to Other Strategies
Vs. Minervini’s VCP: Clenow’s method is purely quantitative, while Minervini’s Volatility Contraction Pattern (your April 11, 2025 query) combines momentum with chart patterns. Clenow is more systematic but less discretionary.
Vs. Mean Reversion: Momentum bets on trend continuation, unlike mean reversion strategies that target oversold conditions.
Vs. Value Investing: Momentum outperforms in bull markets but may lag value strategies in recovery phases.
Conclusion
The Clenow Momentum Method is a robust, evidence-based strategy that capitalizes on price trends while managing risk through diversification and rebalancing. Its simplicity and adaptability make it accessible to retail traders, especially when implemented on platforms like TradingView with custom Pine Script indicators. Traders must be mindful of transaction costs, mean reversion risks, and market conditions. By combining Clenow’s momentum with volume filters and alerts, you can optimize its application for swing or position trading.

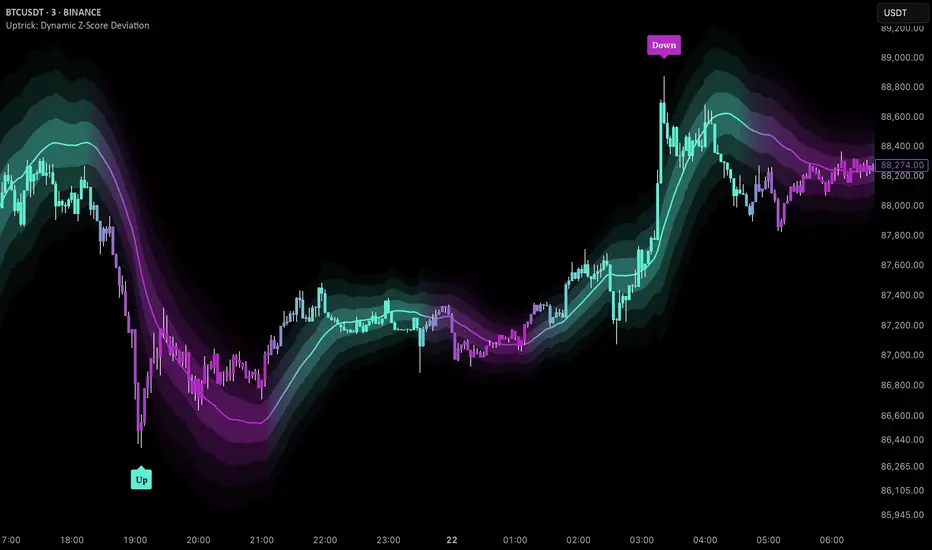
Uptrick: Dynamic Z-Score DeviationOverview
Uptrick: Dynamic Z‑Score Deviation is a trading indicator built in Pine Script that combines statistical filters and adaptive smoothing to highlight potential reversal points in price action. It combines a hybrid moving average, dual Z‑Score analysis on both price and RSI, and visual enhancements like slope‑based coloring, ATR‑based shadow bands, and dynamically scaled reversal signals.
Introduction
Statistical indicators like Z‑Scores measure how far a value deviates from its average relative to the typical variation (standard deviation). Standard deviation quantifies how dispersed a set of values is around its mean. A Z‑Score of +2 indicates a value two standard deviations above the mean, while -2 is two below. Traders use Z‑Scores to spot unusually high or low readings that may signal overbought or oversold conditions.
Moving averages smooth out price data to reveal trends. The Arnaud Legoux Moving Average (ALMA) reduces lag and noise through weighted averaging. A Zero‑Lag EMA (approximated here using a time‑shifted EMA) seeks to further minimize delay in following price. The RSI (Relative Strength Index) is a momentum oscillator that measures recent gains against losses over a set period.
ATR (Average True Range) gauges market volatility by averaging the range between high and low over a lookback period. Shadow bands built using ATR give a visual mood of volatility around a central trend line. Together, these tools inform a dynamic but statistically grounded view of market extremes.
Purpose
The main goal of this indicator is to help traders spot short‑term reversal opportunities on lower timeframes. By requiring both price and momentum (RSI) to exhibit statistically significant deviations from their norms, it filters out weak setups and focuses on higher‑probability mean‑reversion zones. Reversal signals appear when price deviates far enough from its hybrid moving average and RSI deviates similarly in the same direction. This makes it suitable for discretionary traders seeking clean entry cues in volatile environments.
Originality and Uniqueness
Uptrick: Dynamic Z‑Score Deviation distinguishes itself from standard reversal or mean‑reversion tools by combining several elements into a single framework:
A composite moving average (ALMA + Zero‑Lag EMA) for a smooth yet responsive baseline
Dual Z‑Score filters on price and RSI rather than relying on a single measure
Adaptive visual elements, including slope‑aware coloring, multi‑layer ATR shadows, and signal sizing based on combined Z‑Score magnitude
Most indicators focus on one aspect—price envelopes or RSI thresholds—whereas Uptrick: Dynamic Z‑Score Deviation requires both layers to align before signaling. Its visual design aids quick interpretation without overwhelming the chart.
Why these indicators were merged
Every component in Uptrick: Dynamic Z‑Score Deviation has a purpose:
• ALMA: provides a smooth moving average with reduced lag and fewer false crossovers than a simple SMA or EMA.
• Zero‑Lag EMA (ZLMA approximation): further reduces the delay relative to price by applying a time shift to EMA inputs. This keeps the composite MA closer to current price action.
• RSI and its EMA filter: RSI measures momentum. Applying an EMA filter on RSI smooths out false spikes and confirms genuine overbought or oversold momentum.
• Dual Z‑Scores: computing Z‑Scores on both the distance between price and the composite MA, and on smoothed RSI, ensures that signals only fire when both price and momentum are unusually stretched.
• ATR bands: using ATR‑based shadow layers visualizes volatility around the MA, guiding traders on potential support and resistance zones.
At the end, these pieces merge into a single indicator that detects statistically significant mean reversions while staying adaptive to real‑time volatility and momentum.
Calculations
1. Compute ALMA over the chosen MA length, offset, and sigma.
2. Approximate ZLMA by applying EMA to twice the price minus the price shifted by the MA length.
3. Calculate the composite moving average as the average of ALMA and ZLMA.
4. Compute raw RSI and smooth it with ALMA. Apply an EMA filter to raw RSI to reduce noise.
5. For both price and smoothed RSI, calculate the mean and standard deviation over the Z‑Score lookback period.
6. Compute Z‑Scores:
• z_price = (current price − composite MA mean) / standard deviation of price deviations
• z_rsi = (smoothed RSI − mean RSI) / standard deviation of RSI
7. Determine reversal conditions: both Z‑Scores exceed their thresholds in the same direction, RSI EMA is in oversold/overbought zones (below 40 or above 60), and price movement confirms directionality.
8. Compute signal strength as the sum of the absolute Z‑Scores, then classify into weak, medium, or strong.
9. Calculate ATR over the chosen period and multiply by layer multipliers to form shadow widths.
10.Derive slope over the chosen slope length and color the MA line and bars based on direction, optionally smoothing color transitions via EMA on RGB channels.
How this indicator actually works
1. The script begins by smoothing price data with ALMA and approximating a zero‑lag EMA, then averaging them for the main MA.
2. RSI is calculated, then smoothed and filtered.
3. Using a rolling window, the script computes statistical measures for both price deviations and RSI.
4. Z‑Scores tell how far current values lie from their recent norms.
5. When both Z‑Scores cross configured thresholds and momentum conditions align, reversal signals are flagged.
6. Signals are drawn with size and color reflecting strength.
7. The MA is plotted with dynamic coloring; ATR shadows are layered beneath to show volatility envelopes.
8. Bars can be colored to match MA slope, reinforcing trend context.
9. Alert conditions allow automated notifications when signals occur.
Inputs
Main Length: Main MA Length. Sets the period for ALMA and ZLMA.
RSI Length: RSI Length. Determines the lookback for momentum calculations.
Z-Score Lookback: Z‑Score Lookback. Window for mean and standard deviation computations.
Price Z-Score Threshold: Price Z‑Score Threshold. Minimum deviation required for price.
RSI Z-Score threshold: RSI Z‑Score Threshold. Minimum deviation required for momentum.
RSI EMA Filter Length: RSI EMA Filter Length. Smooths raw RSI readings.
ALMA Offset: Controls ALMA’s focal point in the window.
ALMA Sigma: Adjusts ALMA’s smoothing strength.
Show Reversal Signals : Toggle to display reversal signal markers.
Slope Sensitivity: Length for slope calculation. Higher values smooth slope changes.
Use Bar Coloring: Enables coloring of price bars based on MA slope.
Show MA Shadow: Toggle for ATR‑based shadow bands.
Shadow Layer Count: Number of shadow layers (1–4).
Base Shadow ATR Multiplier: Multiplier for ATR when sizing the first band.
Smooth Color Transitions (boolean): Smooths RGB transitions for line and shadows, if enabled.
ATR Length for Shadow: ATR Period for computing volatility bands.
Use Dynamic Signal Size: Toggles dynamic scaling of reversal symbols.
Features
Moving average smoothing: a hybrid of ALMA and Zero‑Lag EMA that balances responsiveness and noise reduction.
Slope coloring: MA line and optionally price bars change color based on trend direction; color transitions can be smoothed for visual continuity.
ATR shadow layers: translucent bands around the MA show volatility envelopes; up to four concentric layers help gauge distance from normal price swings.
Dual Z‑Score filters: price and momentum must both deviate beyond thresholds to trigger signals, reducing false positives.
Dynamic signal sizing: reversal markers scale in size based on the combined Z‑Score magnitude, making stronger signals more prominent.
Adaptive visuals: optional smoothing of color channels creates gradient effects on lines and fills for a polished look.
Alert conditions: built‑in buy and sell alerts notify traders when reversal setups emerge.
Conclusion
Uptrick: Dynamic Z‑Score Deviation delivers a structured way to identify short‑term reversal opportunities by fusing statistical rigor with adaptive smoothing and clear visual cues. It guides traders through multiple confirmation layers—hybrid moving average, dual Z‑Score analysis, momentum filtering, and volatility envelopes—while keeping the chart clean and informative.
Disclaimer
This indicator is provided for informational and educational purposes only and does not constitute financial advice. Trading carries risk and may not be suitable for all participants. Past performance is not indicative of future results. Always do your own analysis and risk management before making trading decisions.
[blackcat] L2 Rhythm RiderOVERVIEW
The L2 Rhythm Rider is an advanced technical analysis tool meticulously crafted to assist traders in identifying intricate market rhythms and uncovering lucrative trading opportunities. By integrating sophisticated calculations such as weighted averages, deviations from Simple Moving Averages (SMAs), and bespoke oscillators, this indicator offers profound insights into market dynamics, momentum, and trend reversals. Whether you're a seasoned trader looking to refine your strategies or a novice seeking robust analytical tools, the Rhythm Rider provides a comprehensive suite of features tailored to enhance your decision-making process 📊✅.
FEATURES
Comprehensive Calculation Suite:
Percentage Deviation from SMA: Quantifies the deviation of the current price from the Simple Moving Average, providing a nuanced understanding of price behavior relative to historical trends.
Normalized Price Range: Standardizes price movements within a defined range, offering a clearer perspective on market volatility and stability.
Explore Line and Average: Utilizes Exponential Moving Averages (EMAs) to gauge market momentum, helping traders anticipate potential shifts in direction.
Banker Fund and Average: Evaluates market sentiment across varying timeframes, enabling traders to align their strategies with broader market trends.
RSI-Like Indicator: Delivers a Relative Strength Index-inspired metric that assesses the magnitude of price changes, akin to traditional RSI but with unique enhancements.
Bear Power: Analyzes selling pressure by examining recent highs and lows, providing valuable insights into bearish market conditions.
Enhanced Color Coding:
Overbought Conditions: Values exceeding 70 are emphasized with warm hues like red and orange, signaling potential overbought scenarios where caution is advised 🔥.
Oversold Conditions: Values falling below 60 are accentuated with cool tones such as blue and cyan, indicating oversold situations ripe for potential buying opportunities ❄️.
Adjusted Line Widths:
Improved Visibility: Line widths have been fine-tuned to ensure clear differentiation between various plotted elements, making it easier to interpret complex market data at a glance 👀.
Visual Representation:
Explore Line: Displayed in blue or red, depending on its value, to signify bullish or bearish momentum.
Banker Fund: Illustrated in orange or aqua, reflecting differing levels of market sentiment.
Bear Power: Depicted through purple columns, highlighting areas of significant selling pressure.
Trade Signals:
Buy ('B') and Sell ('S') Labels: Clearly marked on the chart to indicate optimal entry and exit points, facilitating swift and informed trading decisions 🏷️.
Automated Alerts:
Customizable Notifications: Generate alerts based on predefined conditions, ensuring traders never miss out on critical market movements 🔔.
HOW TO USE
Adding the Indicator:
Navigate to your TradingView chart and select the L2 Rhythm Rider from the indicators list.
Interpreting Visual Elements:
Familiarize yourself with the various plotted lines and columns, each representing distinct facets of market momentum and sentiment.
Monitoring Trade Opportunities:
Keep an eye on the chart for buy and sell labels, which signal potential trading opportunities based on the indicator's calculations.
Setting Up Alerts:
Configure alerts to notify you when specific conditions are met, allowing for timely action without constant chart monitoring 📲.
Combining Insights:
Integrate the information derived from all plotted elements to form a holistic view of the market, enhancing the reliability of your trading decisions.
LIMITATIONS
Market Volatility: In highly volatile or ranging markets, the indicator might produce false signals, necessitating additional confirmation from other analytical tools 🌪️.
Supplementary Analysis: For enhanced accuracy, users should complement this indicator with other forms of technical and fundamental analysis.
Asset and Timeframe Sensitivity: The performance of the indicator can fluctuate based on the asset type and chosen timeframe, requiring periodic adjustments and evaluations.
NOTES
Data Sufficiency: Ensure ample historical data is available to facilitate precise calculations and reliable results.
Demo Testing: Thoroughly test the indicator on demo accounts prior to deploying it in live trading environments to understand its nuances and limitations 🔍.
Personalization: Tailor the indicator’s settings and visual preferences to better suit individual trading styles and objectives.

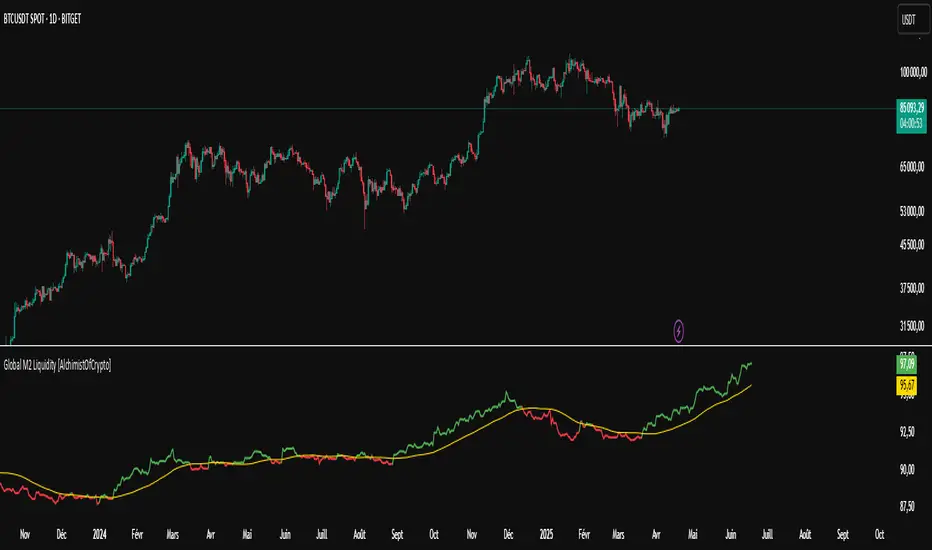
Global M2 Liquidity [TheAlchimist]🌍 Global M2 Liquidity – Navigating the Quantum Field of Markets 🌍
Category: Macroeconomic Indicators 📊
"In quantum physics, the observer effect states that the mere act of observation changes the system being observed. Similarly, in financial markets, global liquidity acts as a quantum field that permeates all market states simultaneously. Just as Heisenberg’s uncertainty principle suggests we cannot precisely measure both position and momentum, the M2 money supply’s influence on market dynamics creates a complex web of cause and effect across multiple timeframes."
📈 Overview
The Global M2 Liquidity indicator is a powerful tool that tracks the combined M2 money supply from five major economies (US, EU, China, Japan, UK), converted to USD 💵, offering a panoramic view of global liquidity conditions. With multi-timeframe analysis and a customizable forward-shift feature, it empowers traders to anticipate market movements driven by liquidity trends.
✨ Features
- Global Coverage 🌎: Monitors M2 money supply from 5 major economic regions (US, EU, China, Japan, UK).
- Real-Time Conversion 💱: Converts all data to USD for consistent analysis.
- Multi-Timeframe Analysis ⏰: Tracks liquidity from 15-minute to weekly charts.
- Forward-Shift Capability 🔮: Aligns M2 data with future price action for predictive insights.
- Color-Coded Trends 🎨: Visualizes liquidity trends (🟢 Expansion, 🔴 Contraction).
🚀 How to Use
1. Main Line 📉: Displays total global M2 liquidity in trillions of USD.
2. Golden Moving Average ⭐: Identifies the overall trend direction.
3. Trend Colors 🟢🔴:
- Green: Liquidity expanding above the moving average (bullish for risk assets).
- Red: Liquidity contracting below the moving average (bearish signal).
4. Forward Shift ⏩: Use the shift parameter to align M2 data with price action for predictive analysis.
5. Combine with Price Action 🔍: Correlate liquidity trends with assets like Bitcoin, stocks, or forex for strategic entries/exits.
⚙️ Settings
- MA Period 📏: Length of the moving average (default: 50).
- Shift ⏳: Number of days to shift data forward (default: 60).
🏷️ Tags
#Trading #Macroeconomic #M2Liquidity #GlobalLiquidity #MoneySupply #MultiTimeframe #TrendAnalysis #PredictiveAnalysis #Forex #Stocks #Crypto #Bitcoin #RiskAssets #CentralBanks #USD #TheAlchimist #QuantumTrading #AlgoTrading #DayTrading #SwingTrading
Rolling Beta against SPY📈 Pine Script Showcase: Rolling Beta Against SPY
Understanding how your favorite stock or ETF moves in relation to a benchmark like the S&P 500 can offer powerful insights into risk and exposure. This script calculates and visualizes the rolling beta of any asset versus the SPY ETF (which tracks the S&P 500).
🧠 What Is Beta?
Beta measures the sensitivity of an asset's returns to movements in the broader market. A beta of:
- 1.0 means the asset moves in lockstep with SPY,
- >1.0 indicates higher volatility than the market,
- <1.0 implies lower volatility or possible defensive behavior,
- <0 suggests inverse correlation (e.g., hedging instruments).
🧮 How It Works
This script computes rolling beta over a user-defined window (default = 60 periods) using classic linear regression math:
- Calculates daily returns for both the asset and SPY.
- Computes covariance between the two return streams.
- Divides by the variance of SPY returns to get beta.
⚙️ Customization
You can adjust the window size to control the smoothing:
- Shorter windows capture recent volatility changes,
- Longer windows give more stable, long-term estimates.
📊 Visual Output
The script plots the beta series dynamically, allowing you to observe how your asset’s correlation to SPY evolves over time. This is especially useful in regime-change environments or during major macroeconomic shifts.
💡 Use Cases
- Portfolio construction: Understand how your assets co-move with the market.
- Risk management: Detect when beta spikes—potentially signaling higher market sensitivity.
- Market timing: Use beta shifts to infer changing investor sentiment or market structure.
📌 Pro Tip: Combine this rolling beta with volatility, Sharpe ratio, or correlation tracking for a more robust factor-based analysis.
Ready to add a layer of quantitative insight to your chart? Add the script to your watchlist and start analyzing your favorite tickers against SPY today!

AllMA Trend Radar [trade_lexx]📈 AllMA Trend Radar is your universal trend analysis tool!
📊 What is AllMA Trend Radar?
AllMA Trend Radar is a powerful indicator that uses various types of Moving Averages (MA) to analyze trends and generate trading signals. The indicator allows you to choose from more than 30 different types of moving averages and adjust their parameters to suit your trading style.
💡 The main components of the indicator
📈 Fast and slow moving averages
The indicator uses two main lines:
- Fast MA (blue line): reacts faster to price changes
- Slow MA (red line): smoother, reflects a long-term trend
The combined use of fast and slow MA allows you to get trend confirmation and entry/exit points from the market.
🔄 Wide range of moving averages
There are more than 30 types of moving averages at your disposal:
- SMA: Simple moving average
- EMA: Exponential moving average
- WMA: Weighted moving average
- DEMA: double exponential MA
- TEMA: triple exponential MA
- HMA: Hull Moving Average
- LSMA: Moving average of least squares
- JMA: Eureka Moving Average
- ALMA: Arnaud Legoux Moving Average
- ZLEMA: moving average with zero delay
- And many others!
🔍 Indicator signals
1️⃣ Fast 🆚 Slow MA signals (intersection and ratio of fast and slow MA)
Up/Down signals (intersection)
- Buy (Up) signal:
- What happens: the fast MA crosses the slow MA from bottom to top
- What does the green triangle with the "Buy" label under the candle look
like - What does it mean: a likely upward trend reversal or an uptrend strengthening
- Sell signal (Down):
- What happens: the fast MA crosses the slow MA from top to bottom
- What does it look like: a red triangle with a "Sell" mark above the candle
- What does it mean: a likely downtrend reversal or an increase in the downtrend
Greater/Less signals (ratio)
- Buy signal (Greater):
- What happens: the fast MA becomes higher than the slow MA
- What does it look like: a green triangle with a "Buy" label under the candle
- What does it mean: the formation or confirmation of an uptrend
- Sell signal (Less):
- What happens: the fast MA becomes lower than the slow MA
- What does it look like: a red triangle with a "Sell" mark above the candle
- What does it mean: the formation or confirmation of a downtrend
2️⃣ Signals ⚡️ Fast MA (fast MA and price)
Up/Down signals (intersection)
- Buy signal (Up Fast):
- What happens: the price crosses the fast MA from bottom to top
- What does it look like: a green triangle with a "Buy" label under the candle
- What does it mean: a short-term price growth signal
- Sell signal (Down Fast):
- What happens: the price crosses the fast MA from top to bottom
- What does it look like: a red triangle with a "Sell" label above the candle
- What does it mean: a short-term price drop signal
Greater/Less signals (ratio)
- Buy signal (Greater Fast):
- What happens: the price is getting higher than the fast MA
- What does it look like: a green triangle with a "Buy" label under the candle
- What does it mean: the price is above the fast MA, which indicates an upward movement
- Sell signal (Less Fast):
- What happens: the price is getting lower than the fast MA
- What does it look like: a red triangle with a "Sell" mark above the candle
- What does it mean: the price is under the fast MA, which indicates a downward movement
3️⃣ Signals 🐢 Slow MA (slow MA and price)
Up/Down signals (intersection)
- Buy signal (Up Slow):
- What happens: the price crosses the slow MA from bottom to top
- What does it look like: a green triangle with a "Buy" label under the candle
- What does it mean: a potential medium-term upward trend reversal
- Sell signal (Down Slow):
- What happens: the price crosses the slow MA from top to bottom
- What does it look like: a red triangle with a "Sell" label above the candle
- What does it mean: a potential medium-term downward trend reversal
Greater/Less signals (ratio)
- Buy signal (Greater Slow):
- What happens: the price is getting above the slow MA
- What does it look like: a green triangle with a "Buy" label under the candle
- What does it mean: the price is above the slow MA, which indicates a strong upward movement
- Sell signal (Less Slow):
- What is happening: the price is getting below the slow MA
- What does it look like: a red triangle with a "Sell" mark above the candle
- What does it mean: the price is under the slow MA, which indicates a strong downward movement
🛠 Filters to filter out false signals
1️⃣ Minimum distance between the signals
- What it does: sets the minimum number of candles between signals of the same type
- Why it is needed: it prevents the appearance of too frequent signals, especially during periods of high volatility
- How to set it up: Set a different value for each signal type (default: 3-5 bars)
- Example: if the value is 3 for Up/Down signals, after the buy signal appears, the next buy signal may appear no earlier than 3 bars later
2️⃣ Advanced indicator filters
🔍 RSI Filter
- What it does: Checks the Relative Strength Index (RSI) value before generating a signal
- Why it is needed: it helps to avoid countertrend entries and catch reversal points
- How to set up:
- For buy signals (🔋 Buy): set the RSI range, usually in the oversold zone (for example, 1-30)
- For sell signals (🪫 Sell): set the RSI range, usually in the overbought zone (for example, 70-100)
- Example: if the RSI = 25 (in the range 1-30), the buy signal will be confirmed
📊 MFI Filter (Cash Flow Index)
- What it does: analyzes volumes and the direction of price movement
- Why it is needed: confirms signals with data on the activity of cash flows
- How to set up:
- For buy signals (🔋 Buy): set the MFI range in the oversold zone (for example, 1-25)
- For sell signals (🪫 Sell): set the MFI range in the overbought zone (for example, 75-100)
- Example: if MFI = 80 (in the range of 75-100), the sell signal will be confirmed
📈 Stochastic Filter
- What it does: analyzes the position of the current price relative to the price range
- Why it is needed: confirms signals based on overbought/oversold conditions
- How to configure:
- You can configure the K Length, D Length and Smoothing parameters
- For buy signals (🔋 Buy): set the stochastic range in the oversold zone (for example, 1-20)
- For sell signals (🪫 Sell): set the stochastic range in the overbought zone (for example, 80-100)
- Example: if stochastic = 15 (is in the range of 1-20), the buy signal will be confirmed
🔌 Connecting to trading strategies
The indicator provides various connectors to connect to your trading strategies.:
1️⃣ Individual connectors for each type of signal
- 🔌Fast vs Slow Up/Down MA Signal🔌: signals for the intersection of fast and slow MA
- 🔌Fast vs Slow Greater/Less MA Signal🔌: signals of the ratio of fast and slow MA
- 🔌Fast Up/Down MA Signal🔌: signals of the intersection of price and fast MA
- 🔌Fast Greater/Less MA Signal🔌: signals of the ratio of price and fast MA
- 🔌Slow Up/Down MA Signal🔌: signals of the intersection of price and slow MA
- 🔌Slow Greater/Less MA Signal🔌: Price versus slow MA signals
2️⃣ Combined connectors
- 🔌Combined Up/Down MA Signal🔌: combines all the crossing signals (Up/Down)
- 🔌Combined Greater/Less MA Signal🔌: combines all the signals of the ratio (Greater/Less)
- 🔌Combined All MA Signals🔌: combines all signals (Up/Down and Greater/Less)
❗️ All connectors return values:
- 1: buy signal
- -1: sell signal
- 0: no signal
📚 How to start using AllMA Trend Radar
1️⃣ Selection of types of moving averages
- Add an indicator to the chart
- Select the type and period for the fast MA (default: DEMA with a period of 14)
- Select the type and period for the slow MA (default: SMA with a period of 14)
- Experiment with different types of MA to find the best combination for your trading style
2️⃣ Signal settings
- Turn on the desired signal types (Up/Down, Greater/Less)
- Set the minimum distance between the signals
- Activate and configure the necessary filters (RSI, MFI, Stochastic)
3️⃣ Checking on historical data
- Analyze how the indicator works based on historical data
- Pay attention to the accuracy of the signals and the presence of false alarms
- Adjust the settings if necessary
4️⃣ Introduction to the trading strategy
- Decide which signals will be used to enter the position.
- Determine which signals will be used to exit the position.
- Connect the indicator to your trading strategy through the appropriate connectors
🌟 Practical application examples
Scalping strategy
- Fast MA: TEMA with a period of 8
- Slow MA: EMA with a period of 21
- Active signals: Fast MA Up/Down
- Filters: RSI (range 1-40 for purchases, 60-100 for sales)
- Signal spacing: 3 bars
Strategy for day trading
- Fast MA: TEMA with a period of 10
- Slow MA: SMA with a period of 20
- Active signals: Fast MA Up/Down and Fast vs Slow Greater/Less
- Filters: MFI (range 1-25 for purchases, 75-100 for sales)
- Signal spacing: 5 bars
Swing Trading Strategy
- Fast MA: DEMA with a period of 14
- Slow MA: VWMA with a period of 30
- Active signals: Fast vs Slow Up/Down and Slow MA Greater/Less
- Filters: Stochastic (range 1-20 for purchases, 80-100 for sales)
- Signal spacing: 8 bars
A strategy for positional trading
- Fast MA: HMA with a period of 21
- Slow MA: SMA with a period of 50
- Active signals: Slow MA Up/Down and Fast vs Slow Greater/Less
- Filters: RSI and MFI at the same time
- The distance between the signals: 10 bars
💡 Tips for using AllMA Trend Radar
1. Select the types of MA for market conditions:
- For trending markets: DEMA, TEMA, HMA (fast MA)
- For sideways markets: SMA, WMA, VWMA (smoothed MA)
- For volatile markets: KAMA, AMA, VAMA (adaptive MA)
2. Combine different types of signals:
- Up/Down signals work better when moving from a sideways trend to a directional
one - Greater/Less signals are optimal for fixing a stable trend
3. Use filters effectively:
- The RSI filter works great in trending markets
- MFI filter helps to confirm the strength of volume movement
- Stochastic filter works well in lateral ranges
4. Adjust the minimum distance between the signals:
- Small values (2-3 bars) for short-term trading
- Average values (5-8 bars) for medium-term trading
- Large values (10+ bars) for long-term trading
5. Use combination connectors:
- For more reliable signals, connect the indicator through the combined connectors
💰 With the AllMA Trend Radar indicator, you get a universal trend analysis tool that can be customized for any trading style and timeframe. The combination of different types of moving averages and advanced filters allows you to significantly improve the accuracy of signals and the effectiveness of your trading strategy!

[blackcat] L2 Ehlers Autocorrelation Indicator V2OVERVIEW
The Ehlers Autocorrelation Indicator is a technical analysis tool developed by John F. Ehlers that measures the correlation between price data and its lagged versions to identify potential market cycles and reversals.
BACKGROUND
Originally introduced in Ehlers' "Cycle Analytics for Traders" (2013), this indicator leverages autocorrelation principles to detect patterns in market data that deviate from random noise or perfect sine waves.
FEATURES
• Calculates Pearson correlation coefficients for lags from 0 to 60 bars
• Visualizes correlations using colored bars ranging from red (negative correlation) to yellow (positive correlation)
• Provides minimum averaging option through AvgLength input parameter
• Displays sharp reversal signals at price turning points
• Shows variations in bar thickness and count over time
HOW TO USE
Add the indicator to your chart
Adjust the AvgLength input as needed:
• Set to 0 for no averaging
• Increase value for smoother results
Interpret the colored bars:
• Red: Negative correlation
• Yellow: Positive correlation
• Sharp transitions indicate potential reversal points
LIMITATIONS
• Requires sufficient historical data for accurate calculations
• Performance may vary across different market conditions
• Results depend on proper parameter settings
NOTES
• The indicator uses highpass filtering and super smoother filtering techniques
• Color intensity varies based on correlation strength
• Multiple lag periods are displayed simultaneously for comprehensive analysis
THANKS
This implementation is based on Ehlers' original work and has been adapted for TradingView's Pine Script platform.

ES1! vs ZB1! Exponentially Weighted CorrelationES1! vs ZB1! Exponentially Weighted Correlation
This indicator calculates and visualizes the exponentially weighted correlation between the S&P 500 E-mini futures (ES1!) and the 30-Year U.S. Treasury Bond futures (ZB1!) over a user-defined lookback period. By using an exponential moving average (EMA) approach, it emphasizes recent price movements, providing a dynamic view of the relationship between these two key financial instruments.
Features:
- Customizable Inputs: Adjust the lookback length (default: 60) and alpha (default: 0.1) to fine-tune the sensitivity of the correlation calculation.
- Exponentially Weighted Correlation: Measures the strength and direction of the relationship between ES1! and ZB1! prices, with more weight given to recent data.
- Visual Clarity: Displays correlation as colored bars (green for positive, red for negative) for quick interpretation, with reference lines at 0, +1, and -1 for context.
- Non-Overlay Design: Plotted in a separate panel below the chart to avoid cluttering price data.
How It Works:
The indicator fetches closing prices for ES1! and ZB1!, applies an EMA to smooth the data, and computes the exponentially weighted covariance and variances. The correlation is then derived and plotted as a histogram, helping traders identify whether the two markets are moving together (positive correlation), in opposite directions (negative correlation), or independently.
Use Cases:
- Market Analysis: Gauge the relationship between equity and bond markets to inform trading strategies.
- Risk Management: Monitor correlation shifts to adjust portfolio exposure.
- Intermarket Insights: Identify trends or divergences in the stock-bond dynamic for macroeconomic analysis.
Ideal for traders and analysts tracking intermarket relationships, this indicator offers a clear, responsive tool for understanding ES1! and ZB1! correlation in real-time.

RSI + MA + Divergence + SnR + Price levelOverview
This indicator combines several technical analysis tools to give traders a comprehensive view based on the RSI indicator. Its main features include:
RSI & Moving Averages on RSI:
RSI: Calculates the RSI based on the closing price (or a user-selected source) with a configurable period (default is 14).
EMA and WMA: Computes and plots an Exponential Moving Average (EMA with a period of 9) and a Weighted Moving Average (WMA with a period of 45) on the RSI, helping to smooth out signals and better identify trends.
Price Ladder Based on RSI:
Draws horizontal lines at specified target RSI levels (from targetRSI1 to targetRSI7, default levels ranging from 20 to 80).
Calculates a target price based on the price change relative to the averaged gains and losses, providing an estimated price level when the RSI reaches those critical levels.
Divergence Detection:
Identifies divergence between price and RSI:
Bullish Divergence: Detected when the price forms a lower low but RSI fails to confirm with a corresponding lower low, with the RSI falling under a configurable threshold (d_below).
Bearish Divergence: Detected when the price forms a higher high while the RSI does not, with the RSI exceeding a configurable upper threshold (d_upper).
Optionally displays labels on the chart to alert the trader when divergence signals are detected.
Auto Support & Resistance on RSI:
Automatically calculates and plots support and resistance lines based on the RSI over different lookback periods (e.g., 34, 89, 200 bars).
Helps traders identify key RSI levels where price reversals or breakouts might occur.
Benefits for the Trader
This indicator is designed to assist traders in their decision-making process by integrating multiple technical analysis elements:
Identifying Market Trends:
By combining the RSI with its moving averages (EMA, WMA), traders can better assess market trends and the strength of these trends, thereby improving trade entry accuracy.
Early Reversal Signals via Divergence:
Divergence signals (both bullish and bearish) can help forecast potential reversals in the market, allowing traders to adjust their strategies timely.
Determining RSI-Based Support/Resistance Levels:
Automatic identification of support and resistance levels on the RSI provides key areas where a price reversal or breakout may occur, assisting traders in setting stop-loss and take-profit levels strategically.
Price Target Forecasting with the Price Ladder:
The target price labels calculated at important RSI levels provide insights into potential price objectives, aiding in risk management and profit planning.
Flexible Configuration:
Traders can customize key parameters such as the RSI period, lengths for EMA and WMA, target RSI levels, divergence conditions, and support/resistance settings. This flexibility allows the indicator to adapt to different trading styles and strategies.
How to read data
Some use-cases
Used to estimate price according to the RSI level.
When you trade using RSI, you want to set your stop-loss or take-profit levels based on RSI. By looking at the price ladder, you know the corresponding price level to enter a trade.
Used to determine the entry zone.
RSI often reacts to its own previously established support/resistance levels. Use the Auto SnR feature to identify those zones.
Used to determine the trend.
RSI and its moving averages help identify the price trend:
Uptrend: 3 lines separate and point upward.
Downtrend: 3 lines separate and point downward.
Use WMA45 to determine the trend:
Uptrend: WMA45 is moving upward or trading above the 50 level.
Downtrend: WMA45 is moving downward or trading below the 50 level.
Sideways: WMA45 is trading around the 50 level.
Use EMA9 to confirm the trend: A crossover of EMA9 through WMA45 confirms the formation of a new trend.
Configuration
The script allows users to configure a number of important parameters to suit their analytical preferences:
RSI Settings:
RSI Length (rsiLengthInput): The number of periods used to compute the RSI (default is 14, adjustable as needed).
RSI Source (rsiSourceInput): Select the price source (default is the closing price).
RSI Color (rsiClr): The color used to display the RSI line.
Moving Averages on RSI:
EMA Length (emaLength): The period for calculating the EMA on RSI (default is 9).
WMA Length (wmaLength): The period for calculating the WMA on RSI (default is 45).
EMA Color (emaClr) and WMA Color (wmaClr): Customize the colors of the EMA and WMA lines.
Price Ladder Settings:
Toggle Price Ladder (showPrice): Enable or disable the display of the price ladder.
Target RSI Levels: targetRSI1 through targetRSI7: RSI values at which target prices are calculated (default values range from 20, 30, 40, 50, 60, 70 to 80).
Price Label Color (priceColor): The text color for displaying the target price labels.
Divergence Settings:
Divergence Toggle (calculateDivergence): Option to enable or disable divergence calculation and display.
Divergence Conditions:
d_below: RSI level below which bullish divergence is considered.
d_upper: RSI level above which bearish divergence is considered.
Display Divergence Labels (showDivergenceLabel): Option to display labels on the chart when divergence is detected.
Auto Support & Resistance on RSI:
Toggle Auto S&R (enableAutoSnR): Enable or disable automatic plotting of support and resistance levels.
Lookback Periods for Support/Resistance:
L1_lookback: Lookback period for level 1 (e.g., 34 bars).
L2_lookback: Lookback period for level 2 (e.g., 89 bars).
L3_lookback: Lookback period for level 3 (e.g., 200 bars).
Support and Resistance Colors:
rsiSupportClr: Color for the support line.
rsiResistanceClr: Color for the resistance line.
Alerts:
Divergence Alerts: Alert conditions are set up to notify the trader when bullish or bearish divergence is detected, aiding in timely decision-making.

Bull Bear Pivot by RawstocksThe "Bull Bear Pivot" indicator is a custom Pine Script (v5) tool designed for TradingView to assist traders in identifying key price levels and pivot points on intraday charts (up to 1-hour timeframes). It combines time-based open price markers, pivot high/low detection, and candlestick visualization to provide a comprehensive view of potential support, resistance, and trend reversal levels. Below is a detailed description of the indicator’s functionality, features, and intended use.
Indicator Overview:
The "Bull Bear Pivot" indicator is tailored for intraday trading, focusing on specific times of the day to mark significant price levels (open prices) and detect pivot points. It plots horizontal lines at the open prices of user-defined sessions, identifies pivot highs and lows on the current chart timeframe, and overlays custom candlesticks to highlight price action. The indicator is designed to work on timeframes of 1 hour or less (e.g., 1-minute, 3-minute, 5-minute, 15-minute, 30-minute, 60-minute) and includes a warning mechanism for invalid timeframes.
Key Features:
Time-Based Open Price Markers:
The indicator allows users to define up to five time-based sessions (e.g., 4:00 AM, 8:30 AM, 9:30 AM, 10:00 AM, and a custom time) to capture the open price at the start of each session.
For each session, it plots a horizontal line at the 1-minute open price, extending from the session start to the market close at 4:00 PM EST.
Each line is accompanied by a label positioned 5 bars to the right of the market close (4:00 PM EST), with the text right-aligned and vertically centered on the line.
Users can enable/disable each marker, customize the session time, label text, line color, and text color via the indicator’s settings.
Pivot Highs and Lows:
The indicator calculates pivot highs and lows on the current chart timeframe using the ta.pivothigh and ta.pivotlow functions.
Pivot highs are marked with green triangles above the bars, and pivot lows are marked with red triangles below the bars.
The pivot period (lookback/lookforward) is user-configurable, allowing flexibility in detecting short-term or longer-term reversals.
Custom Candlesticks:
The indicator overlays custom candlesticks on the chart, colored green for bullish candles (close > open) and red for bearish candles (close < open).
This feature helps visualize price action alongside the open price markers and pivot points.
Timeframe Restriction:
The indicator is designed to work on timeframes of 1 hour or less. If the chart timeframe exceeds 1 hour (e.g., 4-hour, daily), a warning label ("Timeframe > 1H\nIndicator Disabled") is displayed, and no elements are plotted.
Customizable Appearance:
Users can customize the appearance of the open price marker lines, including the line style (solid, dashed, dotted) and line width.
Labels for the open price markers have no background (transparent) and use customizable text colors.

Boosted Scalp Sniper🚀 Boosted Scalp Sniper | EMA, RSI & Volume Combination 🚀
An effective indicator designed for traders who want to execute fast and aggressive scalp trades!
Features:
EMA Cross (2 and 5 periods): Captures ultra-fast trend reversals using short-term EMA crossovers.
Dynamic RSI (7 period, 40-60 range): Confirms the strength and direction of momentum.
Volume Filter: Ensures more reliable trade signals by requiring volume to be above the 10-bar average.
How to Use:
A Buy (▲) signal indicates a potential short-term upward opportunity.
A Sell (▼) signal indicates a potential short-term downward opportunity.
You can test this indicator across different timeframes (1D, 1H, 15M, 5M, etc.) and optimize it to suit your trading style.
Important Notes:
This indicator provides visual entry signals only; apply your own risk management strategy.
Always use a stop-loss in your real trades to protect capital.
Good luck and happy trading! 📈

ICT & SMC Multi-Timeframe by [KhedrFX]Transform your trading experience with the ICT & SMC Multi-Timeframe by indicator. This innovative tool is designed for traders who want to harness the power of multi-timeframe analysis, enabling them to make informed trading decisions based on key market insights. By integrating concepts from the Inner Circle Trader (ICT) and Smart Money Concepts (SMC), this indicator provides a comprehensive view of market dynamics, helping you identify potential trading opportunities with precision.
Key Features
- Multi-Timeframe Analysis: Effortlessly switch between various timeframes (5 minutes, 15 minutes, 30 minutes, 1 hour, 4 hours, daily, and weekly) to capture the full spectrum of market movements.
- High and Low Levels: Automatically calculates and displays the highest and lowest price levels over the last 20 bars, highlighting critical support and resistance zones.
- Market Structure Visualization: Identifies the last swing high and swing low, allowing you to recognize current market trends and potential reversal points.
- Order Block Detection: Detects significant order blocks, pinpointing areas of strong buying or selling pressure that can indicate potential market reversals.
- Custom Alerts: Set alerts for when the price crosses above or below identified order block levels, enabling you to act swiftly on trading opportunities.
How to Use the Indicator
1. Add the Indicator to Your Chart
- Open TradingView.
- Click on the "Indicators" button at the top of the screen.
- Search for "ICT & SMC Multi-Timeframe by " in the search bar.
- Click on the indicator to add it to your chart.
2. Select Your Timeframe
- Use the dropdown menu to choose your preferred timeframe (5, 15, 30, 60, 240, D, W) for analysis.
3. Interpret the Signals
- High Level (Green Line): Represents the highest price level over the last 20 bars, acting as a potential resistance level.
- Low Level (Red Line): Represents the lowest price level over the last 20 bars, acting as a potential support level.
- Last Swing High (Blue Cross): Indicates the most recent significant high, useful for identifying potential reversal points.
- Last Swing Low (Orange Cross): Indicates the most recent significant low, providing insight into market structure.
- Order Block High (Purple Line): Marks the upper boundary of a detected order block, suggesting potential selling pressure.
- Order Block Low (Yellow Line): Marks the lower boundary of a detected order block, indicating potential buying pressure.
4. Set Alerts
- Utilize the alert conditions to receive notifications when the price crosses above or below the order block levels, allowing you to stay informed about potential trading opportunities.
5. Implement Risk Management
- Always use proper risk management techniques. Consider setting stop-loss orders based on the identified swing highs and lows or the order block levels to protect your capital.
Conclusion
The ICT & SMC Multi-Timeframe by indicator is an essential tool for traders looking to enhance their market analysis and decision-making process. By leveraging multi-timeframe insights, market structure visualization, and order block detection, you can navigate the complexities of the market with confidence. Start using this powerful indicator today and take your trading to the next level.
⚠️ Trade Responsibly
This tool helps you analyze the market, but it’s not a guarantee of profits. Always do your own research, manage risk, and trade with caution.

RSI SiaThis script is a custom indicator for TradingView written in Pine Script version 5. It calculates the Relative Strength Index (RSI) and uses it to generate trading signals. Here's a breakdown of what the script does:
Key Features:
RSI Calculation:
The script calculates the RSI using a 14-period window.
It also calculates the momentum of the RSI over a 9-period window (rsi delta) and a simple moving average (SMA) of the RSI over a 3-period window (rsi sma).
Composite Index (CI):
The composite index is calculated as the sum of rsi delta and rsi sma.
Horizontal Lines and Zones:
Several horizontal lines are plotted at different levels (e.g., 20, 40, 60, 80, 120, 150, 180) to indicate overbought and oversold conditions.
Filled zones are created between certain levels to highlight areas of interest.
Moving Averages:
The script plots SMA and EMA of the RSI when Enable RSI ma is set to true.
It also plots moving averages of the composite index.
Crossover Signals:
The script detects bullish and bearish crossovers between the SMA and EMA of the RSI.
It plots shapes (labels) on the chart to indicate buy (BUY) and sell (SELL) signals based on these crossovers.
Usage:
Enable RSIma: This input allows you to enable or disable the plotting of RSI moving averages.
i1: This variable is used to adjust the vertical position of the composite index and its moving averages.
Visualization:
The RSI is plotted in black.
The RSI fast trigger line (SMA of RSI) is plotted in green when enabled.
The RSI slow trigger line (EMA of RSI) is plotted in orange when enabled.
The composite index and its moving averages are plotted in red, green, and orange.
Buy and sell signals are indicated with green and red labels, respectively.
This script can be used to identify potential trading opportunities based on RSI crossovers and the composite index.

Intraday Macro & Flow Indicator# IntraMacroFlow Indicator
## Introduction
IntraMacroFlow is a volume and delta-based indicator that identifies significant price movements within trading sessions. It generates signals when volume spikes coincide with quality price movement, filtered by RSI to avoid overbought/oversold conditions.
> **Note:** This indicator provides multiple signals and should be combined with additional analysis methods such as support/resistance, trend direction, and price action patterns.
## Inputs
### Volume Settings
* **Volume Lookback Period** (14) - Number of bars for volume moving average calculation
* **Volume Threshold Multiplier** (1.5) - Required volume increase over average to generate signals
* **Delta Threshold** (0.3) - Required close-to-open movement relative to bar range (higher = stronger movement)
### Session Configuration
* **Use Dynamic Session Detection** (true) - Automatically determine session times
* **Highlight Market Open Period** (true) - Highlight first third of trading session
* **Highlight Mid-Session Period** (true) - Highlight middle portion of trading session
* **Detect Signals Throughout Whole Session** (true) - Find signals in entire session
* **Session Time** ("0930-1600") - Trading hours in HHMM-HHMM format
* **Session Type** ("Regular") - Select Regular, Extended, or Custom session
### Manual Session Settings
Used when dynamic detection is disabled:
* **Manual Session Open Hour** (9)
* **Manual Session Open Minute** (30)
* **Manual Session Open Duration** (60)
* **Manual Mid-Session Start Hour** (12)
* **Manual Mid-Session End Hour** (14)
## How It Works
The indicator analyzes each bar using three primary conditions:
1. **Volume Condition**: Current volume > Average volume × Threshold
2. **Delta Condition**: |Close-Open|/Range > Delta threshold
3. **Time Condition**: Bar falls within configured session times
When all conditions are met:
* Bullish signals appear when close > open and RSI < 70
* Bearish signals appear when close < open and RSI > 30
## Display Elements
### Shapes and Colors
* Green triangles below bars - Bullish signals
* Red triangles above bars - Bearish signals
* Blue background - Market open period
* Purple background - Mid-session period
* Bar coloring - Green (bullish), Red (bearish), or unchanged
### Information Panel
A dynamic label shows:
* Current volume relative to average (Vol)
* Delta value for current bar (Delta)
* RSI value (RSI)
* Session status (Active/Closed)
## Calculation Method
```
// Volume Condition
volumeMA = ta.sma(volume, lookbackPeriod)
volumeCondition = volume > volumeMA * volumeThreshold
// Delta Calculation (price movement quality)
priceRange = high - low
delta = math.abs(close - open) / priceRange
deltaCondition = delta > deltaThreshold
// Direction and RSI Filter
bullishBias = close > open and entrySignal and not (rsi > 70)
bearishBias = close < open and entrySignal and not (rsi < 30)
```
## Usage Recommendations
### Suitable Markets
* Equities during regular trading hours
* Futures markets
* Forex during active sessions
* Cryptocurrencies with defined volume patterns
### Recommended Timeframes
* 1-minute to 1-hour (optimal: 5 or 15-minute)
### Parameter Adjustments
* For fewer but stronger signals: increase Volume Threshold (2.0+) and Delta Threshold (0.4-0.6)
* For more signals: decrease Volume Threshold (1.2-1.5) and Delta Threshold (0.2-0.3)
### Usage Tips
* Combine with trend analysis for higher-probability entries
* Focus on signals occurring at session boundaries and mid-session
* Use opposite signals as potential exit points
* Configure alerts to receive notifications when signals occur
## Additional Notes
* RSI parameters are fixed at 14 periods with 70/30 thresholds
* The indicator handles overnight sessions correctly
* Fully compatible with TradingView alerts
* Customizable visual elements
## Release Notes
Initial release: This is a template indicator that should be customized to suit your specific trading strategies and preferences.

zone trading stratThis only works for DOGEUSD , I made it for the 8cap chart so only use it for that.
If you want this for other symbols/charts you need to comment below or msg me.
# Price Zone Trading System: Technical Explanation
## Core Concept
The Price Zone Tracker is built on the concept that price tends to respect certain key levels or "zones" on the chart. These zones act as support and resistance areas where price may bounce or break through. The system combines zone analysis with multiple technical indicators to generate high-probability trading signals.
## Zone Analysis
The system tracks 9 predefined price zones. Each zone has both a high and low boundary, except for Zone 5 which is represented by a single line. When price enters a zone, the system monitors whether it stays within the zone, breaks above it (bullish), or breaks below it (bearish).
This zone behavior establishes the foundational bias of the system:
- When price closes above its previous zone: Zone State = Bullish
- When price closes below its previous zone: Zone State = Bearish
- When price remains within a zone: Zone State = Neutral
## Trend Analysis Components
The system performs multi-timeframe analysis using several technical components:
1. **Higher Timeframe Analysis** (±3 points in scoring)
- Uses 15-minute charts for sub-5-minute timeframes
- Uses 30-minute charts for 5-minute timeframes
- Uses 60-minute charts for timeframes above 5 minutes
- Evaluates candlestick patterns and EMA crossovers on the higher timeframe
2. **EMA Direction** (±1 point in scoring)
- Compares 12-period and 26-period EMAs
- Bullish when fast EMA > slow EMA
- Bearish when fast EMA < slow EMA
3. **MACD Analysis** (±1 point in scoring)
- Uses standard 12/26/9 MACD settings
- Bullish when MACD line crosses above signal line with positive histogram
- Bearish when MACD line crosses below signal line with negative histogram
4. **Price Action** (±2 points in scoring)
- Evaluates whether price is making higher highs/higher lows (uptrend)
- Or lower highs/lower lows (downtrend)
- Also considers ATR-based volatility and strength of movements
## Trend Score Calculation
All these components are weighted and combined into a trend score:
- Higher timeframe components have stronger weights (±2-3 points)
- Current timeframe components have moderate weights (±1 point)
- Price action components have varied weights (±0.5-2 points)
The final trend state is determined by thresholds:
- Score > +3: Trend Analysis State = Bullish
- Score < -3: Trend Analysis State = Bearish
- Score between -3 and +3: Trend Analysis State = Neutral
## Signal Generation Logic
The system combines the Zone State with the Trend Analysis State:
1. If Zone State and Trend Analysis State are both bullish:
- Combined State = Bullish
- Line Color = Green
2. If Zone State and Trend Analysis State are both bearish:
- Combined State = Bearish
- Line Color = Red
3. If Zone State and Trend Analysis State contradict each other:
- Combined State = Neutral
- Line Color = Black
This implements a safety mechanism requiring both zone analysis and technical indicators to agree before generating a directional signal.
## Trading Signals
Trading signals are generated based on changes in the Combined State:
- When Combined State changes from neutral/bearish to bullish:
- Trading Signal = LONG (green triangle appears on chart)
- When Combined State changes from neutral/bullish to bearish:
- Trading Signal = SHORT (red triangle appears on chart)
- When Combined State changes from bullish/bearish to neutral:
- Trading Signal = EXIT (yellow X appears on chart)
- When Combined State remains unchanged:
- Trading Signal = NONE (no new marker appears)
## Reversal Warning
The system also monitors for potential reversal conditions:
- When Combined State is bullish but both RSI and MFI are overbought (>70)
- When Combined State is bearish but both RSI and MFI are oversold (<30)
In these cases, a yellow diamond appears on the chart as a warning that a reversal might be imminent.
## Visual Elements
The indicator provides multiple visual elements:
1. Zone boundaries as translucent orange areas
2. A single colored line below price (green/red/black) showing the current signal
3. Trading signals as shapes on the chart
4. An information panel showing all relevant indicator values and signals
## Usage Limitations
The indicator is designed to work optimally on timeframes below 30 minutes. On higher timeframes, a warning appears and analysis is disabled.

ZRK 30m This TradingView indicator draws alternating 30-minute boxes aligned precisely to real clock times (e.g., 10:00, 10:30, 11:00), helping traders visually segment intraday price action. It highlights every other 30-minute block with customizable colors, line styles, and opacity, allowing users to clearly differentiate between trading intervals. The boxes automatically adjust based on the chart’s timeframe, maintaining accuracy on 1-minute to 60-minute charts. Optional time labels can also be displayed for additional context. This tool is useful for identifying patterns, measuring volatility, or applying breakout strategies based on defined, consistent time windows across global trading sessions.
