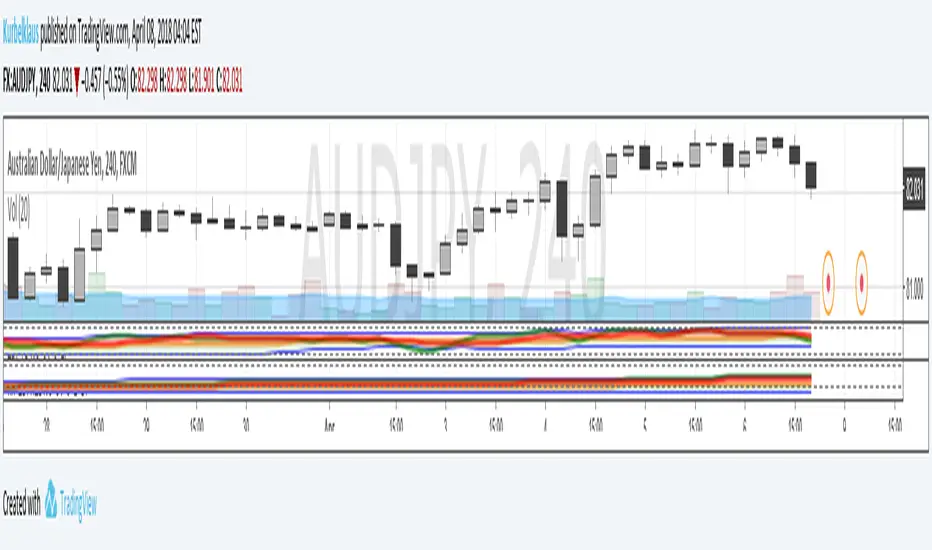
VolumezonesSo how to use this indicator?
This indicator is based on WMA (black color line) and Volume RSI (blue color line)
There are 3 volume zones based on WMA
1. when it lowest seen in yellow color
2.when highest seen in red color
3. gray color when it not highest or lowest
so how to enter trade:
option 1: the volume went to lowest (yellow ) , so the seller power will be going down by time.. now look on Vrsi if it start to go up and the color change to gray.. then it will be good entry as we expect rise in volume and rise in price
option 2. cross over of WMA above 20 or cross over of VRSI above 30 in the gray area are good buy points
option 3 more danger but in bullish market can work is when WMA cross above 60
sell option:
1. when we enter the red zones (WMA at its peak) , so buyer power go down.. now look on vrsi if it fall and it become gray again exit trade
you can go back to it using option 3 if market is bullish and both vrsi and WMA are going up again
2. lets say you enter by option 1 to trade but force of buyers is weak then the WMA will go down (let say 20 ) and vrsi is going down then escape trade.. the buyers not holding and the sellers are stronger
the code is open so you can add alerts of buy and sell by your own. Also you can add to it other indicators making it much better
have f
在腳本中搜尋"股价站上60月线"

Donchian Channel with Range AdditionA Donchian Channel with additional zones at places where its range is smaller than a set amount of atr. Thus it kind of combines with Keltner Channel qualities. Purpose is to set a stop loss wide enough to avoid shaking out of a position. The example chart shows a Philips day chart, where I opened position on 16 juli at 37,50 and set the stop loss at low border level 35,60, on 23 juli was an earnings rapport, the wick of the candle shows that quotes went very low, obviously smart traders had to fill a huge order and hunted for stops, triggering my stop closing the position. next days quotes went a lot better, so I missed the fun. The Donchian Channel was too narrow because quotes had ranged in the previous weeks. If I had placed my stop on the additional low, setting it 5 atr below the high border, my stop would have been safe.

tvial/rsiSimple RSI indicator including:
- 40 & 60 support/resistance
- visual marker (orange bgcolor) on RSI length limit to spot actual RSI divergences
- simple layout

MY_DXY (inverted)Plots the DXY in negative value (inverted), in overlay mode, so one can guess when price in dollars will rise following it.
Default resolution is 60 mins, can be selected as input via the * symbol.
Works with every ticker, GC/SI/PL etc

MY_DXY corrected pricePlots the current ticker's price in "DXY corrected dollar". Overlay mode.
Default resolution is 60 mins, can be modified by input (*)
Works with every ticker: GC/SI/XAUUSD etc

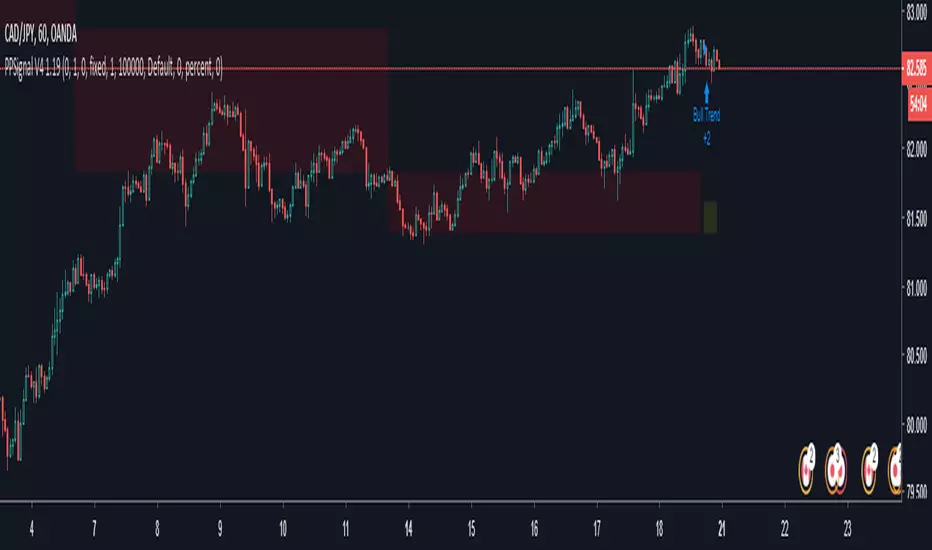
PPSignal V4 (Auto Adaptive Times)We have ppsignal system for the next period.
// D: 1min to 15 min
// W: 60-120 - 180 - 240 - D
Quatro Storch Relative Strength IndexDisplays current stoch rsi along with 5 15 30 60 240 time frames

PT - EMA/SMA Spread AND Combination with MultipleTimeFrameYou can now combine multiple timeframe EMA/SMA as in profit trailer and see which areas will be then used for PT if you for example use a 15 minute EMASpread and 60 minute Spread.
- From what i can see the lowes the timeframe the faster it reacts but a lot of times you will get stuck with a bag due to a coin having 2 drops. Thiw might help you find a sweetspot so that you can picky only the high reward low risk trades.

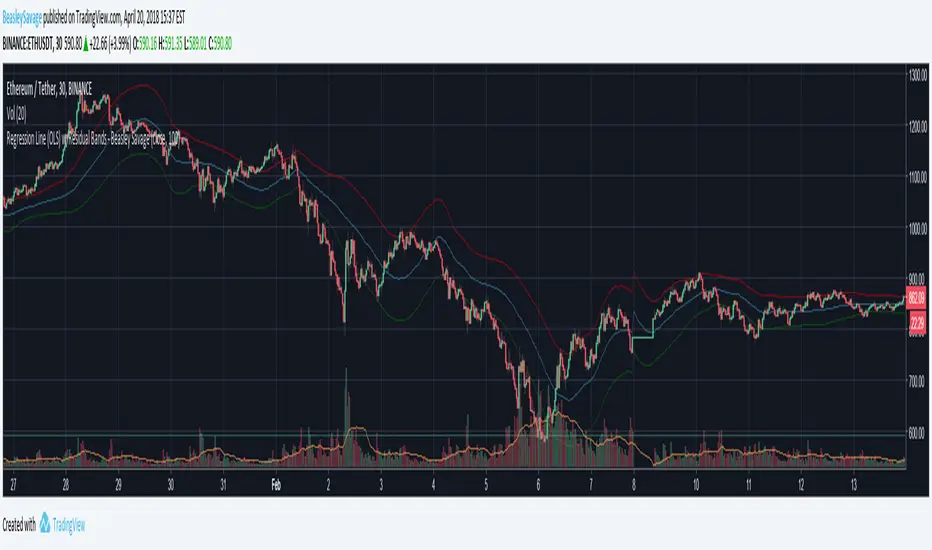
Regression Line (OLS) w/Residual Bands - Beasley SavagePlots linear regression "line of best fit" for a given source and length. Also plots the standard deviation of residuals as upper and lower bands. For some reason it's not plotting the lines exactly where the values are, so I wouldn't recommend using it as a purely visual indicator, but it could be used in strategies. A quick implementation of a strategy buying when the close crossed over the lower band and selling when close crossed under the upper band resulted in ~60-70% trade accuracy, not taking into account commission/slippage.
If anyone knows how to fix the lines not plotting accurately please let me know :)
CM_Ultimate RSI Triple TimeframeCM_Ultimate RSI MTF modified.
enough one extra line? NO, I need more lines!
I added another timeframe's extra RSIline.
default 60/15/5m RSIline

KK_Traders Dynamic Index Higher TimeframeHi Guys,
I was asked to create a script that can access TDI values from higher timeframes - here it is.
You can choose the timeframe in the settings just put the following there:
Weekly - W
Daily - D
4h - 240
1h - 60
...
This only works for higher timeframes than the one you're currently on.
I whish you all good luck trading!
Best regards
KK
Relative Momentum IndexRelative Momentum Index indicator script. This indicator was originally developed by Roger Altman (Stocks & Commodities V. 11:2 (57-60)).
RMI with momentum period of 1 will be equal to an RSI when they have the same period and source price.

GBP combine1. stop trading in one side market
- use what kind of TA to decide one side market?
2. TA might react differently in different session
- inactive session need to RSI 60-40?
3. need to stop trading once daily target is complete?
- what is the daily target?
4. How to loss less?
- (1)
- develop more restriction in strategy?

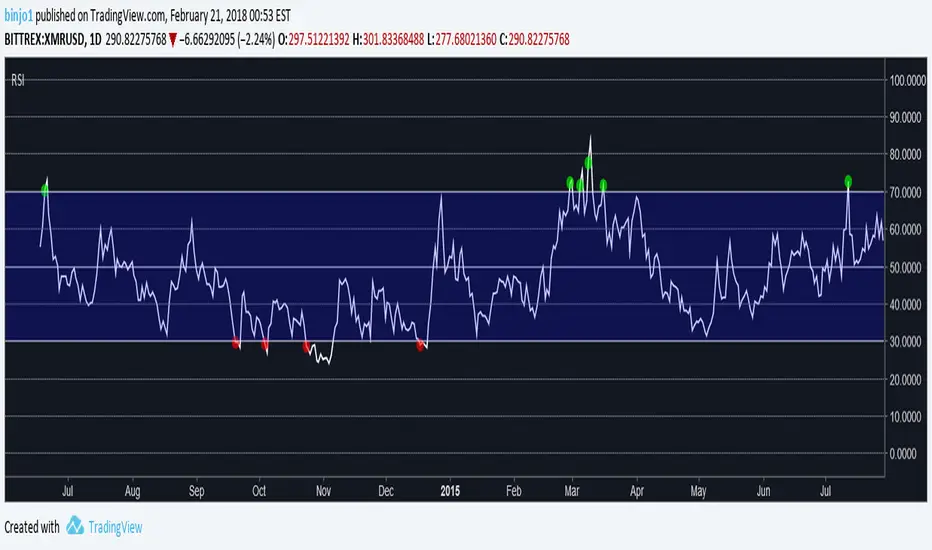
Better RSI0, 10, 20, 30, 40, 50, 60, 70, 80, 90, 100 lines drawn. Easier to see on dark theme. Added bubble indicators to show when price goes above 70 or below 30.