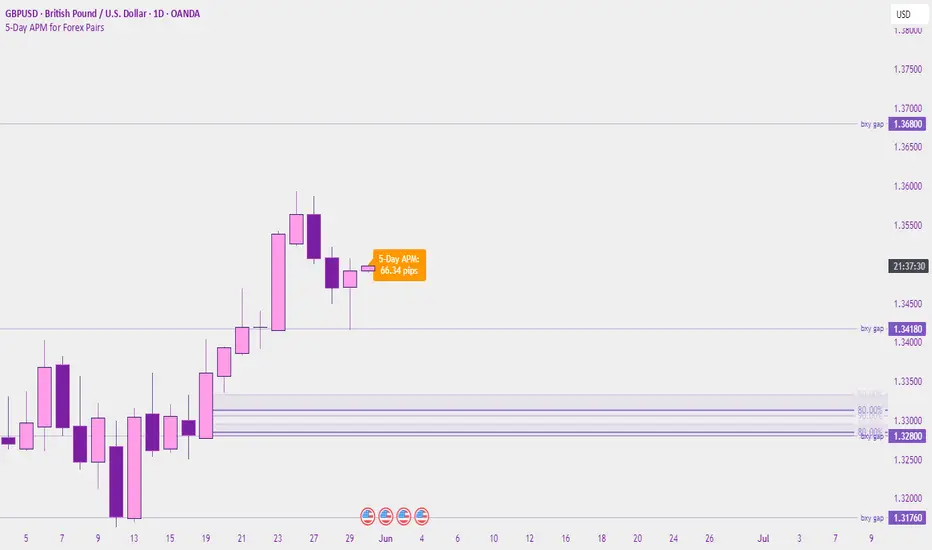
5-Day APM for Forex PairsThis script calculates the 5-Day Average Pip Movement (APM) for major Forex pairs.
It displays the average daily range (in pips) over the past 5 trading days using true high-low price movement.
The script is optimized for clarity and minimalism — showing a single floating label on the main chart for pairs like GBPUSD, USDJPY, EURUSD, etc.
Automatically adjusts pip calculation for JPY pairs (×100) and other pairs (×10000).
✅ Great for identifying high-volatility vs low-volatility conditions
✅ Clean design with no clutter
✅ Only works on major FX pairs (whitelisted)
在腳本中搜尋"蔚山现代vs川崎前锋"
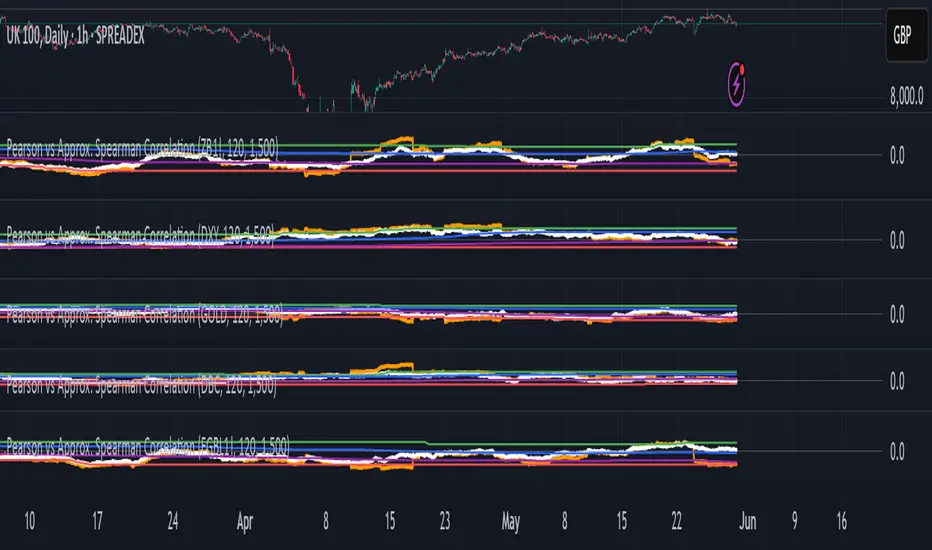
Pearson vs Approx. Spearman CorrelationThis indicator displays the rolling Pearson and approximate Spearman correlation between the chart's asset and a second user-defined asset, based on log returns over a customizable window.
Features:
- Pearson correlation of log returns (standard linear dependency measure)
- Approximate Spearman correlation, using percentile ranks to better capture nonlinear and monotonic relationships
/ Horizontal lines showing:
Maximum and minimum correlation values over a statistical window
1st quartile (25%) and 3rd quartile (75%) — helpful for identifying statistically high or low regimes
This script is useful for identifying dynamic co-movements, regime changes, or correlation breakdowns between assets — applicable in risk management, portfolio construction, and pairs trading strategies.
Symbol vs Benchmark Performance & Volatility TableThis tool puts the current symbol’s performance and volatility side-by-side with any benchmark —NASDAQ, S&P 500, NIFTY or a custom index of your choice.
A quick glance shows whether the stock is outperforming, lagging, or just moving with the market.
⸻
Features
• ✅ Returns over 1W, 1M, 3M, 6M, 12M
• 🔄 Benchmark comparison with optional difference row
• ⚡ Volatility snapshot (20D, 60D, or 252D)
• 🎛️ Fully customizable:
• Show/hide rows and timeframes
• Switch between default or custom benchmarks
• Pick position, size, and colors
Built to answer a simple, everyday question — “How’s this really doing compared to the broader market?”
Thanks to @BeeHolder, whose performance table originally inspired this.
Hope it makes your analysis a little easier and quicker.

Project SynthIntroducing Project Synth !
Inspired by Pace of Tape and Cumulative Delta I created Project Synth in order to aggregate volume flow data across multiple marketsfor two primary reasions:
Traditional orderflow tools are not available on Tradingview. My script attempts to bring an original; calculus-based approach to creating not only an alternative for traditional orderflow tools, but also a more accurate one.
In order to detect genuine buying and selling pressure that cannot be easily manipulated. I did this because while I've always enjoyed concept behind both of those tools, I did not think they captured enough data to be useful. By analyzing assets that move together (positive correlation) and assets that move inversely (negative correlation), my system aims to fix the fundamental problems with those indicators and create an objective view of market sentiment based on aggregate orderflow.
Some more detailed explanations (using QQQ and SQQQ as an example):
Inverse Market Dynamics (QQQ vs SQQQ):
In an inverse market like SQQQ, aggressive buyers hit the ask when they expect the underlying (QQQ) to fall, while passive buyers wait on the bid hoping for cheaper inverse exposure. When QQQ rallies, SQQQ sees aggressive selling (people dumping their bearish bets) hitting bids, while passive sellers sit on the ask hoping to exit at better prices. The aggression flows opposite to the underlying market direction.
Why Utilizing Both Markets Provides A More Accurate Delta:
Watching both QQQ and SQQQ gives cross-validation - real buying pressure in QQQ should coincide with selling pressure in SQQQ. If you see buying in QQQ but also buying in SQQQ, that's a conflicting signal suggesting the move might be artificial or driven by other factors. The inverse relationship acts as a confirmation filter, making false signals much harder to generate.
Multiple Markets = Authentic Pressure:
The more unique, important markets you track, the harder it becomes to create fake delta moves. Real institutional buying/selling pressure affects multiple correlated assets simultaneously in predictable patterns - you can't easily manipulate tech stocks, treasury bonds, VIX, and currency pairs all at once to create a false signal. Each additional market acts as a fraud detection layer, ensuring the delta measurement reflects genuine ecosystem-wide buying and selling pressure rather than isolated manipulation or noise.
My Suggestions For Usage:
In order to keep the explanation simple and short for now, I suggest using it just like a cumulative delta indicator. For example: let's say you were watching CME_MINI:ES1! , and you had a resistance level at 6000. When the price reaches your resistance level, you would be looking for a significant divergence between price and Delta. Price : rising, Delta : falling. This means that even though the price was going up, strong and aggressive sellers are jumping in more and more, this can be used as a confirmation tool for a resistance level.
Notes For Moderators, Authors and Users:
Firstly, to the best of my knowledge, I have not been able to find many tools built around the concept of cumulative delta or pace of tape. While I know there are a couple projects, none to the magnitude of synthetically recreating these tools via an algorithm designed around basic calculus principles. While tools like Volume Delta are built in, they do not attempt to capture an accurate picture of aggregated orderflow from what I understand.
Secondly, it needs to be noted that tool aims to create an approximation of buying and selling pressure. To my knowledge it is not possible to create an accurate full picture, at least not within the limitations of Tradingview.

SD Median MVRV-Z🧠 Overview
SD Median MVRV-Z is a trend-following indicator that uses on-chain valuation signals as a supportive filter. It blends the momentum of the MVRV Z-score with a dynamic median-based price structure to provide cleaner, more reliable directional signals. This tool is designed to identify when price and trend align with favorable broader context — not to pinpoint overbought or oversold extremes.
🧩 Key Features
Trend-Following Core: Signals are built around directional strength, not reversion.
MVRV Z-Score Momentum: Utilizes the statistical momentum of Market Cap vs Realized Cap as a macro trend driver.
Rolling Median Filter: Applies a price-based condition to ensure trend signals are not triggered during short-term counter-moves or noise.
Threshold Customization: Input controls allow traders to define the strength required to trigger long or short signals.
Dynamic Visualization: Candle coloring and filled zones provide instant feedback on current market regime.
🔍 How It Works
Trend Signal: The MVRV ratio is normalized via Z-scoring to produce a momentum-like signal based on how far current valuation deviates from its rolling average.
Price Filter: A rolling median and standard deviation of price define an upper and lower band. These serve to filter out MVRV-Z signals that occur when price is moving against the perceived direction.
Signal Logic:
Long signal = MVRV-Z above threshold and price is not in the lower volatility band.
Short signal = MVRV-Z below threshold, regardless of price band (more aggressive condition).
Directional Engine (CD): Encodes the market regime state (1 for long, -1 for short, 0 for neutral), and drives all visual outputs.
🔁 Use Cases & Applications
Momentum Confirmation: Identify when on-chain momentum and price structure both confirm a trend direction.
Reduced Whipsawing: Filter out weak or conflicting trend signals that would otherwise lead to false entries.
Best Suited for BTC: This indicator is specifically tailored for Bitcoin, using BTC’s Market Cap and Realized Cap data from on-chain sources.
✅ Conclusion
SD Median MVRV-Z is a trend-centric tool that ensures directional conviction by requiring agreement between price structure and underlying market momentum. It is not meant to detect tops or bottoms, but instead to help traders participate in sustainable moves with greater confidence.
⚠️ Disclaimer
The content provided by this indicator is for educational and informational purposes only. Nothing herein constitutes financial or investment advice. Trading and investing involve risk, including the potential loss of capital. Always backtest and apply risk management suited to your strategy.

21-Day Trend Direction📈 21-Day Trend Direction Indicator
📊 How It Works:
🎯 Trend Detection Logic:
Analyzes last 21 daily candles
Calculates total price change from start to end
Compares against sideways threshold (default 2%)
Counts bullish vs bearish days
Tracks higher highs and lower lows
📈 Trend Classifications:
• 📈 UPTREND: Price change > +2% over 21 days
• 📉 DOWNTREND: Price change < -2% over 21 days
• ➡️ SIDEWAYS: Price change between -2% and +2%
💪 Trend Strength Levels:
• 🔥 Very Strong: >5% price change
• 💪 Strong: 3-5% price change
• 📊 Moderate: 1.5-3% price change
• 📉 Weak: <1.5% price change
🎨 Visual Features:
📋 Information Table Shows:
• Trend Direction with color coding
• Price Change % over 21 days
• Trend Strength classification
• Bull/Bear Days count
• Higher Highs/Lower Lows count
• Analysis Period (customizable)
📊 Chart Indicators:
• Trend Line (21-day moving average)
• Background Color for quick trend identification
• Trend Arrows (▲ ▼ ➡) on chart
• Customizable display options
⚙️ Customizable Settings:
🎯 Analysis Settings:
• Lookback Days: 5-50 days (default: 14)
• Sideways Threshold: 0.5-10% (default: 2%)
• Trend Strength: Low/Medium/High sensitivity
🎨 Display Options:
• Table Position: 9 different positions
• Table Size: Tiny to Large
• Show/Hide: Table, Trend Line, Background, Arrows
🚨 Alert Options:
• Trend Change to Uptrend
• Trend Change to Downtrend
• Trend Change to Sideways
This indicator gives you a clear, objective view of the 21-day trend with multiple confirmation signals! 🚀

Smooth BTCSPL [GiudiceQuantico] – Dual Smoothed MAsSmooth BTCSPL – Dual Smoothed MAs
What it measures
• % of Bitcoin addresses in profit vs loss (on-chain tickers).
• Spread = profit % − loss % → quick aggregate-sentiment gauge.
• Optional alpha-decay normalisation ⇒ keeps the curve on a 0-1 scale across cycles.
User inputs
• Use Alpha-Decay Adjusted Input (true/false).
• Fast MA – type (SMA / EMA / WMA / VWMA) & length (default 100).
• Slow MA – type & length (default 200).
• Colours – Bullish (#00ffbb) / Bearish (magenta).
Computation flow
1. Fetch daily on-chain series.
2. Build raw spread.
3. If alpha-decay enabled:
alpha = (rawSpread − 140-week rolling min) / (1 − rolling min).
4. Smooth chosen base with Fast & Slow MAs.
5. Bullish when Fast > Slow, bearish otherwise.
6. Bars tinted with the same bull/bear colour.
How to read
• Fast crosses above Slow → rising “addresses-in-profit” momentum → bullish bias.
• Fast crosses below Slow → stress / capitulation risk.
• Price-indicator divergences can flag exhaustion or hidden accumulation.
Tips
• Keep in a separate pane (overlay = false); bar-colouring still shows on price chart.
• Shorter lengths for swing trades, longer for macro outlook.
• Combine with funding rates, NUPL or simple price-MA crossovers for confirmation.

Auto FaustAuto Faust – Intraday Market Context & Structure
Auto Faust is a visual market overlay designed for intraday traders who want fast context without relying on signals or automation. It combines classic price tools — VWAP, EMAs, RSI, Chop Score, and market structure trendlines — into a single glanceable dashboard.
🔍 What It Does:
VWAP (Volume Weighted Average Price): Shows the day's fair value price anchor.
EMAs (3, 21, 113, 200): Map short-term to long-term trend alignment. Crossovers can be used for confluence or caution.
RSI (10): Monitors local momentum. Displayed in a compact table.
Chop Score: Measures how directional price action is. High chop = ranging conditions; low = trending.
Session High/Low Tracker: Tracks the daily extremes in real-time.
Volume Monitor: Shows current candle volume, color-coded vs previous bar (green = higher, red = lower).
Dynamic Support & Resistance Lines: Plotted from pivot highs/lows (not static levels).
Automatic Trendlines: Drawn from swing structure, updating live.
📊 How to Use:
Use EMAs + VWAP alignment to assess directional bias.
Confirm clean trends with low Chop Score and RSI support.
Watch for price interaction around dynamic S/R lines and trendline breaks.
Use volume coloring to assess if momentum is increasing or fading.
No buy/sell signals are generated — this is a trader-facing tool to guide discretionary decision-making.

MTF Candle Direction Forecast + Breakdown🧭 MTF Candle Direction Forecast + Breakdown 🔥📈🔼
This script is a multi-timeframe (MTF) price action dashboard that helps traders assess real-time directional bias across five customizable timeframes — with a focus on candle behavior, trend alignment, and confidence strength.
📌 What It Does
For each timeframe, this dashboard summarizes:
Current direction → Bullish, Bearish, or Neutral
Confidence score (0–100) → How strongly price is likely to continue in that direction
Candle strength → 🔥 icon appears if the current candle has a large body relative to its range
Trend alignment:
📈 = EMA9 is above EMA20
🔼 = Price is above VWAP
Color-coded background to visually reinforce directional state
Each row gives you a visual “at-a-glance” readout of what price is doing right now — not in the past.
💡 Why It’s Useful
✅ Direction forecasting based on price action
Instead of lagging indicators, this script prioritizes:
Candle body-to-range ratio (momentum)
Real-time VWAP/EMA structure
Immediate price positioning
✅ Confidence is quantified
The score (0–100) helps you judge how reliable each directional signal is:
90+ → Strong conviction
50–70 → Mixed but potentially valid
<40 → Weak move or early signal
✅ Timeframe confluence at a glance
See whether multiple timeframes are aligning directionally — helpful for scalping, day trading, or waiting for multi-timeframe breakout setups.
✅ Visual & intuitive
Icons, colors, and layout make it easy to scan your dashboard instead of deciphering charts or code.
🛠️ Adjustable Settings
Setting Description
Timeframe 1–5 Choose any timeframes to monitor (e.g., 5m, 15m, 1h, 4h)
Candle Display Mode Show trend color via emoji (🟢/🔴) or background shading
Strong Candle Threshold Adjust the body-to-range % needed to trigger 🔥 strength
Bullish/Bearish Background Customize label color coding
Neutral Background (opacity) Set transparency or styling for flat/consolidating zones
Table Location Place the dashboard anywhere on the chart
🎯 Use Cases
Scalpers: Confirm trend across 1m/5m/15m before entering
Day Traders: Use confidence score to avoid low-momentum setups
Swing Traders: Monitor higher timeframes for trend shifts while tracking intraday noise
VWAP/EMA traders: Quickly see when price is reclaiming or losing critical trend levels
🧠 What Makes It Unique?
Unlike generic trend meters or mashups of standard indicators, this script:
Uses live candle dynamics (not just closes or lagging values)
Computes directional bias and confidence together
Visualizes strength and structure in a compact, readable interface
Let’s you filter by price action, not just indicator alignment
💥 Why Traders Love Will Love It
✅ Instant clarity on which timeframes agree
✅ No more guessing candle strength or trend health
✅ Confidence score keeps you out of weak trades
✅ Works with any strategy — trend following, VWAP reclaim, EMA scalps, even breakouts
✅ Keeps your chart clean — all the context, none of the clutter
⚠️ Transparency🧬 Under the Hood
Powered by live candle body analysis, trend structure (EMA9 vs EMA20), and VWAP placement.
All scores are generated in real-time — No repainting or lookahead bias: all values are computed with lookahead=barmerge.lookahead_on
Confidence scores reflect the current candle only — they do not predict future moves but measure momentum and alignment in real-time
Labels update per bar and respond to subtle shifts in candle structure and trend indicators
✅ MTF Trend Snapshot (Live Output Example Shown in Chart Above)
This dashboard gives you a fast, visual summary of market trend and momentum across 5 timeframes. Here's what it's telling you right now:
🕔 5 Minute (5m)
📉 EMA Trend: Down
🔼 Price: Above VWAP
Direction: Bearish (42)
🟥 Weak bearish bias. Short-term pullback against a stronger trend. Use caution — lower confidence and mixed structure.
⏱️ 15 Minute (15m)
📈 EMA Trend: Up
🔼 Price: Above VWAP
Direction: Bullish (73)
🟩 Clean bullish structure with growing momentum. Solid for intraday confirmation.
🕧 30 Minute (30m)
📈 EMA Trend: Up
🔼 Price: Above VWAP
Direction: Bullish (77)
🟩 Stronger trend forming. Above VWAP and EMAs — building conviction.
🕐 1 Hour (1h)
📈 EMA Trend: Up
🔼 Price: Above VWAP
Direction: Bullish (70)
🟩 Confident, clean trend. Good alignment across indicators. Ideal timeframe for swing entries.
🕓 4 Hour (4h)
🔥 Strong Candle
📈 EMA Trend: Up
🔼 Price: Above VWAP
Direction: Bullish (100)
🟩 Full trend alignment with max momentum. Strong body candle + structure — high confidence continuation.
🧠 Quick Takeaway
🔻 5m is pulling back short term
✅ 15m through 4h are fully aligned Bullish
🔥 4h has max confidence — big-picture trend is intact
📈 Ideal setup for momentum traders looking to ride trend with multi-timeframe confirmation
Try pinning this dashboard to your chart during live trading to read price like a story across timeframes, and filter out weak setups with low-confidence noise.

Institutional Volume Footprint ProOVERVIEW
The Institutional Volume Footprint Pro is a comprehensive volume analysis indicator designed to identify institutional trading activity and significant volume patterns. Based on the proven Pocket Pivot Volume methodology by Chris Kacher and Gil Morales, this indicator has been enhanced with multiple additional volume analysis techniques to provide traders with a complete picture of smart money movements.
KEY FEATURES
1. Pocket Pivot Volume (PPV) Detection
- Identifies bullish volume patterns where current volume exceeds the highest down-day volume of the past 10 days
- Blue volume bars with "PPV" labels mark potential institutional accumulation
- Customizable lookback period (5-20 days)
2. Pivot Negative Volume (PNV) Detection
- Spots bearish volume patterns where selling volume exceeds recent up-day volumes
- Orange bars with "PNV" labels indicate potential institutional distribution
- Early warning system for trend reversals
3. Advanced Institutional Patterns
- Accumulation Detection (Aqua): High volume with narrow price range - classic stealth accumulation
- Churning/Distribution (Yellow): Heavy volume with minimal price progress - potential topping pattern
- Volume Dry-up (Purple): Extremely low volume periods that often precede significant moves
- Volume Climax (Fuchsia): Extreme volume spikes signaling potential exhaustion
4. Real-time Analytics Dashboard
- Relative Volume: Current volume compared to 10-day average
- Volume vs MA: Multiple of current volume to selected moving average
- Price Range Analysis: Narrow/Normal/Wide range classification
5. Accumulation/Distribution Trend
- Background coloring shows overall money flow direction
- Green tint: Net accumulation phase
- Red tint: Net distribution phase
HOW TO USE
Entry Signals:
- PPV (Blue): Consider long positions when price breaks above resistance with PPV confirmation
- Accumulation (Aqua): Watch for breakouts following multiple accumulation days
- Volume Dry-up (Purple): Prepare for potential explosive moves
Exit/Warning Signals:
- PNV (Orange): Consider taking profits or tightening stops
- Churning (Yellow): Distribution may be occurring despite stable prices
- Volume Climax (Fuchsia): Potential reversal point - extreme caution advised
CUSTOMIZATION OPTIONS
Analysis Parameters:
- PPV Lookback Period (5-20 days)
- Volume MA Length & Type (SMA/EMA/WMA)
- Relative Volume Threshold
- Climax Volume Multiplier
Visual Controls:
- Toggle Info Table display
- Enable/disable individual label types (PPV, PNV, ACC)
- Show/hide volume moving averages
- Control A/D trend background
- Customize threshold lines
BUILT-IN ALERTS
- Pocket Pivot Volume detected
- Pivot Negative Volume detected
- Institutional Accumulation pattern
- Volume Climax warning
- Volume Dry-up alert
PRO TIPS
1. Combine with Price Action: Volume confirms price - look for PPV at breakouts and PNV at breakdowns
2. Multiple Timeframes: Check daily and weekly charts for confluence
3. Relative Volume Matters: Patterns are stronger when relative volume > 1.5x
4. Watch for Divergences: Price up with decreasing volume = weakness
COLOR LEGEND
- Blue: Pocket Pivot Volume (Bullish)
- Orange: Pivot Negative Volume (Bearish)
- Aqua: Institutional Accumulation
- Yellow: Churning/Distribution
- Purple: Volume Dry-up
- Fuchsia: Volume Climax
- Green: Above-average up volume
- Red: Above-average down volume
- Gray: Below-average volume
EDUCATIONAL BACKGROUND
This indicator implements concepts from:
- "Trade Like an O'Neil Disciple" by Gil Morales & Chris Kacher
- William O'Neil's volume analysis principles
- Richard Wyckoff's accumulation/distribution methodology
Happy Trading! May the volume be with you!

BVB dominance bars
Hello everyone, this is my first indicator. these candles shows you who's in control. I like to think its some what close to heikin ashi candles as it shows you the Trend but doesn't average it out. also shows you when there is indecision. please read the instructions on how it works. its not a stand alone strategy. but adds value to your own strategy.
📖 How It Works
The BvB Dominance Bars indicator is a visual tool that colors candles based on market control—whether bulls or bears are in charge. It uses a custom metric comparing the price's relationship to a smoothed moving average (EMA), then normalizes that difference over time to express relative bullish or bearish pressure.
Here’s the breakdown:
Bulls vs Bears Logic:
A short-term EMA (default: 14-period) is used to establish a midpoint reference.
Bull Pressure is calculated as how far the high is above this EMA.
Bear Pressure is how far the low is below this EMA.
These are normalized over a lookback period (default: 120 bars) to produce percentile scores (0–100) for both bulls and bears.
Dominance & Color Coding:
The indicator compares normalized bull and bear scores.
Candles are color-coded based on:
Bright Lime: Strong Bull Dominance (with high confidence)
Soft Lime/Yellow: Moderate Bull Control
Bright Red: Strong Bear Dominance
Soft Red/Yellow: Moderate Bear Control
Gray: Neutral/Low conviction
Optional Live Label:
A small floating label shows who has control: “Bull Control,” “Bear Control,” or “Neutral.”
🧠 How to Use It (Example Strategy)
The BvB Dominance Bars indicator is not a standalone buy/sell signal but a market sentiment overlay. It’s most effective when combined with your own strategy, like price action or trend-following tools.
Here’s an example use case:
🧪 Reversal Confirmation Strategy
Objective: Catch high-probability reversals during key kill zones or supply/demand levels.
Setup:
Mark your key support/resistance zones using your standard method (e.g., FVGs, liquidity sweeps, or ICT PD arrays).
Wait for price to reach one of these zones.
Watch candle colors from the BvB Dominance Bars:
If you expect a bullish reversal, wait for a transition from red/gray candles to lime green or bright lime (bullish dominance taking over).
If you expect a bearish reversal, look for a change from green/gray to red or bright red.
Entry Filter:
Only enter if the dominant color holds for 2+ candles.
Avoid trades when candles are gray or yellow (indecision/neutral).
Exit Option:
Exit if dominance shifts against you (e.g., from lime to red), or use structure-based stops.
⚙️ Settings You Can Adjust:
BvB Period: Controls how fast EMA responds.
Bars Back: Determines how long the normalization looks back.
Thresholds: Influence how strong the dominance must be to change candle color.
✅ Best Used When:
You already have a bias and just want a confirmation of sentiment.
You're trading intraday and want a feel for shifting momentum without relying on noisy indicators.
You want a clean, color-coded overlay to help filter out fakeouts and indecision.

Profit Guard ProProfitGuard Pro
ProfitGuard Pro is a risk management and profit calculation tool that helps traders optimize their trades by handling position sizing, risk management, leverage, and take profit calculations. With support for both cumulative and non-cumulative take profit strategies, this versatile indicator provides the insights you need to maximize your trading strategy.
How to Use ProfitGuard Pro:
Load the Indicator: Add ProfitGuard Pro to your chart in TradingView.
Set Your Entry Position: Input your desired entry price.
Define Your Stop Loss: Enter the price at which your trade will exit to minimize losses.
Add Take Profit Levels: Input your TP1, TP2, TP3, and TP4 levels, as needed.
If you want fewer take profit levels, adjust the number of TPs in the settings menu. You can choose between 1 to 4 take profit levels based on your strategy.
Adjust Risk Settings: Specify your account size and risk percentage to calculate position size and leverage.
Choose Cumulative or Non-Cumulative Mode: Toggle cumulative profit mode to either recalculate position sizes as each take profit is hit or keep position sizes static for each TP.
Once set up, ProfitGuard Pro will automatically calculate your position size, leverage, and potential profits for each take profit level, providing a clear visual on your chart to guide your trading decisions.
Key Features:
Risk Management:
Calculate your risk percentage based on account size and stop loss.
Visualize risk in dollar terms and percentage of your account.
Position Size & Leverage:
Automatically calculate the ideal position size and leverage for your trade based on your entry, stop loss, and risk settings.
Ensure you are trading with the appropriate leverage for your account size.
Cumulative vs Non-Cumulative Profit Mode:
Cumulative Mode: Adjusts position size after each take profit is reached, recalculating for remaining contracts.
Non-Cumulative Mode: Treats each take profit as a separate calculation using the full position size.
Take Profit Levels:
Set up to 4 customizable take profit levels.
Adjust percentage values for each TP target, and visualize them on your chart with easy-to-read lines.
Profit Calculation:
Displays potential profits for each take profit level based on whether cumulative or non-cumulative mode is selected.
Calculate your risk-reward ratio dynamically at each TP.
Customizable Visuals:
Easily customize the table's size, position, and color scheme to fit your chart.
Visualize key trade details like leverage, contracts, margin, and profits directly on your chart.
Short and Long Position Support:
Automatically adjusts calculations based on whether you're trading long or short.

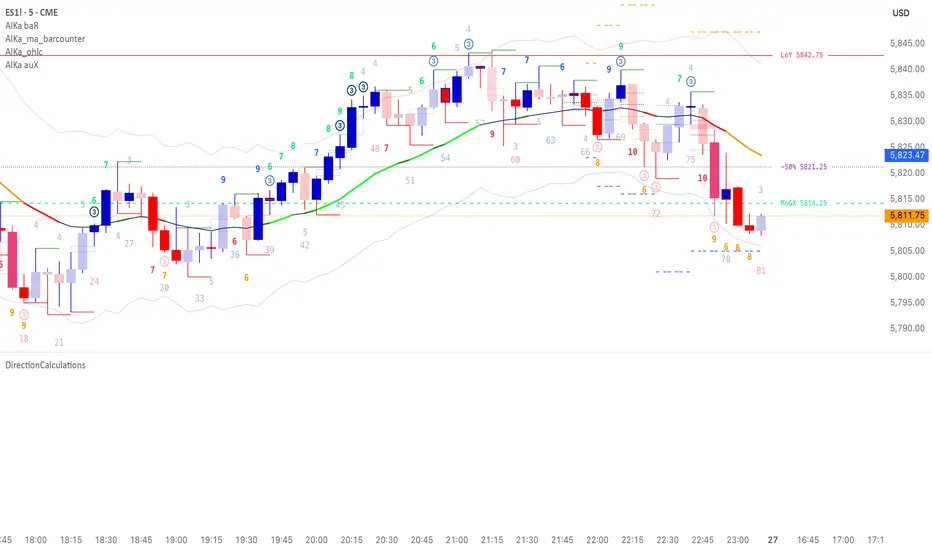
DirectionCalculationsLibrary "DirectionCalculations"
Direction calculation algorithms for body, bar, and breakout directions
get_body_direction()
Calculate body direction based on open vs close
Returns: Body direction: 1 (bullish), -1 (bearish), 0 (doji)
get_bar_direction()
Calculate bar direction based on close position relative to hl2
Returns: Bar direction: 1 (upper half), -1 (lower half), 0 (middle)
get_breakout_direction()
Calculate breakout direction with outside/inside bar logic
Returns:
get_combined_direction(bod_dir, bar_dir, bro_dir, bro_ob_dir)
Calculate combined direction from body and bar directions
Parameters:
bod_dir (int) : Body direction
bar_dir (int) : Bar direction
bro_dir (int) : Breakout direction
bro_ob_dir (int) : Outside bar direction
Returns: Combined direction
is_consecutive_direction(current_dir, previous_dir)
Check if directions are consecutive (no reversal)
Parameters:
current_dir (int) : Current direction
previous_dir (int) : Previous direction
Returns: True if consecutive (no reversal from +1 to -1 or -1 to +1)
get_all_directions()
Get all direction calculations at once
Returns:
get_breakout_distances()
Get distance calculations for breakout analysis
Returns: High-to-high and low-to-low distances
get_bar_patterns()
Check for specific bar patterns
Returns:
Adaptive Multi-TF Indicator Table with Presets giua64📌 Script Name:
Adaptive Multi-Timeframe Indicator Table with Presets — giua64
📄 Description:
This script displays an adaptive multi-timeframe dashboard that summarizes the signals of three key technical indicators:
Moving Averages (MAs), Relative Strength Index (RSI), and MACD.
It provides a fast and visually intuitive overview of market conditions across five timeframes (5m, 15m, 30m, 1h, 4h), helping traders quickly identify potential directional biases (e.g., bullish, bearish, or neutral) based on either predefined presets or fully manual settings.
🧰 Preset Configurations:
You can choose between four trading styles, each with optimized indicator parameters:
Scalping
• MAs: 5 / 10 (Fast), 20 / 50 (Slow)
• RSI: 7 periods | Overbought: 70 | Oversold: 30
• MACD: 5 / 13 | Signal: 3
Intraday
• MAs: 9 / 21 (Fast), 50 / 100 (Slow)
• RSI: 14 periods | Overbought: 60 | Oversold: 40
• MACD: 12 / 26 | Signal: 9
Swing
• MAs: 10 / 20 (Fast), 50 / 200 (Slow)
• RSI: 14 periods | Overbought: 65 | Oversold: 35
• MACD: 12 / 26 | Signal: 9
Manual
• Full custom control over all indicator settings.
🛠️ All settings can be customized manually from the options panel, including the exact MA periods, RSI thresholds, and MACD structure.
🧠 How It Works:
For each timeframe, the script evaluates:
MA crossover status (two levels):
The first symbol refers to the crossover of the fast MAs
The second symbol refers to the crossover of the slow MAs
🟢 = Bullish crossover
🔴 = Bearish crossover
➖ = Flat or no clear signal
RSI Direction:
↑ = RSI above upper threshold (potential overbought)
↓ = RSI below lower threshold (potential oversold)
→ = RSI in neutral range
MACD Line vs Signal Line:
↑ = MACD line is above signal line (bullish)
↓ = MACD line is below signal line (bearish)
→ = Flat or neutral signal
Each signal is assigned a numerical score. These are aggregated per timeframe to compute a combined score that reflects the directional bias for that specific time window.
🧠 Adaptive Logic by Asset:
This script is designed to be universally compatible across all asset types — including forex, crypto, stocks, indices, and commodities.
Thanks to its multi-timeframe nature and flexible indicator presets, the script automatically adjusts its behavior based on the asset selected, ensuring relevant analysis without requiring manual recalibration.
🧾 Summary Table Output:
At the bottom of the dashboard, a combined sentiment is displayed for:
3TF → 5m, 15m, 30m
4TF → Adds 1h
5TF → Adds 4h
Each row shows:
Signal → LONG / SHORT / NEUTRAL
Confidence (%) → Based on score aggregation and signal consistency
📌 Customization Options:
Table Position: Left, Right, or Center
Text Size: Small, Normal, or Large
Full Manual Configuration: All MA, RSI, and MACD parameters can be adjusted as needed
⚠️ Disclaimer:
This script is for educational and analytical purposes only.
It does not constitute financial advice or guarantee any trading results.
Always do your own research and apply responsible risk management.

Supertrend - SSL Strategy with Toggle [AlPashaTrader]📈 Overview of the Supertrend - SSL Strategy with Toggle Indicator
This strategy combines two powerful technical tools—Supertrend and SSL Channel—to deliver precise and reliable trading signals, designed for traders who value confirmation and risk management. 🎯
⚙️ How This Indicator Was Created
The strategy was meticulously crafted to harness the complementary strengths of:
Supertrend Indicator: A trend-following tool based on Average True Range (ATR) and a multiplier factor, it detects bullish or bearish trends by calculating dynamic support and resistance levels. 📊
SSL Channel: A channel indicator built using two Simple Moving Averages (SMA) of the highs and lows over a set period. It cleverly determines trend direction by comparing price action relative to these moving averages. 🔄
These two indicators are merged into one cohesive strategy with an optional toggle feature allowing the trader to choose whether to require confirmation from both indicators before taking a position or to act on signals from either. 🎚️
The script includes user-friendly controls for:
Defining a custom trading date range 📅, useful for backtesting or restricting trading to specific market conditions.
Setting the ATR length and multiplier for Supertrend sensitivity ⚙️.
Adjusting the SSL channel period for responsiveness to price changes ⏱️.
Choosing whether to require dual confirmation (both Supertrend and SSL signals) for more conservative trading or a single indicator trigger for a more aggressive approach 🛡️ vs ⚔️.
🔍 How This Indicator Works
Signal Generation:
Supertrend analyzes market volatility and trend direction, signaling a potential buy when the trend turns bullish 📈 and a sell when bearish 📉.
SSL Channel tracks price relative to its high and low moving averages to identify uptrends and downtrends. A crossover of the SSL Up and SSL Down lines generates buy or sell signals 🔔.
Confirmation Logic:
When confirmation is enabled, the strategy waits for agreement between both indicators before entering a trade ✅, reducing false signals.
When confirmation is disabled, it trades based on signals from either indicator ⚡, allowing more frequent entries but potentially higher risk.
Entry and Exit Rules:
Entry occurs when the indicator(s) signal a new trend direction 🚀 for long, or decline for short.
Exit happens when opposing signals appear 🛑, closing existing positions to lock in profits or cut losses.
Visual Aids:
The SSL Channel lines are plotted directly on the chart with distinct colors to intuitively show trend shifts 🎨.
The system respects the specified date range ⏳, ensuring trades only occur within user-defined periods.
🎯 How to Use This Strategy Effectively
Set Your Preferences: Adjust ATR length, factor, and SSL period to your style. More sensitive? Decrease lengths. Smoother? Increase them ⚙️.
Choose Confirmation Mode: Use the toggle depending on your risk appetite:
Confirmation ON ✅: For conservative traders wanting high-probability setups.
Confirmation OFF ⚡: For aggressive traders who want more signals.
Apply Date Filters: Focus your trading or backtesting on specific periods 📅.
Monitor Entry/Exit Signals: Watch crossovers and Supertrend changes closely 👀.
Risk Management: The strategy uses position sizing as a percentage of equity (default 15%) 💰. Adjust accordingly.
Combine with Other Tools: Enhance results by combining this with volume, price action, or fundamentals 🔧.
📝 Summary
This Supertrend - SSL Strategy with Toggle is a dynamic and flexible trading tool blending volatility-based trend detection with moving-average channel insights. It empowers traders to customize confirmation strictness, control trading periods, and efficiently capture trending opportunities while managing risk smartly.
By integrating proven indicators in a user-friendly, visually intuitive package, this strategy stands as a sophisticated tool suitable for various markets and trading styles. 🚀📊

Crypto Portfolio vs BTC – Custom Blend TrackerThis tool tracks the performance of a custom-weighted crypto portfolio (SUI, BTC, SOL, DEEP, DOGE, LOFI, and Other) against BTC. Simply input your start date to anchor performance and compare your basket’s relative strength over time. Ideal for portfolio benchmarking, alt-season tracking, or macro trend validation.
Supports all timeframes. Based on BTC-relative returns (not USD). Open-source and customizable.
