Hybrid Heiken AshiThis indicator displays real price candles colored by Heiken Ashi trend direction, giving you the noise reduction benefits of HA without the price distortion.
Key Features:
Real candles with HA-based coloring (see actual price action with trend smoothing)
Gradient coloring based on trend strength (darker = stronger trend)
Optional HA close line overlay
Transition markers when HA flips bullish/bearish
Higher timeframe HA background for multi-timeframe confluence
Optional HA ribbon (HA close vs HA EMA)
Info panel showing current HA status, strength, and HTF alignment
Built-in alerts for HA transitions and timeframe alignment
Use Case:
Ideal for traders who want Heiken Ashi's trend-following benefits without losing sight of real price levels for entries and exits. The strength gradient helps identify conviction moves vs weak trends. HTF background helps avoid counter-trend trades.
Settings:
All visual elements are toggleable. Customize colors, choose your higher timeframe, and enable only the features you need.
在腳本中搜尋"采列VS新圣徒"
Multi Timeframe Bollinger Bands Spectrum [Ata]Multi-Timeframe Bollinger Bands Spectrum
Technical Overview
This script integrates multi-timeframe volatility analysis with volume-derived order flow estimation. By combining Bollinger Bands (statistical deviation) with internal candle volume logic, the indicator qualifies price movements to differentiate between sustained trends, reversals, and exhaustion events.
The system is designed to provide a structural context for price action, visualizing market regimes through a dual-zone spectrum and filtering signals based on the interaction between price location and specific volume thresholds.
Core Logic & Calculation
1. Volume Decomposition Algorithm
Instead of using total volume, the script estimates Buying Pressure vs. Selling Pressure based on the close position relative to the candle's High/Low range:
- Buying Volume (vb): Increases as the close approaches the High.
- Selling Volume (vs): Increases as the close approaches the Low.
This logic allows the detection of directional flow even within standard volume bars.
2. Statistical Spectrum
The indicator renders deviations from the Basis (SMA) as two distinct zones:
- Bullish Zone (Blue): Price positioning between the Basis and Upper Band.
- Bearish Zone (Red): Price positioning between the Basis and Lower Band.
This structure is applied across multiple timeframes (overlay) to visualize the macro trend context without noise.
3. Non-Repainting Execution
To ensure historical accuracy and reliability for backtesting, all higher-timeframe data is requested using "lookahead_off". Signals are confirmed only upon the closure of the respective timeframe's candle.
Signal Definitions
Signals are generated only when specific Volatility and Volume conditions intersect:
Reversal Setups (Reaction to Liquidity)
- WALL: Triggered when price rejects the Upper Band accompanied by Extreme Selling Volume (vs > Limit). This suggests active limit sell orders absorbing the rally.
- FLOOR: Triggered when price rejects the Lower Band accompanied by Extreme Buying Volume (vb > Limit). This suggests active limit buy orders absorbing the drop.
- ABSORP: Identifies absorption near the lower bands where selling pressure is met with passive buying (indicated by lower wicks and relative buy volume).
Momentum Setups (Trend Continuation)
- POWER: Validates a breakout above the Upper Band only if supported by Dominant Buying Volume and a strong candle body.
- PANIC: Validates a breakdown below the Lower Band only if supported by Dominant Selling Volume.
- TRAP: Marks failed breakouts where price exits the bands but volume analysis contradicts the move (e.g., low directional volume).
Exhaustion Setups (Statistical Extremes)
- CLIMAX/CRASH: Identifies anomalies where price deviates significantly from the mean (Extreme Deviation) or when volume reaches unsustainable levels relative to the average, often preceding a mean reversion.
Input Parameters
- Bollinger Logic: Configuration for Length and Standard Deviation Multiplier.
- Volume Thresholds: Adjustable factors for Minimum Volume (Trend) and Extreme Volume (Reversal/Climax).
- Timeframe Layers: Toggle visibility for up to 5 higher timeframes.
- Theme: Adjusts label contrast for Dark/Light backgrounds.
Disclaimer
This indicator is strictly for analytical purposes. It provides a visualization of past market data based on statistical and volumetric formulas. Users should apply their own risk management protocols.

Flux-Tensor Singularity [FTS]Flux-Tensor Singularity - Multi-Factor Market Pressure Indicator
The Flux-Tensor Singularity (FTS) is an advanced multi-factor oscillator that combines volume analysis, momentum tracking, and volatility-weighted normalization to identify critical market inflection points. Unlike traditional single-factor indicators, FTS synthesizes price velocity, volume mass, and volatility context into a unified framework that adapts to changing market regimes.
This indicator identifies extreme market conditions (termed "singularities") where multiple confirming factors converge, then uses a sophisticated scoring system to determine directional bias. It is designed for traders seeking high-probability setups with built-in confluence requirements.
THEORETICAL FOUNDATION
The indicator is built on the premise that market time is not constant - different market conditions contain varying levels of information density. A 1-minute bar during a major news event contains far more actionable information than a 1-minute bar during overnight low-volume trading. Traditional indicators treat all bars equally; FTS does not.
The theoretical framework draws conceptual parallels to physics (purely as a mental model, not literal physics):
Volume as Mass: Large volume represents significant market participation and "weight" behind price moves. Just as massive objects have stronger gravitational effects, high-volume moves carry more significance.
Price Change as Velocity: The rate of price movement through price space represents momentum and directional force.
Volatility as Time Dilation: When volatility is high relative to its historical norm, the "information density" of each bar increases. The indicator weights these periods more heavily, similar to how time dilates near massive objects in physics.
This is a pedagogical metaphor to create a coherent mental model - the underlying mathematics are standard financial calculations combined in a novel way.
MATHEMATICAL FRAMEWORK
The indicator calculates a composite singularity value through four distinct steps:
Step 1: Raw Singularity Calculation
S_raw = (ΔP × V) × γ²
Where:
ΔP = Price Velocity = close - close
V = Volume Mass = log(volume + 1)
γ² = Time Dilation Factor = (ATR_local / ATR_global)²
Volume Transformation: Volume is log-transformed because raw volume can have extreme outliers (10x-100x normal). The logarithm compresses these spikes while preserving their significance. This is standard practice in volume analysis.
Volatility Weighting: The ratio of short-term ATR (5 periods) to long-term ATR (user-defined lookback) is squared to create a volatility amplification factor. When local volatility exceeds global volatility, this ratio increases, amplifying the raw singularity value. This makes the indicator regime-aware.
Step 2: Normalization
The raw singularity values are normalized to a 0-100 scale using a stochastic-style calculation:
S_normalized = ((S_raw - S_min) / (S_max - S_min)) × 100
Where S_min and S_max are the lowest and highest raw singularity values over the lookback period.
Step 3: Epsilon Compression
S_compressed = 50 + ((S_normalized - 50) / ε)
This is the critical innovation that makes the sensitivity control functional. By applying compression AFTER normalization, the epsilon parameter actually affects the final output:
ε < 1.0: Expands range (more signals)
ε = 1.0: No change (default)
ε > 1.0: Compresses toward 50 (fewer, higher-quality signals)
For example, with ε = 2.0, a normalized value of 90 becomes 70, making threshold breaches rarer and more significant.
Step 4: Smoothing
S_final = EMA(S_compressed, smoothing_period)
An exponential moving average removes high-frequency noise while preserving trend.
SIGNAL GENERATION LOGIC
When the tensor crosses above the upper threshold (default 90) or below the lower threshold (default 10), an extreme event is detected. However, the indicator does NOT immediately generate a buy or sell signal. Instead, it analyzes market context through a multi-factor scoring system:
Scoring Components:
Price Structure (+1 point): Current bar bullish/bearish
Momentum (+1 point): Price higher/lower than N bars ago
Trend Context (+2 points): Fast EMA above/below slow EMA (weighted heavier)
Acceleration (+1 point): Rate of change increasing/decreasing
Volume Multiplier (×1.5): If volume > average, multiply score
The highest score (bullish vs bearish) determines signal direction. This prevents the common indicator failure mode of "overbought can stay overbought" by requiring directional confirmation.
Signal Conditions:
A BUY signal requires:
Extreme event detection (tensor crosses threshold)
Bullish score > Bearish score
Price confirmation: Bullish candle (optional, user-controlled)
Volume confirmation: Volume > average (optional, user-controlled)
Momentum confirmation: Positive momentum (optional, user-controlled)
A SELL signal requires the inverse conditions.
INPUTS EXPLAINED - Core Parameters:
Global Horizon (Context): Default 20. Lookback period for normalization and volatility comparison. Higher values = smoother but less responsive. Lower values = more signals but potentially more noise.
Tensor Smoothing: Default 3. EMA period applied to final output. Removes "quantum foam" (high-frequency noise). Range 1-20.
Singularity Threshold: Default 90. Values above this (or below 100-threshold) trigger extreme event detection. Higher = rarer, stronger signals.
Signal Sensitivity (Epsilon): Default 1.0. Post-normalization compression factor. This is the key innovation - it actually works because it's applied AFTER normalization. Range 0.1-5.0.
Signal Interpreter Toggles:
Require Price Confirmation: Default ON. Only generates buy signals on bullish candles, sell signals on bearish candles. Reduces false signals but may delay entry.
Require Volume Confirmation: Default ON. Only signals when volume > average. Critical for stocks/crypto, less important for forex (unreliable volume data).
Use Momentum Filter: Default ON. Requires momentum agreement with signal direction. Prevents counter-trend signals.
Momentum Lookback: Default 5. Number of bars for momentum calculation. Shorter = more responsive, longer = trend-following bias.
Visual Controls:
Colors: Customizable colors for bullish flux, bearish flux, background, and event horizon.
Visual Transparency: Default 85. Master control for all visual elements (accretion disk, field lines, particles, etc.). Range 50-99. Signals and dashboard have separate controls.
Visibility Toggles: Individual on/off switches for:
Gravitational field lines (trend EMAs)
Field reversals (trend crossovers)
Accretion disk (background gradient)
Singularity diamonds (neutral extreme events)
Energy particles (volume bursts)
Event horizon flash (extreme event background)
Signal background flash
Signal Size: Tiny/Small/Normal triangle size
Signal Offsets: Separate controls for buy and sell signal vertical positioning (percentage of price)
Dashboard Settings:
Show Dashboard: Toggle on/off
Position: 9 placement options (all corners, centers, middles)
Text Size: Tiny/Small/Normal/Large
Background Transparency: 0-50, separate from visual transparency
VISUAL ELEMENTS EXPLAINED
1. Accretion Disk (Background Gradient):
A three-layer gradient background that intensifies as the tensor approaches extremes. The outer disk appears at any non-neutral reading, the inner disk activates above 70 or below 30, and the core layer appears above 85 or below 15. Color indicates direction (cyan = bullish, red = bearish). This provides instant visual feedback on market pressure intensity.
2. Gravitational Field Lines (EMAs):
Two trend-following EMAs (10 and 30 period) visualized as colored lines. These represent the "curvature" of market trend - when they diverge, trend is strong; when they converge, trend is weakening. Crossovers mark potential trend reversals.
3. Field Reversals (Circles):
Small circles appear when the fast EMA crosses the slow EMA, indicating a potential trend change. These are distinct from extreme events and appear at normal market structure shifts.
4. Singularity Diamonds:
Small diamond shapes appear when the tensor reaches extreme levels (>90 or <10) but doesn't meet the full signal criteria. These are "watch" events - extreme pressure exists but directional confirmation is lacking.
5. Energy Particles (Dots):
Tiny dots appear when volume exceeds 2× average, indicating significant participation. Color matches bar direction. These highlight genuine high-conviction moves versus low-volume drifts.
6. Event Horizon Flash:
A golden background flash appears the instant any extreme threshold is breached, before directional analysis. This alerts you to pay attention.
7. Signal Background Flash:
When a full buy/sell signal is confirmed, the background flashes cyan (buy) or red (sell). This is your primary alert that all conditions are met.
8. Signal Triangles:
The actual buy (▲) and sell (▼) markers. These only appear when ALL selected confirmation criteria are satisfied. Position is offset from bars to avoid overlap with other indicators.
DASHBOARD METRICS EXPLAINED
The dashboard displays real-time calculated values:
Event Density: Current tensor value (0-100). Above 90 or below 10 = critical. Icon changes: 🔥 (extreme high), ❄️ (extreme low), ○ (neutral).
Time Dilation (γ): Current volatility ratio squared. Values >2.0 indicate extreme volatility environments. >1.5 = elevated, >1.0 = above average. Icon: ⚡ (extreme), ⚠ (elevated), ○ (normal).
Mass (Vol): Log-transformed volume value. Compared to volume ratio (current/average). Icon: ● (>2× avg), ◐ (>1× avg), ○ (below avg).
Velocity (ΔP): Raw price change. Direction arrow indicates momentum direction. Shows the actual price delta value.
Bullish Flux: Current bullish context score. Displayed as both a bar chart (visual) and numeric value. Brighter when bullish score dominates.
Bearish Flux: Current bearish context score. Same visualization as bullish flux. These scores compete - the winner determines signal direction.
Field: Trend direction based on EMA relationship. "Repulsive" (uptrend), "Attractive" (downtrend), "Neutral" (ranging). Icon: ⬆⬇↔
State: Current market condition:
🚀 EJECTION: Buy signal active
💥 COLLAPSE: Sell signal active
⚠ CRITICAL: Extreme event, no directional confirmation
● STABLE: Normal market conditions
HOW TO USE THE INDICATOR
1. Wait for Extreme Events:
The indicator is designed to be selective. Don't trade every fluctuation - wait for tensor to reach >90 or <10. This alone is not a signal.
2. Check Context Scores:
Look at the Bullish Flux vs Bearish Flux in the dashboard. If scores are close (within 1-2 points), the market is indecisive - skip the trade.
3. Confirm with Signals:
Only act when a full triangle signal appears (▲ or ▼). This means ALL your selected confirmation criteria have been met.
4. Use with Price Structure:
Combine with support/resistance levels. A buy signal AT support is higher probability than a buy signal in the middle of nowhere.
5. Respect the Dashboard State:
When State shows "CRITICAL" (⚠), it means extreme pressure exists but direction is unclear. These are the most dangerous moments - wait for resolution.
6. Volume Matters:
Energy particles (dots) and the Mass metric tell you if institutions are participating. Signals without volume confirmation are lower probability.
MARKET AND TIMEFRAME RECOMMENDATIONS
Scalping (1m-5m):
Lookback: 10-14
Smoothing: 5-7
Threshold: 85
Epsilon: 0.5-0.7
Note: Expect more noise. Confirm with Level 2 data. Best on highly liquid instruments.
Intraday (15m-1h):
Lookback: 20-30 (default settings work well)
Smoothing: 3-5
Threshold: 90
Epsilon: 1.0
Note: Sweet spot for the indicator. High win rate on liquid stocks, forex majors, and crypto.
Swing Trading (4h-1D):
Lookback: 30-50
Smoothing: 3
Threshold: 90-95
Epsilon: 1.5-2.0
Note: Signals are rare but high conviction. Combine with higher timeframe trend analysis.
Position Trading (1D-1W):
Lookback: 50-100
Smoothing: 5-7
Threshold: 95
Epsilon: 2.0-3.0
Note: Extremely rare signals. Only trade the most extreme events. Expect massive moves.
Market-Specific Settings:
Forex (EUR/USD, GBP/USD, etc.):
Volume data is unreliable (spot forex has no centralized volume)
Disable "Require Volume Confirmation"
Focus on momentum and trend filters
News events create extreme singularities
Best on 15m-1h timeframes
Stocks (High-Volume Equities):
Volume confirmation is CRITICAL - keep it ON
Works excellently on AAPL, TSLA, SPY, etc.
Morning session (9:30-11:00 ET) shows highest event density
Earnings announcements create guaranteed extreme events
Best on 5m-1h for day trading, 1D for swing trading
Crypto (BTC, ETH, major alts):
Reduce threshold to 85 (crypto has constant high volatility)
Volume spikes are THE primary signal - keep volume confirmation ON
Works exceptionally well due to 24/7 trading and high volatility
Epsilon can be reduced to 0.7-0.8 for more signals
Best on 15m-4h timeframes
Commodities (Gold, Oil, etc.):
Gold responds to macro events (Fed announcements, geopolitical events)
Oil responds to supply shocks
Use daily timeframe minimum
Increase lookback to 50+
These are slow-moving markets - be patient
Indices (SPX, NDX, etc.):
Institutional volume matters - keep volume confirmation ON
Opening hour (9:30-10:30 ET) = highest singularity probability
Strong correlation with VIX - high VIX = more extreme events
Best on 15m-1h for day trading
WHAT MAKES THIS INDICATOR UNIQUE
1. Post-Normalization Sensitivity Control:
Unlike most oscillators where sensitivity controls don't actually work (they're applied before normalization, which then rescales everything), FTS applies epsilon compression AFTER normalization. This means the sensitivity parameter genuinely affects signal frequency. This is a novel implementation not found in standard oscillators.
2. Multi-Factor Confluence Requirement:
The indicator doesn't just detect "overbought" or "oversold" - it detects extreme conditions AND THEN analyzes context through five separate factors (price structure, momentum, trend, acceleration, volume). Most indicators are single-factor; FTS requires confluence.
3. Volatility-Weighted Normalization:
By squaring the ATR ratio (local/global), the indicator adapts to changing market regimes. A 1% move in a low-volatility environment is treated differently than a 1% move in a high-volatility environment. Traditional indicators treat all moves equally regardless of context.
4. Volume Integration at the Core:
Volume isn't an afterthought or optional filter - it's baked into the fundamental equation as "mass." The log transformation handles outliers elegantly while preserving significance. Most price-based indicators completely ignore volume.
5. Adaptive Scoring System:
Rather than fixed buy/sell rules ("RSI >70 = sell"), FTS uses competitive scoring where bullish and bearish evidence compete. The winner determines direction. This solves the classic problem of "overbought markets can stay overbought during strong uptrends."
6. Comprehensive Visual Feedback:
The multi-layer visualization system (accretion disk, field lines, particles, flashes) provides instant intuitive feedback on market state without requiring dashboard reading. You can see pressure building before extreme thresholds are hit.
7. Separate Extreme Detection and Signal Generation:
"Singularity diamonds" show extreme events that don't meet full criteria, while "signal triangles" only appear when ALL conditions are met. This distinction helps traders understand when pressure exists versus when it's actionable.
COMPARISON TO EXISTING INDICATORS
vs. RSI/Stochastic:
These normalize price relative to recent range. FTS normalizes (price change × log volume × volatility ratio) - a composite metric, not just price position.
vs. Chaikin Money Flow:
CMF combines price and volume but lacks volatility context and doesn't use adaptive normalization or post-normalization compression.
vs. Bollinger Bands + Volume:
Bollinger Bands show volatility but don't integrate volume or create a unified oscillator. They're separate components, not synthesized.
vs. MACD:
MACD is pure momentum. FTS combines momentum with volume weighting and volatility context, plus provides a normalized 0-100 scale.
The specific combination of log-volume weighting, squared volatility amplification, post-normalization epsilon compression, and multi-factor directional scoring is unique to this indicator.
LIMITATIONS AND PROPER DISCLOSURE
Not a Holy Grail:
No indicator is perfect. This tool identifies high-probability setups but cannot predict the future. Losses will occur. Use proper risk management.
Requires Confirmation:
Best used in conjunction with price action analysis, support/resistance levels, and higher timeframe trend. Don't trade signals blindly.
Volume Data Dependency:
On forex (spot) and some low-volume instruments, volume data is unreliable or tick-volume only. Disable volume confirmation in these cases.
Lagging Components:
The EMA smoothing and trend filters are inherently lagging. In extremely fast moves, signals may appear after the initial thrust.
Extreme Event Rarity:
With conservative settings (high threshold, high epsilon), signals can be rare. This is by design - quality over quantity. If you need more frequent signals, reduce threshold to 85 and epsilon to 0.7.
Not Financial Advice:
This indicator is an analytical tool. All trading decisions and their consequences are solely your responsibility. Past performance does not guarantee future results.
BEST PRACTICES
Don't trade every singularity - wait for context confirmation
Higher timeframes = higher reliability
Combine with support/resistance for entry refinement
Volume confirmation is CRITICAL for stocks/crypto (toggle off only for forex)
During major news events, singularities are inevitable but direction may be uncertain - use wider stops
When bullish and bearish flux scores are close, skip the trade
Test settings on your specific instrument/timeframe before live trading
Use the dashboard actively - it contains critical diagnostic information
Taking you to school. — Dskyz, Trade with insight. Trade with anticipation.

Coinbase Premium Index (Custom Tickers)📊 Coinbase Premium Index (Auto Symbol Support)
1. Overview
The Coinbase Premium Index is a widely used indicator to gauge the sentiment difference between US institutional investors (Coinbase Pro) and global retail/futures traders (Binance).
This script calculates the percentage difference between the Coinbase (USD pair) price and the Binance (USDT pair) price.
2. Key Features
🔄 Auto Symbol Matching (New): You no longer need to manually change tickers when switching charts.
If you are looking at a SOL/USDT chart, the indicator automatically detects "SOL" and compares COINBASE:SOLUSD vs BINANCE:SOLUSDT.
🛠 Manual Mode: Includes a manual override option if you wish to compare specific fixed tickers (e.g., strictly BTC).
🎨 Dynamic Visuals:
Histogram: Color-coded bars (Green/Red) indicate positive or negative premiums.
Smart Label: Displays the real-time premium value on the chart. The label color adapts to the trend, and hovering over it shows a Tooltip confirming exactly which tickers are being compared.
3. How to Interpret
The premium indicates the flow of funds and buying pressure:
🟢 Positive Premium (Green Bar):
Coinbase Price > Binance Price
Interpretation: Strong buying pressure from US institutions or spot whales. Often considered a Bullish signal.
🔴 Negative Premium (Red Bar):
Coinbase Price < Binance Price
Interpretation: Strong selling from US investors, or overheated buying in the offshore futures market (Binance). Often considered a Bearish or mean-reversion signal.
4. Settings Guide
Ticker Mode:
Auto (Current Chart): Automatically sets the comparison based on your current chart's base currency (Recommended).
Manual (Custom): Uses the specific tickers defined in the manual input fields below.
Manual Inputs: Enter tickers here if using Manual Mode (Default: COINBASE:BTCUSD vs BINANCE:BTCUSDT).
Bar & Label Settings: Customize colors, transparency, and the vertical position (Y-Offset) of the data label to fit your chart layout.

Rotation SentinelROTATION SENTINEL v1.1 — OVERVIEW
Rotation Sentinel is a macro rotation engine that tracks 10 institutional-grade dominance, liquidity, and trend signals to identify when capital is flowing into altcoins.
Each row outputs Green / Yellow / Red, and the system produces a 0–10 Rotation Score plus a final regime:
🔴 NO ROTATION (0–4)
🟡 ROTATION STARTING (5–6)
🟢 ALTSEASON (7–10)
Use on Daily timeframe for best accuracy.
KEY SIGNALS
1️⃣ BTC.D ex-stables
Shows true BTC vs alt strength.
🟢 Falling = capital rotating into alts.
🔴 Rising = alts bleeding. (Master switch.)
2️⃣ OTHERS.D
Broad altcoin dominance.
🟢 Rising = early alt strength.
🔴 Falling = weak participation.
3️⃣ ETH/BTC
Rotation ignition.
🟢 ETH outperforming = rotation can start.
🔴 ETH lagging = altseason impossible.
4️⃣ STABLE.C.D
Crypto “fear index.”
🟢 Falling = risk-on environment.
🔴 Rising = capital hiding in stables.
5️⃣ USDT.D
Real-time risk positioning.
🟢 Falling = capital deploying.
🔴 Rising = defensive.
6️⃣ TOTAL3 (HTF Trend)
Structural alt market health.
🟢 Above SMA + rising = bullish structure.
🔴 Below SMA + falling = systematic weakness.
7️⃣ TOTAL3 / TOTAL2
Depth of rotation.
🟢 Mid/small caps outperforming = deep rotation.
🔴 Only large caps moving = shallow cycle.
8️⃣ Risk Ratio (OTHERS.D / STABLE.C.D)
Pure risk appetite.
🟢 Alts gaining on stables = risk-on.
9️⃣ OTHERS/BTC
Alt value vs BTC.
🟢 Rising = alts outperforming BTC.
🔟 Liquidation Heatmap (Manual)
Update from Hyblock/Coinalyze.
🟢 Liquidity above = upside easier.
ALTSEASON TRIGGER
Fires only when all 6 core conditions turn GREEN:
BTC.D ex-stables
OTHERS.D
ETH/BTC
STABLE.C.D
TOTAL3 structure
Rotation Score ≥ threshold (default 7)
BEST PRACTICES
Use Daily timeframe (macro rotation, not intraday noise)
Score < 5 → defensive / selective trades
Score 5–6 → early rotation window
Score ≥ 7 → confirmed altseason regime
Let alerts notify you; no need to manually monitor
INCLUDED ALERTS
🚨 ALTSEASON TRIGGERED
⚠️ Rotation Score Crossed Threshold
📈 ETH/BTC Rotation Clock Activated
🔥 OTHERS.D Breaking Higher

Stochastic Ensembling of OutputsStochastic Ensembling of Outputs
🙏🏻 This is a simple tool/method that would solve naturally many well known problems:
“Price reversed 1 tick before the actual level, not executing my limit order”
“I consider intraday trend change by checking whether price is above/below VWAP, but is 1 tick enough? What to do, price is now whipsawing around vwap...”.
“I want to gradually accumulate a position around a chosen anchor. But where exactly should I put my orders? And I want to automate it ofc.“
“All these DSP adepts are telling you about some kind of noise in the markets… But how can I actually see it?”
The easy fix is to make things more analog less digital, by synthesizing numerous noise instances & adding it to any price-applied metric of yours. The ones who fw techno & psytrance, and other music, probably don’t need any more explanations. Then by checking not just 2 lines or 1 process against another one, you will be checking cloud vs cloud of lines, even allowing you to introduce proxies of probabilities. More crosses -> more confirmation to act.
How-to use:
The tool has 2 inputs: source and target:
Sources should always be the underlying process. If you apply the tool to price based metric, leave it hlcc4 unless you have a better one point estimate for each bar;
Target is your target, e.g if you want to apply it to VWAP, pick VWAP as target. You can thee on the chart above how trading activity recently never exactly touched VWAP, however noised instances of VWAP 'were' touched
The code is clean and written in modular form, you can simply copy paste it to any script of yours if you don't want to have multiple study-on-study script pairs.
^^ applied to prev days highs and lows
^^ applied to MBAD extensions and basis
^^ applied to input series itself
Here’s how it works, no ML, no “AI”, no 1k lines of code, just stats:
The problem with metrics, even if they are time aware like WMA, is that they still do not directly gain information about “changes” between datapoints. If we pick noise characteristics to match these changes, we’d effectively introduce this info into our ops.
^^ this screenshot represents 2 very different processes: a sine wave and white noise, see how the noise instances learned from each process differ significantly.
Changes can be represented as AR1 process . It’s dead simple, no PHD needed, it’s just how the current datapoint is related (or not) to the previous datapoint, no more than 1, and how this relationship holds/evolves over time. Unlike the mainstream approach like MLE, I estimate this relationship (phi parameter) via MoM but giving more weights to more recent datapoints via exponential smoothing over all the data available on your charts (so I encode temporal information), algocomplexity is O(1), lighting fast, just one pass. <- that gives phi , we’d use it as color for our noise generator
Then we just need to estimate noise amplitude ( gamma ) via checking what AR1 model actually thought vs the reality, variance of these innovations. Same via exponential smoothing, time aware, O(1), one pass, it’s all it does.
Then we generate white gaussian noise, and apply 2 estimated parameters (phi and gamma), and that’s all.
Omg, I think I just made my first real DSP script xd
Just like Monte Carlo for risk management, this is so simple and natural I can’t believe so many “pros” hide it and never talk about it in open access. Sharing it here on TradingView would’ve not done anything critical for em, but many would’ve benefited.
∞

[ArchLabs] Support & Resitance Levels Support & Resistance Levels — SR-v1.100
Smart, auto-managed zones for clean market structure
⸻
🔍 What this indicator does
This script automatically finds and maintains high-quality support & resistance zones on your chart, so you don’t have to keep redrawing levels by hand.
It:
• Detects major swing highs and lows (pivots)
• Builds support and resistance zones (not just thin lines)
• Filters out overlapping / redundant levels
• Tracks how price interacts with those zones in real time
• Marks and alerts:
• ✅ Breakouts
• 🚨 False breakouts
• 🔁 Retests
• Flips broken support → resistance and resistance → support automatically
You get a clean structural map of the market, continuously updated.
⸻
🧠 How levels are built (conceptually)
1. The indicator looks back over a configurable window and finds significant highs and lows (pivots).
2. From each confirmed pivot, it creates:
• A core level price (horizontal line)
• A price area around it (shaded zone), sized relative to recent price range/volatility
3. It then checks for overlaps between existing levels and new candidates:
• If a new level is too close to an existing one (within your overlap threshold), it gets discarded.
• This keeps only the most meaningful, non-redundant levels on the chart.
4. A cap of around 10 levels per side (support / resistance) keeps the view readable.
The result: a curated set of zones that actually matter, not a wall of lines.
⸻
🎨 Visuals on the chart
You’ll see:
• Support zones
• Line: bullish color (default green)
• Area: semi-transparent band below/around the line
• Resistance zones
• Line: bearish color (default red)
• Area: semi-transparent band above/around the line
Colors are customizable for:
• Level line
• Zone area
• Breakout highlight
• Retest label
This makes it easy to visually separate support vs resistance and quickly spot key reactions.
⸻
⚡ Dynamic behavior & level lifecycle
Each level goes through a natural “life cycle,” which the indicator tracks for you:
1. Active zone
• The level is valid and extended to the right as long as price stays “engaged” with it (using smoothed highs/lows to avoid noise).
2. Extension / pause
• When price pulls away from the level far enough, the extension can temporarily stop so the level doesn’t stretch indefinitely without interaction.
• If price comes back into the zone with meaningful action, the level can resume extension.
3. Break & role reversal
• When price cleanly breaks the level (based on smoothed price, not just a wick), the zone is:
• Stopped and locked in place
• Marked as broken
• Immediately cloned and flipped:
• Broken support becomes a new resistance zone at the same area.
• Broken resistance becomes a new support zone.
This gives you automatic role-reversal levels without manually redrawing anything.
⸻
🧷 Event tags & alerts
The indicator tracks three key interactions with each zone:
1. Breakouts (optional)
When price decisively breaks a level:
• A small breakout label appears on/near the level:
• Support broken → bearish breakout style
• Resistance broken → bullish breakout style
• An alert message is fired (if alerts are enabled on the script)
Use this to catch true structural breaks that may signal trend continuation or regime change.
⸻
2. False breakouts (optional)
False breakouts are marked when price:
• Wicks through a level, but
• Fails to close beyond it and quickly returns inside the zone
When detected:
• A 🚨 FB label appears at the level
• The label tracks with price while the false breakout is active
• An alert can fire each time this behavior is confirmed
This is very useful for reversal traders and anyone fading failed breakouts.
⸻
3. Retests (optional)
Retests are detected when:
• Price re-enters a zone after previously moving away from it
• The candle comes back into the area for the first time in this new approach
The script:
• Marks the retest with a “T” label in a distinct color for support vs resistance
• Brings that level to the top of the internal priority list, keeping fresh retests visually and logically “hot”
Traders often use these as high-probability reaction points (e.g., breakout → retest → continuation).
⸻
⚙️ Key settings
All inputs are grouped for clarity:
Support / Resistance Levels
• Pivots Lookback
Controls how far back the indicator looks for swing highs/lows.
• Higher value → fewer, stronger levels
• Lower value → more reactive, more levels
• Overlap Multiplier (Pips)
Sets how aggressively overlapping levels are merged/ignored.
• Higher value → fewer levels, more consolidation
• Lower value → more granular levels
• Auto Overlap
When enabled, the script automatically adjusts the overlap threshold based on timeframe:
• Intraday lower timeframes → tighter filtering
• Higher/intra-session → more appropriate scaling
This lets you drop the indicator on multiple timeframes without constantly retuning.
⸻
Level Event Toggles
• Breakout Labels & Alerts (on/off)
• False Breakout Labels & Alerts (on/off)
• Retest Labels & Alerts (on/off)
Turn on only what fits your style.
Scalpers might want all three; swing traders may prefer only breakouts + retests.
⸻
Support / Resistance Colors
Separate color groups for:
• Line & area of support levels
• Line & area of resistance levels
• Visual styling for breakouts
• Visual styling for retests
You can match your existing chart theme or build a dedicated SR layout.
⸻
📈 How to use it in your trading
Here are a few practical ways to integrate this indicator:
• Context map
Use it as a structural overlay on any symbol/timeframe to see where price is likely to react.
• Breakout + retest setups
• Wait for a level to break with a breakout label.
• Then watch for a T (retest) label into the flipped zone.
• Combine with your own confirmation (price action, volume, oscillators, etc.).
• Mean-reversion & fade trades
• Hunt for false breakout (FB) labels on key levels.
• These are often good spots to fade aggressive moves that lose momentum.
• Confluence builder
• Combine zones with trend tools, VR/DC, moving averages, or higher timeframe structure.
• A breakout/retest at a level that also lines up with higher TF structure can be especially meaningful.
⸻
✅ Summary
Support & Resistance Levels (SR-v1.100) is designed to be:
• Clean – no cluttered spaghetti of lines
• Adaptive – zones evolve with the market and flip roles automatically
• Actionable – breakout, false breakout, and retest events are clearly marked and alert-ready
• Flexible – works on any market and timeframe with simple, intuitive inputs
Drop it on your chart, tune the lookback & overlap to your style, and let it handle the heavy lifting of structural mapping while you focus on decisions.

EMA MTF Trend Dashboard (Cross & Bias Modes)EMA MTF Trend Dashboard (Cross & Bias Modes)
A clean, multi-timeframe trend-alignment tool designed to support disciplined entries and higher-probability trades.
________________________________________
🔍 What This Dashboard Does
The EMA MTF Trend Dashboard provides a clear, structured view of trend direction across seven key timeframes:
1m • 5m • 15m • 30m • 1H • 4H • Daily
It highlights your execution timeframe, displays EMA-based trend direction per timeframe, and produces a plain-English directional bias using either Single EMA mode or Dual EMA Cross mode.
This makes it useful for scalpers, intraday traders, swing traders, and anyone who wants clarity before executing a trade.
________________________________________
🧠 How to Read the Dashboard
1. Execution Timeframe (Blue Row)
The blue row is your execution timeframe — the timeframe used to calculate the final bias.
• In Chart mode, it automatically matches your current chart timeframe.
• In Locked mode, it remains fixed, even if you switch to other chart timeframes.
This ensures consistency and removes any ambiguity before entering a trade.
________________________________________
2. EMA Mode (Use Any Length You Like)
You’re free to choose any EMA lengths — the dashboard adapts to your strategy.
• Smaller EMAs (5–20):
React quickly and highlight short-term momentum changes or early trend shifts.
• Larger EMAs (50–200+):
Move more slowly and provide a smoother read of overall trend structure, filtering out low-timeframe noise.
This flexibility lets you tune the dashboard to your preferred approach — whether you want fast tactical signals or slower, more stable directional structure.
________________________________________
3. Cross & Bias Modes
The dashboard supports two core engines:
✔ Single EMA Mode (Price vs EMA + ATR Neutral Buffer)
A trend-following model that avoids false signals when price is close to the EMA.
✔ Dual EMA Cross Mode (Fast vs Slow EMA)
A crossover-based trend engine ideal for traders who prefer structure shifts based on EMA alignment.
You can switch modes instantly from the settings.
________________________________________
4. Bias (Plain-English Trend Assessment)
The bias row at the bottom shows the overall directional bias for the blue timeframe, calculated using weighted multi-timeframe logic:
• Strong Bull
• Bullish
• Neutral
• Bearish
• Strong Bear
This provides instant clarity on whether market conditions support (or conflict with) your trade idea.
________________________________________
5. Trend Table (Heatmap View)
Each timeframe shows:
• ▲ Bullish
• ▼ Bearish
• – Neutral
Colour coded for clarity:
• Green = bullish
• Red = bearish
• Grey = neutral
• Blue = execution timeframe highlight
This creates a clean, at-a-glance trend heatmap.
________________________________________
⚙️ Customisation Options
• Fully adjustable EMA lengths
• Single EMA mode (with ATR neutral zone)
• Dual EMA Cross mode (fast/slow)
• Selectable text colour (dark/light theme friendly)
• Execution timeframe mode: Chart or Locked
• Compact and visually clear table layout
________________________________________
✔ Why This Tool Helps
This dashboard gives traders a structured, rule-aligned view of trend direction by:
• Keeping you aligned with broader multi-timeframe structure
• Reducing counter-trend mistakes
• Clarifying trend shifts and momentum changes
• Making decision-making faster and more consistent
• Supporting any systematic or rule-based trading plan
It is a decision-support tool, not a buy/sell signal — making it useful for all trading styles.
________________________________________
📌 Notes for Users
• Non-repainting (uses confirmed closes)
• Works universally: Forex, crypto, indices, commodities
• Suitable for scalpers, day-traders, swing traders
________________________________________
💬 Feedback & Future Enhancements
If you’d like to see additional timeframes, alternative trend engines, an ultra-compact mode, or alert integrations, feel free to request upgrades.

Market Profile Dominance Analyzer# Market Profile Dominance Analyzer
## 📊 OVERVIEW
**Market Profile Dominance Analyzer** is an advanced multi-factor indicator that combines Market Profile methodology with composite dominance scoring to identify buyer and seller strength across higher timeframes. Unlike traditional volume profile indicators that only show volume distribution, or simple buyer/seller indicators that only compare candle colors, this script integrates six distinct analytical components into a unified dominance measurement system.
This indicator helps traders understand **WHO controls the market** by analyzing price position relative to Market Profile key levels (POC, Value Area) combined with volume distribution, momentum, and trend characteristics.
## 🎯 WHAT MAKES THIS ORIGINAL
### **Hybrid Analytical Approach**
This indicator uniquely combines two separate methodologies that are typically analyzed independently:
1. **Market Profile Analysis** - Calculates Point of Control (POC) and Value Area (VA) using volume distribution across price channels on higher timeframes
2. **Multi-Factor Dominance Scoring** - Weights six independent factors to produce a composite dominance index
### **Six-Factor Composite Analysis**
The dominance score integrates:
- Price position relative to POC (equilibrium assessment)
- Price position relative to Value Area boundaries (acceptance/rejection zones)
- Volume imbalance within Value Area (institutional bias detection)
- Price momentum (directional strength)
- Volume trend comparison (participation analysis)
- Normalized Value Area position (precise location within fair value zone)
### **Adaptive Higher Timeframe Integration**
The script features an intelligent auto-selection system that automatically chooses appropriate higher timeframes based on the current chart period, ensuring optimal Market Profile structure regardless of the trading timeframe being analyzed.
## 💡 HOW IT WORKS
### **Market Profile Construction**
The indicator builds a Market Profile structure on a higher timeframe by:
1. **Session Identification** - Detects new higher timeframe sessions using `request.security()` to ensure accurate period boundaries
2. **Data Accumulation** - Stores high, low, and volume data for all bars within the current higher timeframe session
3. **Channel Distribution** - Divides the session's price range into configurable channels (default: 20 rows)
4. **Volume Mapping** - Distributes each bar's volume proportionally across all price channels it touched
### **Key Level Calculation**
**Point of Control (POC)**
- Identifies the price channel with the highest accumulated volume
- Represents the price level where the most trading activity occurred
- Serves as a magnetic level where price often returns
**Value Area (VA)**
- Starts at POC and expands both upward and downward
- Includes channels until reaching the specified percentage of total volume (default: 70%)
- Expansion algorithm compares adjacent volumes and prioritizes the direction with higher activity
- Defines the "fair value" zone where most market participants agreed to trade
### **Dominance Score Formula**
```
Dominance Score = (price_vs_poc × 10) +
(price_vs_va × 5) +
(volume_imbalance × 0.5) +
(price_momentum × 100) +
(volume_trend × 5) +
(va_position × 15)
```
**Component Breakdown:**
- **price_vs_poc**: +1 if above POC, -1 if below (shows which side of equilibrium)
- **price_vs_va**: +2 if above VAH, -2 if below VAL, 0 if inside VA
- **volume_imbalance**: Percentage difference between upper and lower VA volumes
- **price_momentum**: 5-period SMA of price change (directional acceleration)
- **volume_trend**: Compares 5-period vs 20-period volume averages
- **va_position**: Normalized position within Value Area (-1 to +1)
The composite score is then smoothed using EMA with configurable sensitivity to reduce noise while maintaining responsiveness.
### **Market State Determination**
- **BUYERS Dominant**: Smooth dominance > +10 (bullish control)
- **SELLERS Dominant**: Smooth dominance < -10 (bearish control)
- **NEUTRAL**: Between -10 and +10 (balanced market)
## 📈 HOW TO USE THIS INDICATOR
### **Trend Identification**
- **Green background** indicates buyers are in control - look for long opportunities
- **Red background** indicates sellers are in control - look for short opportunities
- **Gray background** indicates neutral market - consider range-bound strategies
### **Signal Interpretation**
**Buy Signals** (green triangle) appear when:
- Dominance crosses above -10 from oversold conditions
- Previous state was not already bullish
- Suggests shift from seller to buyer control
**Sell Signals** (red triangle) appear when:
- Dominance crosses below +10 from overbought conditions
- Previous state was not already bearish
- Suggests shift from buyer to seller control
### **Value Area Context**
Monitor the information table (top-right) to understand market structure:
- **Price vs POC**: Shows if trading above/below equilibrium
- **Volume Imbalance**: Positive values favor buyers, negative favors sellers
- **Market State**: Current dominant force (BUYERS/SELLERS/NEUTRAL)
### **Multi-Timeframe Strategy**
The auto-timeframe feature analyzes higher timeframe structure:
- On 1-minute charts → analyzes 2-hour structure
- On 5-minute charts → analyzes Daily structure
- On 15-minute charts → analyzes Weekly structure
- On Daily charts → analyzes Yearly structure
This higher timeframe context helps avoid counter-trend trades against the dominant force.
### **Confluence Trading**
Strongest signals occur when multiple factors align:
1. Price above VAH + positive volume imbalance + buyers dominant = Strong bullish setup
2. Price below VAL + negative volume imbalance + sellers dominant = Strong bearish setup
3. Price at POC + neutral state = Potential breakout/breakdown pivot
## ⚙️ INPUT PARAMETERS
- **Higher Time Frame**: Select specific HTF or use 'Auto' for intelligent selection
- **Value Area %**: Percentage of volume contained in VA (default: 70%)
- **Show Buy/Sell Signals**: Toggle signal triangles visibility
- **Show Dominance Histogram**: Toggle histogram display
- **Signal Sensitivity**: EMA period for dominance smoothing (1-20, default: 5)
- **Number of Channels**: Market Profile resolution (10-50, default: 20)
- **Color Settings**: Customize buyer, seller, and neutral colors
## 🎨 VISUAL ELEMENTS
- **Histogram**: Shows smoothed dominance score (green = buyers, red = sellers)
- **Zero Line**: Neutral equilibrium reference
- **Overbought/Oversold Lines**: ±50 levels marking extreme dominance
- **Background Color**: Highlights current market state
- **Information Table**: Displays key metrics (state, dominance, POC relationship, volume imbalance, timeframe, bars in session, total volume)
- **Signal Shapes**: Triangle markers for buy/sell signals
## 🔔 ALERTS
The indicator includes three alert conditions:
1. **Buyers Dominate** - Fires on buy signal crossovers
2. **Sellers Dominate** - Fires on sell signal crossovers
3. **Dominance Shift** - Fires when dominance crosses zero line
## 📊 BEST PRACTICES
### **Timeframe Selection**
- **Scalping (1-5min)**: Focus on 2H-4H dominance shifts
- **Day Trading (15-60min)**: Monitor Daily and Weekly structure
- **Swing Trading (4H-Daily)**: Track Weekly and Monthly dominance
### **Confirmation Strategies**
1. **Trend Following**: Enter in direction of dominance above/below ±20
2. **Reversal Trading**: Fade extreme readings beyond ±50 when diverging with price
3. **Breakout Trading**: Look for dominance expansion beyond ±30 with increasing volume
### **Risk Management**
- Avoid trading during NEUTRAL states (dominance between -10 and +10)
- Use POC levels as logical stop-loss placement
- Consider VAH/VAL as profit targets for mean reversion
## ⚠️ LIMITATIONS & WARNINGS
**Data Requirements**
- Requires sufficient historical data on current chart (minimum 100 bars recommended)
- Lower timeframes may show fewer bars per HTF session initially
- More accurate results after several complete HTF sessions have formed
**Not a Standalone System**
- This indicator analyzes market structure and participant control
- Should be combined with price action, support/resistance, and risk management
- Does not guarantee profitable trades - past dominance does not predict future results
**Repainting Characteristics**
- Higher timeframe levels (POC, VAH, VAL) update as new bars form within the session
- Dominance score recalculates with each new bar
- Historical signals remain fixed, but current session data is developing
**Volume Limitations**
- Uses exchange-provided volume data which varies by instrument type
- Forex and some CFDs use tick volume (not actual transaction volume)
- Most accurate on instruments with reliable volume data (stocks, futures, crypto)
## 🔍 TECHNICAL NOTES
**Performance Optimization**
- Uses `max_bars_back=5000` for extended historical analysis
- Efficient array management prevents memory issues
- Automatic cleanup of session data on new period
**Calculation Method**
- Market Profile uses actual volume distribution, not TPO (Time Price Opportunity)
- Value Area expansion follows traditional Market Profile auction theory
- All calculations occur on the chart's current symbol and timeframe
## 📚 EDUCATIONAL VALUE
This indicator helps traders understand:
- How institutional traders use Market Profile to identify fair value
- The relationship between price, volume, and market acceptance
- Multi-factor analysis techniques for assessing market conditions
- The importance of higher timeframe structure in trade planning
## 🎓 RECOMMENDED READING
To better understand the concepts behind this indicator:
- "Mind Over Markets" by James Dalton (Market Profile foundations)
- "Markets in Profile" by James Dalton (Value Area analysis)
- Volume Profile analysis in institutional trading
## 💬 USAGE TERMS
This indicator is provided as an educational and analytical tool. It does not constitute financial advice, investment recommendations, or trading signals. Users are responsible for their own trading decisions and should conduct their own research and due diligence.
Trading involves substantial risk of loss. Past performance does not guarantee future results. Always use proper risk management and never risk more than you can afford to lose.

Gold vs. Dollar Sentiment Map [SB1]🟡 Gold vs Dollar Sentiment Map
The Gold vs Dollar Sentiment Map reveals the direct inverse relationship between Gold Futures (GC) and the U.S. Dollar Index (DXY) — one of the most reliable global risk-sentiment gauges.
It helps traders instantly identify whether capital is flowing into safety (Gold) or into the Dollar (risk assets) during any session or timeframe.
🔍 Core Logic
Risk-Off (Bearish background = Red): DXY ↓ and Gold ↑ → investors seeking safety, rising fear or falling yields.
Risk-On (Bullish background = Green): DXY ↑ and Gold ↓ → investors rotating into risk assets, stronger USD demand.
Neutral (Gray): Mixed signals – no dominant macro driver.
📊 Dashboard
A compact on-chart table displays real-time trend bias for:
Gold (GC) – Bullish / Bearish / Neutral
U.S. Dollar Index (DXY) – Bullish / Bearish / Neutral
Color shading reflects each asset’s intrabar momentum.
⚙️ Visual Features
Adaptive background colors to show sentiment shifts.
Strong candle markers highlighting momentum bars near range extremes.
Alerts for clear Risk-On / Risk-Off alignment.
🧭 How to Use
Red background (Risk-Off): Gold strength + Dollar weakness → favorable environment for long gold setups.
Green background (Risk-On): Dollar strength + Gold weakness → bias toward short gold or avoid long exposure.
Gray background: Stay patient; look for confirmation or wait for alignment.
💡 Ideal For
Gold and Forex traders monitoring macro rotation.
Sentiment confirmation alongside order-flow, VWAP, or volume-delta tools.
Overlaying on intraday or higher-timeframe charts to frame trade bias.

Slick Strategy Weekly PCS TesterInspired by the book “The Slick Strategy: A Unique Profitable Options Trading Method.” This indicator tests weekly SPX put-credit spreads set below Monday’s open and judged at Friday’s close.
WHAT IT DOES
• Sets weekly PCS level = Monday (or first trading day) OPEN − your offset; win/loss checked at Friday close.
• Optional core filter at entry: Price ≥ 200-SMA AND 10-SMA ≥ 20-SMA; pause if Price < both 10 & 20 while > 200.
• Reference modes: Strict = Mon OPEN vs Fri SMAs (no repaint); Mid = Mon OPEN vs Mon SMAs
KEY INPUTS
• Date range (Start/End) to limit backtest window.
• Offset mode/value (Points or Percent).
• Entry day (Monday only or first trading day).
• Core filters (On/Off) and Strict/Mid reference.
• SMA settings (source; 10/20/200 lengths).
• Table settings (position, size, padding, border).
VISUALS
• Active week line: Orange = trade taken; Gray = skipped.
• History: Green = win; Red = loss; Purple = skipped.
• Optional week bands highlight active/win/loss/skipped weeks (adjustable opacity).
TABLE
• Shows Date range, Trades, Wins, Losses, Win rate, and Active level (this week’s PCS price).
NOTES
• PCS level freezes at week open and persists through the week.

Trend (5m & 1h) by Ben2010🧭 What it does:
✅ Checks 5 min and 1 hour timeframes (you can change them).
✅ Evaluates:
RSI: momentum
MACD: direction
VWAP: price vs fair value
Volume: buyers vs sellers
Price structure: Higher High or Lower Low
✅ Combines all into a qualitative strength label (Very Bullish → Very Bearish).
✅ Displays everything in a neat table at the top-right corner.
MPO4 Lines – Modal Engine█ OVERVIEW
MPO4 Lines – Modal Engine is an advanced multi-line modal oscillator for TradingView, designed to detect momentum shifts, trend strength, and reversal points through candle-based pressure analysis with multiple fast lines and a reference slow line. It features divergence detection on Fast Line A, overbought/oversold return signals, dynamic coloring modes, and layered gradient visualizations for enhanced clarity and decision-making.
█ CONCEPT
The indicator is built upon the Market Pressure Oscillator (MPO) and serves as its expanded evolution, aimed at enabling broader market analysis through multiple lines with varying parameters. It calculates modal pressure using candle body size and direction, weighted against average body size over a lookback period, then normalized and smoothed via EMA. It generates four distinct oscillator lines: a heavily smoothed Slow Line (trend reference), two Fast Lines (A & B) for momentum and support/resistance, and an optional Line 4 for additional confirmation. Divergence is calculated solely on Fast Line A, with visual gradients between lines and bands for intuitive interpretation.
█ WHY USE IT?
- Multi-Layer Momentum: Combines slow trend reference with dual fast lines for precise entry/exit timing.
- Divergence Precision: Bullish/bearish divergences on Fast Line A with labeled confirmation.
- OB/OS Return Signals: Clear buy/sell markers when Fast Line A exits oversold/overbought zones.
- Dynamic Visuals: Gradient fills, line-to-line shading, and band gradients for instant market state recognition.
- Flexible Coloring: Slow Line color by direction or zero-position; fast lines by sign.
- Full Customization: Independent lengths, smoothing, visibility, and transparency — by adjusting the lengths of different lines, you can tailor results for various strategies; for example, enabling Line 4 and tuning its length allows trading based on crossovers between different lines.
█ HOW IT WORKS?
- Candle Pressure Calculation: Body = math.abs(close - open); avgBody = ta.sma(body, len). Direction = +1 (bull), –1 (bear), 0 (neutral). Weight = body / avgBody. Contribution = direction × weight.
- Rolling Sum & Normalization: Sums contributions over lookback, normalizes to ±100 scale (÷ (len × 2) × 100).
Smoothing: Applies primary EMA (smoothLen), with extra EMA on Slow Line for stability.
Line Structure:
- Slow Line = calcCPO(len1=20, smoothLen1=5) → extra EMA (5)
- Fast Line A = calcCPO(len2=6, smoothLen2=7)
- Fast Line B = calcCPO(len3=6, smoothLen3=10)
- Line 4 = calcCPO(len4=14, smoothLen4=1)
Divergence Detection: Uses ta.pivothigh/low on price and Fast Line A (pivotLength left/right). Bullish: lower price low + higher osc low. Bearish: higher price high + lower osc high. Valid within 5–60 bar window.
Signals:
- Buy: Fast Line A crosses above oversold (–30)
- Sell: Fast Line A crosses below overbought (+30)
- Slow Line color flip (direction or zero-cross)
- Divergence labels ("Bull" / "Bear")
- Band Coloring as Momentum Signal:
When Fast Line A ≤ Fast Line B → Overbought band turns red (bearish pressure building)
When Fast Line A > Fast Line B → Oversold band turns green (bullish pressure building) This dynamic coloring serves as visual confirmation of momentum shift following fast line crossovers
Visualization:
- Gradients: Fast B → Zero (multi-layer fade), Fast A ↔ B fill, OB/OS bands
- Dynamic colors: Green/red based on sign or trend
- Zero line + dashed OB/OS thresholds
Alerts: Trigger on OB/OS returns, Slow Line changes, and divergences.
█ SETTINGS AND CUSTOMIZATION
- Line Visibility: Toggle Slow, Fast A, Fast B, Line 4 independently.
Line Lengths:
- Slow Line: Base (20), Primary EMA (5), Extra EMA (5)
- Fast A: Lookback (6), EMA (7)
- Fast B: Lookback (6), EMA (10)
- Line 4: Lookback (14), EMA (1)
- Slow Line Coloring Mode: “Direction” (trend-based) or “Position vs Zero”.
- Bands & Thresholds: Overbought (+30), Oversold (–30), step 0.1.
- Signals: Enable Fast A OB/OS return markers (default: on).
- Divergence: Enable/disable, Pivot Length (default: 2, min 1).
- Colors & Appearance: Full control over bullish/bearish hues for all lines, zero, bands, divergence, and text.
Gradients & Transparency:
- Fast B → Zero: 75 (default)
- Fast A ↔ B fill: 50
- Band gradients: 40
- Toggle each gradient independently
█ USAGE EXAMPLES
The indicator allows users to configure various strategies manually, though no built-in alerts exist for them. Entry signals can include color of fast lines, crossovers between different lines, alignment of colors across lines, or consistency in direction.
- Trend Confirmation: Slow Line above zero + green = bullish bias; below + red = bearish.
- Entry Timing: Buy on Fast A crossing above –30 (circle marker), especially if Slow Line is rising or near zero.
- Reversal Setup: Bullish divergence (“Bull” label) + Fast A in oversold + green gradient band = high-probability long.
- Scalping: Fast A vs Fast B crossover in direction of Slow Line trend.
- Noise Reduction: Increase extraSmoothLen on Slow Line
█ USER NOTES
- Best combined with volume, support/resistance, or trend channels.
- Adjust lookback and smoothing to asset volatility.
- Divergence delay = pivotLength; plan entries accordingly.

BK AK-13⚔️ BK AK-13 — The Mentor’s 13. Revealed on 11. Command the Band. Punish the Extremes. ⚔️
This is my 11th release—and that matters. 11 is a sacred number to me, so for release eleven I’m doing something I never planned to do: I’m putting my mentor’s secret 13 MA into the open.
For years, this 13-based MA framework was part of our private playbook—quietly doing work behind the scenes. Now I’m handing it to you fully armed, because I believe in karma in, karma out: I took years of wisdom from the market. I took years of wisdom from the men who taught me. This is one of the ways I give back—with structure, respect, and intent.
🎖 Full Credit — Respect the Origin
The core architecture of BK AK-13 is not mine. It stands firmly on the work of DZIV.
What comes from DZIV:
The Heikin Ashi MA engine (MA calculated on HA Open/High/Low/Close)
The multi-MA engine on the HA feed (ALMA / HMA / SMA / RMA / VWMA / WMA / ZLEMA / EMA)
The Body / Wick / Band zone classification for price
The dynamic body & wick clouds that give this structure its clean visual form
If this framework changes the way you see trend and price location, remember the name: DZIV.
On top of his backbone, I forged the BK AK-13 enhancement layer: trend-strength regimes, background modes, structured band-reversal arrows, momentum acceleration dots, extreme pivot markers, historical band-touch rails, the info panel, and a complete alert suite.
And as always, the “AK” in the name is not branding—it’s honor. It belongs to my mentor A.K. His secret 13 MA is the spine of this system, and his obsession with clarity, patience, and zero shortcuts sits behind every decision in this tool. Above that, all glory and gratitude to Gd—the real source of any wisdom, edge, or endurance we have in this game.
🧠 Why “BK AK-13”?
BK — my mark, the house I’m building.
AK — my mentor, the standard I’m still chasing.
13 — his secret moving average, the length that quietly shaped how I see trend, location, and pressure.
For years, 13 stayed off the public record—used, not discussed. Now, on indicator number 11, I’m putting that weapon in the open: 11th release. Sacred number. Secret 13 revealed, not for hype—but as karmic give-back. Karma in. Karma out.
🧱 What BK AK-13 Actually Is
BK AK-13 is a Heikin Ashi MA battle band with a brain and a conscience.
It does three big things:
Builds a smoothed HA-MA band using Heikin Ashi OHLC to create a cleaner, truer band around price.
Maps price into zones: Body, Upper Wick, Lower Wick, Above Band, Below Band—so every bar has a role.
Assigns a trend regime by computing a normalized trend-strength %, classifying the environment as Weak / Normal / Strong / Extreme.
You’re never guessing: Is this real trend or just drift? Am I in the spine, the wick, or off the rails? Is this where I press, fade, or stand down? The band, zones, and regimes answer that for you.
🎨 Visual Architecture — Band, Clouds, Regimes
Body & Wick Clouds (DZIV’s craft)
Body cloud between HA-MA Open & Close.
Wick clouds between body and HA-MA High/Low.
Color follows trend: bull, bear, or neutral.
You’re not decoding noisy candles—you’re reading the spine and skin of the move.
Background Regime Modes (BK layer)
Standard – background always on, soft trend-follow color.
Hybrid (Extreme + Breaks) – lights only on extreme trend states or reversal break events.
Hybrid (Strong/Extreme + Breaks) – shows strong & extreme regimes, darker tone on true extremes.
Breaks Only – background flashes only on reversal arrows.
When the background goes quiet, you’re in ordinary flow. When it lights up, something is strategic, not cosmetic.
🎯 Weapons Inside BK AK-13
⭐ Trend Change Stars
Stars appear when the internal band trend crosses zero: bull star when it flips negative → positive, bear star from positive → negative. They’re your pivot flags for swing shifts when aligned with your higher timeframe bias.
🔁 Band Reversal Arrows — Edge Flip Logic
Not every band tap—only structured reversals:
Reversal Down (short idea): first a break of the upper band, then later, for the first time, a break of the lower band.
Reversal Up (long idea): first a break of the lower band, then later, for the first time, a break of the upper band.
You can require a close outside the band and set a minimum break distance (% of band range) so only real punches count. These arrows mark campaign flips, not noise.
💡 Momentum Acceleration Dots
In strong trend regimes only:
Green dot = trend accelerating in its own direction (uptrend steepening, downtrend deepening).
Red dot = trend decelerating, even if direction hasn’t flipped yet.
They protect you from chasing late when the engine is dying and from staying stubborn when momentum is bleeding out.
⚠ Extreme Pivot Markers
Pivot highs/lows are found with a configurable lookback and only marked when trend strength at that pivot bar is above your threshold. You’ll see ⚠ above likely exhaustion tops in strong bulls and ⚠ below likely exhaustion lows in strong bears—perfect for final scale-outs, countertrend scouts, and knowing where campaigns commonly run out of blood.
📏 Historical Band-Touch Rails
Over your lookback window, BK AK-13 tracks the highest upper band touch and lowest lower band touch, drawing them as dashed rails. They’re dynamic SR built from real band extremes—ideal for trend targets, fade zones, and stop/scale-out context.
🧭 Info Panel — On-Chart War Room
The Info Panel compresses everything into a single strip: direction + strength codes (BULL STR, BEAR EXT, NEUT WEAK), four segments that brighten as |trend| climbs from weak → normal → strong → extreme, and a zone + deviation label (BDY/UW/LW/AB/BL × OK/AL/EX).
Hover and you get a full tactical brief: trend, momentum change, acceleration, band levels, distances to upper/lower/nearest band in ticks, outer-band streaks, strategic state, plus “Action” guidance and a “What-if” forward scenario. It doesn’t just tell you where you are—it pushes you toward a structured thought process on each bar.
🕹 How to Use BK AK-13 with Intent
1️⃣ Trend-Rider Mode
In Strong/Extreme bull with price in Body or Lower Wick: buy dips into the band (mid/lower) instead of chasing tops; target the upper band / upper rail while structure holds.
In Strong/Extreme bear with price in Body or Upper Wick: sell rallies into the band; target lower band / lower rail while acceleration stays healthy.
The band defines where you’re allowed to do business.
2️⃣ Extreme Snapback Hunter
Prime conditions: trend tagged Extreme, price pressed into the outer band in trend direction, strategic state lit + Hybrid background active. That’s where pressing fresh risk often flips from reward to punishment. Use it to stop adding, start harvesting, or launch controlled mean-reversion probes back to the midline—if your system and risk rules allow it.
3️⃣ Exhaustion & Turn Zones
Watch for confluence: red momentum dots, extreme pivot ⚠ markers, a reversal arrow, and a nearby historical rail or your own key level (Fibs, VWAP, volume structure, etc.). That’s where campaigns often end, traps are set, and new campaigns begin.
🔔 Alerts — The Chart Calls You
Included alerts: Bullish/Bearish Trend Change, Strategic Extreme at Outer Band, Reversal Up/Down, Extreme Pivot High/Low, and Body Zone Entry during Strong Trend. Use them so you respond to events, not impulses.
🔧 Tuning the Extremes — Help Me Perfect the Advanced Side
The extreme thresholds and advanced features are powerful but sensitive, and there is no single perfect universal setting. I’m still tuning them myself across instruments and timeframes: strong/extreme trend thresholds, extreme background thresholds, momentum acceleration threshold, pivot lookback + pivot trend filter, band-touch lookback, and minimum break distance for reversals.
Different markets and timeframes breathe differently.
If you find killer settings for a specific symbol + timeframe, please share:
Instrument & timeframe
Your tuned values for extremes and advanced modules
A few charts showing why they work
Experiment. Dial it in. Then share your best settings for the extremes and advanced features. Let this become a crowd-forged battle manual: I gave you the engine, you tune it to your battleground, and we all benefit from what’s discovered in live fire. Karma in. Karma out.
🤝 Pay It Forward
If BK AK-13 sharpens your read, don’t just flex screenshots—teach structure. Show newer traders body vs wick vs edge. Talk about when you didn’t take a trade because the band said “danger,” not just the wins. Share your settings, charts, and lessons—especially around the extremes and advanced modules. I’m sharing a mentor’s secret on release 11 for a reason. If it blesses you, don’t let it stop with you.
📜 King Solomon’s Lens
King Solomon said: “The prudent sees danger and hides himself, but the simple go on and suffer for it.”
BK AK-13 is built exactly around that dividing line: the simple chase candles at the outer band in extreme regimes and get punished; the prudent see danger in the structure, hide their size, hedge, or reverse with intent.
This indicator won’t make you prudent. It just removes your excuse for being simple.
⚔️ BK AK-13 — The mentor’s secret 13, revealed on 11. Let the band define the field. Let wisdom define your strike.
May Gd bless your eyes, your patience, your settings, and every decision you make at the edge. 🙏

OpenVWAP Stop-Hunt Short – v6 (failsafe) ZorzOpenVWAP Stop-Hunt Short (Micro/Nano Caps)
Intraday short framework for low-float gappers (NASDAQ/NYSE), optimized for 1m (optional 15s). The script anchors VWAP to Premarket and Regular sessions, tracks PM High (PM HOD) and Open VWAP, and flags liquidity grabs.
Signal logic
SHORT when a stop-hunt above PM HOD or an Open VWAP fakeout occurs and the bar closes below Open VWAP (optional confirmation: crossunder VWMA*0.985 “long50”).
CLOSE when price reclaims Open VWAP or crosses above long50.
Inputs
Min wick%, volume spike vs SMA20, range vs ATR(1)
No-trade bars after the open (filters first noisy minutes)
Toggle ACW confirmation (VWMA*0.985)
Notes
Turn Extended Hours ON; session times are ET.
Best on micro/nano-cap gappers with high PM volume; supports alerts (“Open Short”, “Close Short”).
For research/education only; not financial advice.
Dominus US Indici - Core4 (ES,NQ,YM,RTY) - EditabileOne-liner
“Dominus US Indici ranks ES, NQ, YM, RTY at the NY open using a blended Score (return from window start + VWAP delta) to highlight the strongest long/short and give clean BUY/SELL signals.”
Short paragraph
“Dominus US Indici analyzes the four core US indices (ES, NQ, YM, RTY) from the New York open. It builds a single Score by combining momentum from the window start with distance from VWAP, ranks the indices, and flags only the top, high-quality opportunity. Optional ‘Alpha vs S1’ (beta-neutral), macro gate (DXY & US10Y), editable symbols/timezone, and a freeze snapshot keep decisions consistent.”
Bullets
Core4: ES, NQ, YM, RTY (editable).
Score = Return from start + VWAP delta (weighted).
Live table + ranking; threshold → BUY/SELL signals.
Optional Alpha vs S1 and macro filter (DXY, US10Y).
Custom window/timezone + freeze at window end.
If you want, I can add a tighter IG caption + hashtags in your Dominus style.

Sunmool's NY Lunch Model BacktestingICT NY Lunch Model Backtesting (12:00–13:00 NY) 🗽🍔
This research indicator tests an ICT narrative using the New York lunch window (12:00–13:00 America/New_York). It records that hour’s high/low and measures, during the post-lunch session (default 13:00–16:00), how often:
⬆️ If the afternoon trends up, the Lunch Low gets swept first.
⬇️ If the afternoon trends down, the Lunch High gets swept first.
It reports these as conditional probabilities, not trade signals. 📈
👀 What it shows
🟦 Lunch Range box (toggle): high/low from 12:00–13:00 NY
🔻🔺 Sweep signals (bar-anchored)
Low sweep: triangle below bar + optional “L”
High sweep: triangle above bar + optional “H”
🧱 Optional small box wrapping the swept candle
📊 Stats table (top-right)
P(L-swept | Up) — % of Up-days where Lunch Low was swept
P(H-swept | Down) — % of Down-days where Lunch High was swept
🔁 Contradictions + sample sizes (Up-days / Down-days)
🎯 Direction logic (Up/Down)
Anchor: 13:00 open (pmOpen) ⏰
Threshold: ATR × multiple or % from 13:00
Close ≥ pmOpen + threshold → Up-day
Close ≤ pmOpen − threshold → Down-day
Tiny moves under the threshold are ignored to reduce noise 🧹
⚙️ Inputs
🌐 Timezone: America/New_York (DST handled)
🍽️ Lunch window: 1200–1300
🕓 Post-lunch window: default 1300–1600 (try 17:00/20:00 for sensitivity)
📐 Trend threshold: ATR / Percent (with length/multiple or % level)
📅 Weekdays-only toggle (FX/Equities style)
👁️ Display toggles: Lunch box / sweep arrows / sweep text / sweep candle box / stats table
🔔 TF hint when chart TF > 15m
🧭 How to use
Use 5–15m charts for accurate lunch range capture.
Scroll ~1 year for meaningful samples.
Run sensitivity checks: vary ATR/% thresholds and the post-lunch end time.
For crypto, compare with vs without weekends. 🚀
🧠 Reading the results
High P(L-swept | Up) with a solid Up-day count ⇒ on up afternoons, lunch low is often swept.
High P(H-swept | Down) ⇒ on down afternoons, lunch high is often swept.
Lower Contradictions = cleaner tendency.
Remember: this is a probabilistic tendency, not a rule. 🎲
📝 Notes & limits
All markers (arrows, text, sweep boxes) are bar-anchored; the lunch range box is a research overlay you can toggle.
Real-time vs historical bar building can differ—interpret on bar close. 🔒

Weis Wave Volume MTF 🎯 Indicator Name
Weis Wave Volume (Multi‑Timeframe) — adapted from the original “Weis Wave Volume by LazyBear.”
This version adds multi‑timeframe (MTF) readings, configurable colors, font size, and screen position for clear dashboard‑style display.
🧠 Concept Background — What is Weis Wave Volume (WWV)?
The Weis Wave Volume indicator originates from Wyckoff and David Weis’ techniques.
Its purpose is to link price movement “waves” with the amount of traded volume to reveal how strong or weak each wave is.
Instead of showing bars one by one, WWV accumulates the total volume while price keeps moving in the same direction.
When price direction changes (up → down or down → up), it:
Finishes the previous wave volume total.
Starts a new wave and begins accumulating again.
Those wave volumes help traders see:
Effort vs Result: Big volume with small price move ⇒ absorption; low volume with big move ⇒ weak participation.
Trend confirmation or exhaustion: High volume waves in trend direction strengthen it, while low‑volume waves hint exhaustion.
⚙️ How this Script Works
Trend & Wave Detection
Compares close with the previous bar to determine up or down movement (mov).
Detects trend reversals (when mov direction changes).
Builds “waves,” each representing a continuous run of bars in one direction.
Volume Accumulation
While price keeps the same direction, the script adds each bar’s volume to the running total (vol).
When direction flips, it resets that total and starts a new wave.
Multi‑Timeframe Computation
Calculates these wave volumes on three timeframes at once, chosen dynamically:
Active Chart Timeframe Displays WWV for:
1 min 1 min
5 min 5 min
15 min 15 min
Any other Chart TF
It uses request.security() to pull each timeframe’s latest WWV value and current wave direction.
Visual Output
Instead of plotting histogram bars, it shows a table with three numeric values:
WWV (1): 25.3 M | (15): 312 M | (240): 2.46 B
Each value is color‑coded:
user‑selected Uptrend Color when price wave = up
user‑selected Downtrend Color when wave = down
You can position this small table in any corner/center (top / bottom × left / center / right).
Font size is user‑adjustable (Tiny → Huge).
📈 How Traders Use It
Quickly gauge buying vs selling effort across multiple horizons.
Compare short‑term wave volume to higher‑timeframe waves to spot:
Alignment → all up and big volumes = strong trend
Divergence → small or opposite‑colored higher‑TF wave = potential reversal or pause
Combine with Wyckoff, VSA, or standard trend analysis to judge if a breakout or pullback has real participation.
🧩 Key Features of This Version
Feature Description
Multi‑Timeframe Panel Displays WWV values for 3 selected TFs at once
Dynamic TF Mapping Auto‑adjusts which TFs to use based on chart
Up/Down Color Coding Customizable colors for wave direction
Adjustable Font and Placement Set font size (Tiny→Huge) and screen corner/center
No Histograms Keeps chart clean; acts as a compact WWV dashboard

Cora Combined Suite v1 [JopAlgo]Cora Combined Suite v1 (CCSV1)
This is an 2 in 1 indicator (Overlay & Oscillator) the Cora Combined Suite v1 .
CCSV1 combines a price-pane Overlay for structure/trend with a compact Oscillator for timing/pressure. It’s designed to be clear, beginner-friendly, and largely automatic: you pick a profile (Scalp / Intraday / Swing), choose whether to run as Overlay or Oscillator, and CCSV1 tunes itself in the background.
What’s inside — at a glance
1) Overlay (price pane)
CoRa Wave: a smooth trend line based on a compound-ratio WMA (CRWMA).
Green when the slope rises (bull bias), Red when it falls (bear bias).
Asymmetric ATR Cloud around the CoRa Wave
Width expands more up when buyer pressure dominates and more down when seller pressure dominates.
Fill is intentionally light, so candlesticks remain readable.
Chop Guard (Range-Lock Gate)
When the cloud stays very narrow versus ATR (classic “dead water”), pullback alerts are muted to avoid noise.
Visuals don’t change—only the alerting logic goes quiet.
Typical Overlay reads
Trend: Follow the CoRa color; green favors long setups, red favors shorts.
Value: Pullbacks into/through the cloud in trend direction are higher-quality than chasing breaks far outside it.
Dominance: A visibly asymmetric cloud hints which side is funding the move (buyers vs sellers).
2) Oscillator (subpane or inline preview)
Stretch-Z (columns): how far price is from the CoRa mean (mean-reversion context), clipped to ±clip.
Near 0 = equilibrium; > +2 / < −2 = stretched/extended.
Slope-Z (line): z-score of CoRa’s slope (momentum of the trend line).
Crossing 0 upward = potential bullish impulse; downward = potential bearish impulse.
VPO (stepline): a normalized Volume-Pressure read (positive = buyers funding, negative = sellers).
Rendered as a clean stepline to emphasize state changes.
Event Bands ±2 (subpane): thin reference lines to spot extension/exhaustion zones fast.
Floor/Ceiling lines (optional): quiet boundaries so the panel doesn’t feel “bottomless.”
Inline vs Subpane
Inline (overlay): the oscillator auto-anchors and scales beneath price, so it never crushes the price scale.
Subpane (raw): move to a new pane for the classic ±clip view (with ±2 bands). Recommended for systematic use.
Why traders like it
Two in one: Structure on the chart, timing in the panel—built to complement each other.
Retail-first automation: Choose Scalp / Intraday / Swing and let CCSV1 auto-tune lengths, clips, and pressure windows.
Robust statistics: On fast, spiky markets/timeframes, it prefers outlier-resistant math automatically for steadier signals.
Optional HTF gate: You can require higher-timeframe agreement for oscillator alerts without changing visuals.
Quick start (simple playbook)
Run As
Overlay for structure: assess trend direction, where value is (the cloud), and whether chop guard is active.
Oscillator for timing: move to a subpane to see Stretch-Z, Slope-Z, VPO, and ±2 bands clearly.
Profile
Scalp (1–5m), Intraday (15–60m), or Swing (4H–1D). CCSV1 adjusts length/clip/pressure windows accordingly.
Overlay entries
Trade with CoRa color.
Prefer pullbacks into/through the cloud (trend direction).
If chop guard is active, wait; let the market “breathe” before engaging.
Oscillator timing
Look for Funded Flips: Slope-Z crossing 0 in the direction of VPO (i.e., momentum + funded pressure).
Use ±2 bands to manage risk: stretched conditions can stall or revert—better to scale or wait for a clean reset.
Optional HTF gate
Enable to green-light only those oscillator alerts that align with your chosen higher timeframe.
What each signal means (plain language)
CoRa turns green/red (Overlay): trend bias shift on your chart.
Cloud width tilts asymmetrically: one side (buyers/sellers) is dominating; extensions on that side are more likely.
Stretch-Z near 0: fair value around CoRa; pullback timing zone.
Stretch-Z > +2 / < −2: extended; watch for slowing momentum or scale decisions.
Slope-Z cross up/down: new impulse starting; combine with VPO sign to avoid unfunded crosses.
VPO positive/negative: net buying/selling pressure funding the move.
Alerts included
Overlay
Pullback Long OK
Pullback Short OK
Oscillator
Funded Flip Up / Funded Flip Down (Slope-Z crosses 0 with VPO agreement)
Pullback Long Ready / Pullback Short Ready (near equilibrium with aligned momentum and pressure)
Exhaustion Risk (Long/Short) (Stretch-Z beyond ±2 with weakening momentum or pressure)
Tip: Keep chart alerts concise and use strategy rules (TP/SL/filters) in your trade plan.
Best practices
One glance workflow
Read Overlay for direction + value.
Use Oscillator for trigger + confirmation.
Pairing
Combine with S/R or your preferred execution framework (e.g., your JopAlgo setups).
The suite is neutral: it won’t force trades; it highlights context and quality.
Markets
Works on crypto, indices, FX, and commodities.
Where real volume is available, VPO is strongest; on synthetic volume, treat VPO as a soft filter.
Timeframes
Use the Profile preset closest to your style; feel free to fine-tune later.
For multi-TF trading, enable the HTF gate on the oscillator alerts only.
Inputs you’ll actually use (the rest can stay on Auto)
Run As: Overlay or Oscillator.
Profile: Scalp / Intraday / Swing.
Oscillator Render: “Subpane (raw)” for a classic panel; “Inline (overlay)” only for a quick preview.
HTF gate (optional): require higher-timeframe Slope-Z agreement for oscillator alerts.
Everything else ships with sensible defaults and auto-logic.
Limitations & tips
Not a strategy: CCSV1 is a decision support tool; you still need your entry/exit rules and risk management.
Non-repainting design: Signals finalize on bar close; intrabar graphics can adjust during the bar (Pine standard).
Very flat sessions: If price and volume are extremely quiet, expect fewer alerts; that restraint is intentional.
Who is this for?
Beginners who want one clean overlay for structure and one simple oscillator for timing—without wrestling settings.
Intermediates seeking a coherent trend/pressure framework with HTF confirmation.
Advanced users who appreciate robust stats and clean engineering behind the visuals.
Disclaimer: Educational purposes only. Not financial advice. Trading involves risk. Use at your own discretion.

Custom Two Sessions H/L/50% LevelsTrack high/low/midpoint levels across two customizable time sessions. Perfect for monitoring H4 blocks, session ranges, or any custom time periods as reference levels for lower timeframe trading.
What This Indicator Does:
Tracks and projects High, Low, and 50% Midpoint levels for two fully customizable time sessions. Unlike fixed-session indicators, you define EXACTLY when each session starts and ends.
Key Features:
• Two independent sessions with custom start/end times (hour and minute)
• High/Low/50% midpoint tracking for each session
• Visual session boxes showing calculation periods
• Horizontal lines projecting levels into the future
• Historical session levels remain visible for reference
• Works on any chart timeframe (M1, M5, M15, H1, H4, etc.)
• Full visual customization (colors, line styles, widths)
• DST timezone support
Common Use Cases:
H4 Candle Tracking - Set sessions to 4-hour blocks (e.g., 6-10am, 10am-2pm) to track individual H4 highs/lows
H1 Candle Tracking - 1-hour blocks for scalping reference levels
Session Trading - ETH vs RTH, London vs NY, Asian session, etc.
Custom Time Periods - Any time range you want to monitor
How to Use:
The indicator identifies key price levels from higher timeframe periods. Use previous session H/L/50% as reference levels for:
Identifying sweep and reclaim setups
Lower timeframe structural flip confirmations
Support/resistance zones for entries
Delivery targets after breaks of structure
Settings:
Configure each session's start/end times independently. The indicator automatically triggers at the first bar crossing into your specified time, making it compatible with all chart timeframes.
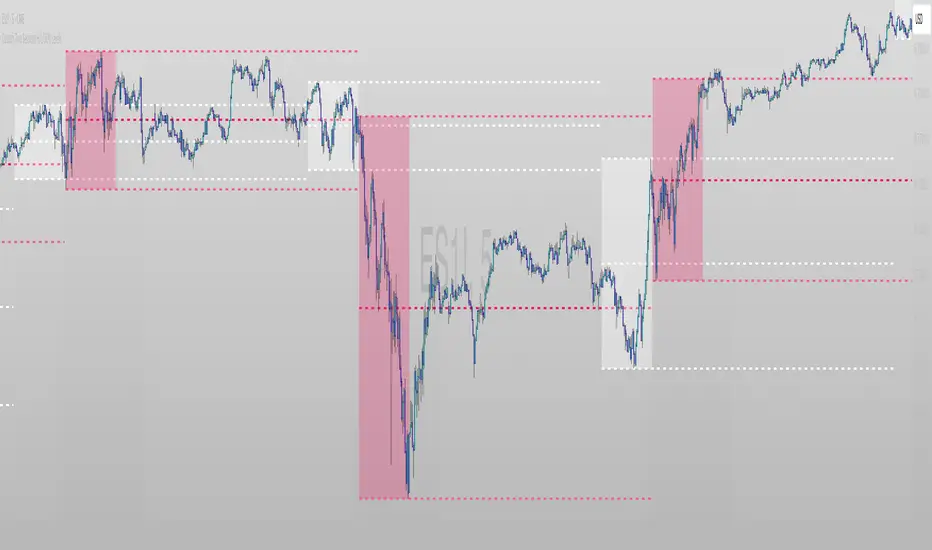
MTF 20 SMA Table - DXY**MTF 20 SMA Table - Multi-Timeframe Trend Analysis Dashboard**
**Overview:**
This indicator provides a comprehensive multi-timeframe analysis dashboard that displays the relationship between price and the 20-period Simple Moving Average (SMA) across four key timeframes: 15-minute, 1-hour, 4-hour, and Daily. It's designed to help traders quickly identify trend alignment and potential trading opportunities across multiple timeframes at a glance. It's definitely not perfect but has helped me speed up my backtesting efforts as it's worked well for me eliminating flipping back and forth between timeframes excpet when I have confluence on the table, then I check the HTF.
**How It Works:**
The indicator creates a table overlay on your chart showing three critical metrics for each timeframe:
1. **Price vs SMA (Row 1):** Shows whether price is currently above (bullish) or below (bearish) the 20 SMA
- Green = Price Above SMA
- Red = Price Below SMA
2. **SMA Direction (Row 2):** Indicates the trend direction of the SMA itself over a lookback period
- Green (↗ Rising) = Uptrend
- Red (↘ Falling) = Downtrend
- Gray (→ Flat) = Ranging/Consolidation
3. **Strength (Row 3):** Displays the distance between current price and the SMA in pips
- Purple background = Strong move (>50 pips away)
- Orange background = Moderate move (20-50 pips)
- Gray background = Weak/consolidating (<20 pips)
- Text color: Green for positive distance, Red for negative
**Key Features:**
- **Customizable Table Position:** Place the table anywhere on your chart (9 position options)
- **Adjustable SMA Lengths:** Modify the SMA period for each timeframe independently (default: 20)
- **Direction Lookback Settings:** Fine-tune how far back the indicator looks to determine SMA direction for each timeframe
- **Flat Threshold:** Set the pip threshold for determining when an SMA is "flat" vs trending (default: 5 pips)
- **DXY Optimized:** Calculations are calibrated for the US Dollar Index (1 pip = 0.01)
**Best Use Cases:**
1. **Trend Alignment:** Identify when multiple timeframes align in the same direction for higher probability trades
2. **Divergence Spotting:** Detect when lower timeframes diverge from higher timeframes (potential reversals)
3. **Entry Timing:** Use lower timeframe signals while higher timeframes confirm overall trend
4. **Strength Assessment:** Gauge how extended price is from the mean (SMA) to avoid overextended entries
**Settings Guide:**
- **SMA Settings Group:** Adjust the SMA period for each timeframe (15M, 1H, 4H, Daily)
- **SMA Direction Group:** Control lookback periods to determine trend direction
- 15M: Default 5 candles
- 1H: Default 10 candles
- 4H: Default 15 candles
- Daily: Default 20 candles
- **Flat Threshold:** Set sensitivity for "flat" detection (lower = more sensitive to ranging markets)
**Trading Strategy Examples:**
1. **Trend Following:** Look for all timeframes showing the same direction (all green or all red)
2. **Pullback Trading:** When Daily/4H are green but 15M/1H show red, wait for lower timeframes to flip green for entry
3. **Ranging Markets:** When multiple SMAs show "flat", consider range-bound strategies
**Important Notes:**
- This is a reference tool only, not a standalone trading system
- Always use proper risk management and combine with other analysis methods
- Best suited for trending instruments like indices and major forex pairs
- Calculations are optimized for DXY but can be used on other instruments (pip calculations may need adjustment)
**Credits:**
Feel free to modify and improve this code! Suggestions for enhancements are welcome in the comments.
---
**Installation Instructions:**
1. Add the indicator to your TradingView chart
2. Adjust the table position via settings to avoid overlap with price action
3. Customize SMA lengths and lookback periods to match your trading style
4. Monitor the table for timeframe alignment and trend confirmation
---
This indicator is published as open source for the community to learn from and improve upon. Happy trading! 📈
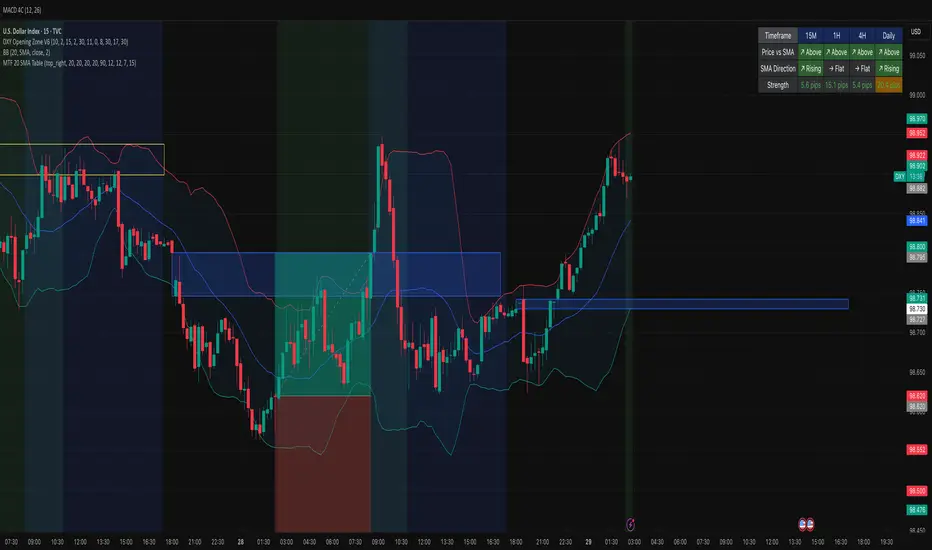
Ichimoku MultiTF WillyArt v1.0.0What this indicator does
Ichimoku WillyArt turns the Ichimoku lines into angle-based momentum across multiple timeframes (W, D, 4H, 1H, 30m, 5m).
For each TF it computes the slope (angle in degrees) of:
Tenkan-sen
Kijun-sen
Senkou Span A
Senkou Span B
Angles are normalized so they’re comparable across assets and scales. You get a table with the angle per line and a quick emoji direction (↑, →, ↓), optional plots of the chosen line, and ready-to-use alerts.
Why angle?
Slope-as-degrees is an intuitive proxy for momentum/impulse:
Positive angle → line rising (bullish impulse).
Negative angle → line falling (bearish impulse).
Near zero → flat/indecisive.
Two normalization modes
ATR (default): slope / ATR. Robust across instruments; less sensitive to price level.
%Price: slope / price. More sensitive; can highlight subtle turns on low-volatility symbols.
Inputs you’ll actually care about
Timeframes: W, D, 4H, 1H, 30m, 5m (all fetched MTF, independent of chart TF).
Ichimoku lengths: Tenkan (9), Kijun (26), Span B (52) — standard defaults.
Bars for slope (ΔN): How many bars back the slope is measured. Higher = smoother, slower.
Threshold (°) for “strong”: Angle magnitude that qualifies as strong ↑/↓.
What you’ll see
Matrix/Table (top-right): For each TF, the angle (°) of Tenkan, Kijun, Span A, Span B + an emoji:
↑ above threshold, ↓ below −threshold, → in between.
Optional plots: Toggle “Plot angles” to visualize the chosen series’ angle across TFs.
Alerts included (ready to pick in “Create Alert”)
Sustained state: e.g., “Kijun 4H: strong ↑ angle” triggers while angle > threshold.
Threshold cross (one-shot): e.g., “Kijun 1H: upward threshold cross” fires on crossing.
Consensus (multi-TF): “Kijun consensus ↑ (D/4H/1H/30m/5m)” when all selected TFs align up (and the symmetric down case).
Messages are constant strings (TradingView requirement), so they compile cleanly. If you want dynamic text (current angle, threshold value, etc.), enable your own alert() calls—this script structure supports adding them.
How to use it (workflow)
Add to chart. No need to switch chart TF; the script pulls W/D/4H/1H/30m/5m internally.
Pick normalization. Start with ATR. Switch to %Price if you want more sensitivity.
Set ΔN & threshold.
Intraday momentum: try ΔN = 3–5 and threshold ≈ 4–8°.
Swing/position: ΔN = 5–9 and threshold ≈ 3–6° (with ATR).
Scan the table. Look for alignment (multiple TFs with ↑ or ↓ on Kijun/Spans).
Kijun + Span A up together → trending push.
Span B up/down → cloud baseline tilting (trend quality).
Turn on alerts that match your style: reactive cross for entries, sustained for trend follow, consensus to filter noise.
Reading tips
Kijun angle: great “trend backbone.” Strong ↑ on several TFs = higher-probability pullback buys.
Span A vs. Span B:
Span A reacts faster (momentum).
Span B is slower (structure).
When both tilt the same way, the cloud is genuinely rotating.
Mixed signals? Use higher TFs (W/D/4H) as bias, lower TFs (1H/30m/5m) for timing.
Good to know (limits & best practices)
Angles measure rate of change, not overbought/oversold. Combine with price structure and risk rules.
Extremely low volatility or illiquid symbols can produce tiny angles—%Price mode may help.
ΔN and thresholds are contextual: adapt per market (crypto vs FX vs equities).
Want me to bundle a “pro template” of alert presets (intraday / swing) and a heatmap color scale for the table? Happy to ship v2. 🚀

Dual Table Dashboard - Correct V3add RSI Data## 📈 Trading Applications
### 1. Trend Following Strategy
```
1. Check TABLE 1 for trend direction (AnEMA29 + PDMDR)
2. If both green → Look for longs
3. If both red → Look for shorts
4. Use TABLE 2 for entry levels
```
### 2. Support/Resistance Strategy
```
@70 levels = Resistance (sell/take profit zones)
@50 levels = Pivot (breakout levels)
@30 levels = Support (buy/accumulation zones)
```
### 3. Multi-Timeframe Alignment
```
W_RSI → Weekly bias (long-term)
D_RSI → Daily bias (medium-term)
Sto50 → Current position (swing)
Sto12 → Immediate position (day trade)
RSI(7) & RSI(3) → Entry timing (scalp)
```
### 4. Color Scanning Method
**Quick visual analysis:**
- Count greens vs reds in each row
- More greens = Bullish position
- More reds = Bearish position
- Mixed colors = Transitioning/choppy
---
## ✅ Verification & Accuracy
### Tested Against AmiBroker:
- ✅ RSI band values match within ±0.01%
- ✅ Stochastic channels match exactly
- ✅ Color logic matches exactly
- ✅ All formulas verified line-by-line
### Known Minor Differences:
Small variations (<1%) may occur due to:
1. **Platform calculation precision** - Different floating-point engines
2. **Historical data feeds** - Slight variations in past prices
3. **Weekly bar boundaries** - TradingView vs AmiBroker week definitions
4. **Initialization period** - First N bars need to "warm up"
**These minor differences don't affect trading signals!**
---
## ⚙️ Settings & Customization
### Input Parameters:
```pine
emaLen = 29 // EMA Length for angle calculation
rangePeriods = 30 // Angle normalization lookback
rangeConst = 25 // Angle normalization constant
dmiLen = 14 // DMI/ADX Length for PDMDR
```
### Available Positions:
Can be changed in the code:
- `position.top_left`
- `position.top_center`
- `position.top_right`
- `position.middle_left` (Table 2 default)
- `position.middle_center`
- `position.middle_right`
- `position.bottom_left` (Table 1 default)
- `position.bottom_center`
- `position.bottom_right`
### Text Sizes:
- `size.tiny`
- `size.small` (current default)
- `size.normal`
- `size.large`
- `size.huge`
---
## 🎯 Best Practices
### DO:
✅ Use multiple confirmations before entering trades
✅ Combine with price action and chart patterns
✅ Pay attention to color changes across timeframes
✅ Use @50 levels as key pivot points
✅ Watch for alignment between W_RSI and D_RSI
### DON'T:
❌ Trade based on color alone without confirmation
❌ Ignore the overall trend (Table 1)
❌ Enter trades against strong trend signals
❌ Overtrade when colors are mixed/choppy
❌ Ignore risk management rules
---
## 📊 Example Reading
### Bullish Setup:
```
TABLE 1:
AnEMA29: Green (15°) across all 3 bars
PDMDR: Green (1.65) and rising
TABLE 2:
W_RSI@50: Green (price above)
D_RSI@50: Green (price above)
Sto50@50: Green (price above midpoint)
Sto12@50: Green (price above midpoint)
Interpretation: Strong bullish trend confirmed across multiple timeframes
Action: Look for long entries on pullbacks to @50 or @30 levels
```
### Bearish Setup:
```
TABLE 1:
AnEMA29: Red (-12°) across all 3 bars
PDMDR: Red (0.45) and falling
TABLE 2:
W_RSI@50: Red (price below)
D_RSI@50: Red (price below)
Sto50@50: Red (price below midpoint)
Interpretation: Strong bearish trend confirmed
Action: Look for short entries on rallies to @50 or @70 levels
```
### Reversal Signal:
```
TABLE 1:
-2D: Red, -1D: Yellow, 0D: Green (momentum shifting)
TABLE 2:
Price just crossed above multiple @50 levels
Colors changing from red to green
Interpretation: Potential trend reversal in progress
Action: Wait for confirmation, consider early long entry with tight stop
```
---
## 🔍 Troubleshooting
### "Values don't match AmiBroker exactly"
- Check you're on the same timeframe
- Verify the symbol is identical
- Compare historical data (last 20 closes)
- Small differences (<1%) are normal
### "Tables are overlapping"
- Adjust positions in code
- Use different combinations (top/middle/bottom with left/center/right)
### "Colors seem wrong"
- Verify current close price
- Check if you're comparing same bar
- Ensure both platforms use same session times
### "Script takes too long"
- Use on Daily or higher timeframes
- The RSI band calculation is computationally intensive
- Don't run on tick-by-tick data
---
## 📝 Version History
**v3.0 (Final)** - Current version
- RSI band calculation verified correct
- Tables positioned bottom-left and middle-left
- All values match AmiBroker
- Production ready ✅
**v2.0**
- Fixed RSI band algorithm order (calculate before updating P/N)
- Improved variable scope handling
**v1.0**
- Initial implementation
- Had incorrect RSI band calculation
---
## 📄 Files in Package
