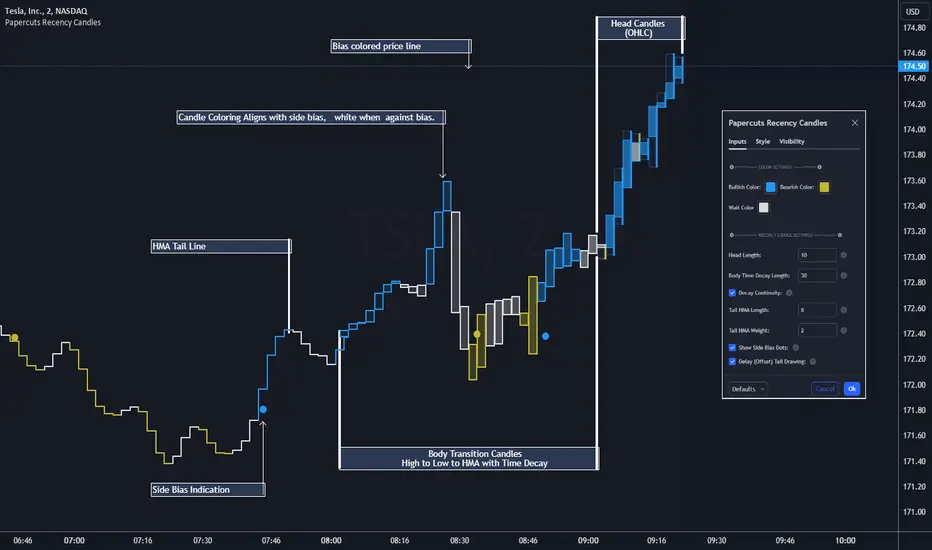
Papercuts Recency CandlesPapercuts Recency Candles
V0.8 by Joel Eckert @PapercutsTrading
***This is currently an experimental visual exploratory concept.***
*** Experimental tools should only be explored by fellow coders and experienced traders.***
DESCRIPTION:
As coders, how can we seamlessly transition between actual and smoothed price data sets as data ages?
This is a visual experiment to see if and how data can be smoothly transitioned from one value to another over a set number of candles. If we visualize a chart in 3 zones, a head, a body, and a tail we can start to understand how this could work. The head zone would represent the first data set of actual asset prices. The body zone would represent the transition period from the first to the to the second data set. Last, the tail zone would represent the second data set made of a Hull Moving Average of the asset.
CONCEPT:
It is conceived that data and position precision constantly shift as they decay or age, therefore making older price levels act more like price regions or zones vs exact price points. This is what I am calling Recency.
This indicator utilizes the concept of "Recency" to explore the possibility of a new style of candle. It aims to maintain accurately on recent prices action but loosen up accuracy on older price action. The very nature of this requires ALTERING HISTORICAL DATA within the body zone or transition candles to achieve the effect. It is similar to trying to merge a line chart type with a candle chart type.
This experiment of using recency for candles was to create candles that stay more accurate near current price but fade away into a simple line as they age out, resulting in a simplified view of the big picture which consists of older price action.
This experimental design theoretically will help you stay focused only on what is currently unfolding and to minimize distractions from older price nuances.
USAGE:
WHO:
This is not recommended for new traders or novices that are unfamiliar with standard tools. Standardized tools should always be used to get grounded and build a foundation.
Active traders who are familiar with trading comfortably should experiment with this to see if they find it interesting or usable.
Pine coders may find this concept interesting enough, and may adapt the idea to other elements of their own scripts if they find it interesting… I just ask they give credit where credit is due.
HOW:
The best way to visualize how this works is to do the following:
Load it on a chart.
Turn off Standard candles in Chart Setting of the current window. I actually just turn off the bodies and borders, and dim the old wicks as I like the way the old wicks look when left alone with these new candles.
Enable chart replay at a faster speed, like 3x, and play back the chart to watch the behavior of the candles.
You’ll be able to see how the head of the candle type preserves OHLC, and indicates direction but as the candle starts to age it progressively flowers into the HMA
While it plays back try adjusting settings to see how they affect behavior.
You can see the data average in real-time which often reveals how unstable actual price noise really is.
The head candle diagonals indicate the candle body direction.
SETTINGS:
Coloring: You can choose your own bullish or bearish colors to match your scheme.
Price Line: The price line is colored according to the trend and
Head Length: These candles are true to the source high and low. They remain slightly brighter than transition candles. We have a max of 50 to keep things responsive.
Time Decay Length: This is the amount of candles it takes to transition to the tail. Max is 300 to keep things responsive.
Decay Continuity: This forces transition candles to complete the HMA curve instead of creating gaps when conforming to it. The best way to visualize this feature is to run a 3x replay of an asset, and toggle the result on and off. On is preferred.
Tail HMA Length: This is the smoothing amount for the resulting HMA stepline that calculates every close, but has a delayed draw until after the transition candles. You can optionally turn off the delayed visibility to help with comprehension.
Tail HMA Weight: This is simply an option to make the tail thicker or thinner. This also adjusts the border on the head candles to help them stand out.
Show Side Bias Dots: Default true: Draws a dot when bias to one side changes to help keep you on the right side of trade. Side bias is simply the alignment of 3 moving averages in one direction.
IMPORTANT NOTES:
You'll have to turn off or dim the standard candles in your view "Chart Settings" to see this properly.
Be aware that since the candles are based on boxes and utilize the “recency concept”, which means their data decays and changes as it ages. This results in a cleaner chart overall, but exact highs and lows will be averaged out as the data decays, forming a Hull Moving Average stepline of your defined length once decay has finished.
SUMMARY OF HOW IT WORKS:
First it takes candle information and creates unique boxes that represent each candle based on the high and low. It utilizes boxes because standard candles once written, cannot be later altered or removed… which is a key element for this effect to work.
Next it creates a second box and line from open to close for the body of the Head candles. This indicates direction at a glance.
As candles age beyond the defined distance of the “Head” they enter the "Body" aka "Time Decay" zone. Here the accuracy of the high and low will be averaged down using an incremental factor of the HMA, defined by "Time Decay Length" amount of candles.
The resulting tail is an HMA of Tail HMA Length. This tail is always calculate at close, but is not drawn instantly. The draw is delayed so that there is not overlapping data, and this makes the effect look more elegant.
There are also two EMAs within the script that do nothing but help candle coloring and help provide a trade side bias. When both EMA's and the HMA align, a side bias is defined. Only when the side bias changes will a new dot is formed.
Head candles have been simplified from previous versions to be easier to read at a a glance.
在腳本中搜尋"采列VS新圣徒"
sVPSA - standardized Volume Price Spread AnalysisDear Analysts and Traders,
I want to introduce my new indicator - sVPSA - standardized Volume Price Spread Analysis. For me, this script is helpfully in Technical Analysis mainly with Wyckoff and VSA methodologies. Maybe You are in circle of people who used my previous script - normalized Volume Price Spread Analysis. I work with him a lot of time, but I come to a conclusion that I can do better...
Theory concept...
What is a big volume? How big was this spread? It was extreme high or just high? How to do an answer for this and a lot other questions related to this subject? My thoughts was directed to statistics. In my first script I used to x/max normalized data. It was good, but susceptible for high deviation events. So, I choose standardization method with smaller sensitivity on violent events - z-Score standardization Description of z-Score formula:
Z = (x-mean)/standard deviation
Probability of event are descriptive by probability density function - The Normal Distribution.
en.wikipedia.org
en.Wikipedia.org
This is base of script methodology, let’s go deeper in indicator.
X axis is time, date. Y axis is standard deviation. Narrow bar represent price spread, wide one is volume. Colors are corresponding to deviation, blue < sigma, green > sigma, red > 2*sigma and fuchsia > 3*sigma. Appearance is full editable.
Data collection starts from left to right. There is two possibilities to use, constans number of bars or visible data range, also indicator permit to overscore linear regression from data. There is a possibility to set an alert.
Short introduction how put an interpretation on visualized data.
For this example I used constans value of data collection, 52 bars. So, from left I see great, fuchsia volume bar with low spread. This record respond Celsius withdrawals pause. This is bar with the biggest volume on presented chart, more than four sigmas. Spread value is near one sigma. I should consider this via one of Wyckoffs laws - effort vs result. I see a three bars in turn, they tenor tells me that bear market is possible near end. Accumulation structure near new year, spring test and bullish momentum bar near march are approval of this idea. Next high spread bars have volume near mean value. Effort is low but result is great. Interesting is last bar, with -2,8 deviation of volume. I see the lowest volume value on chart, so he’s deviation is strong to negative side. This script require a little of practise and can be a potent tool in Technical Analysis.
If You have a concept how to improve my script or You experience bug, please, send me feedback.
I hope that You consider my work as useful.
I wish You great trades and faultless analysis.
CatTheTrader
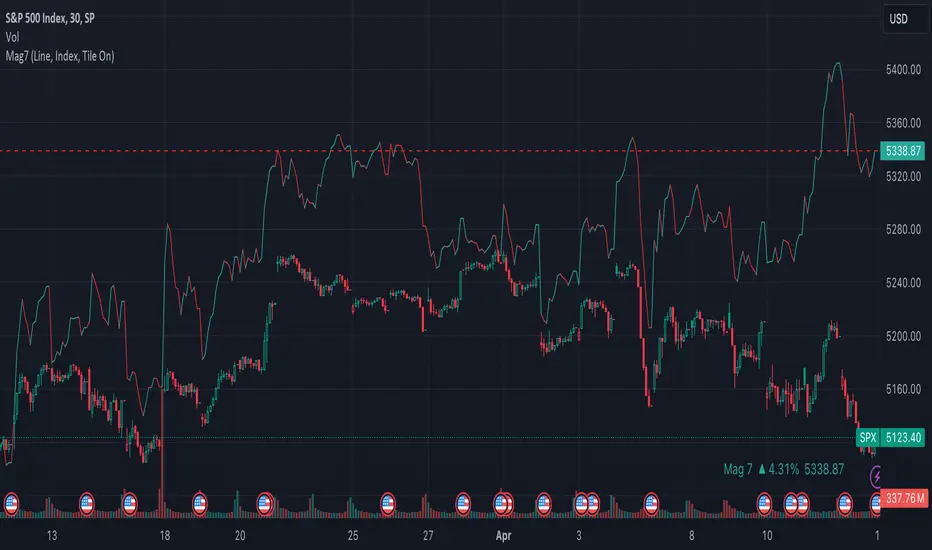
Mag7 IndexThis is an indicator index based on cumulative market value of the Magnificent 7 (AAPL, MSFT, NVDA, TSLA, META, AMZN, GOOG). Such an indicator for the famous Mag 7, against which your main security can be benchmarked, was missing from the TradingView user library.
The index bar values are calculated by taking the weighted average of the 7 stocks, relative to their market cap. Explicitly, we are multiplying each bar period's total outstanding stock amount by the OHLC of that period for each stock and dividing that value by the combined sum of outstanding stock for the 7 corporations. OHLC is taken for the extended trading session.
The index dynamically adjusts with respect to the chosen main security and the bars/line visible in the chart window; that is, the first close value is normalized to the main security's first close value. It provides recalculation of the performance in that chart window as you scroll (this isn't apparent in the demo chart above this description).
It can be useful for checking market breadth, or benchmarking price performance of the individual stock components that comprise the Magnificent 7. I prefer comparing the indicator to the Nasdaq Composite Index (IXIC) or S&P500 (SPX), but of course you can make comparisons to any security or commodity.
Settings Input Options:
1) Bar vs. Line - view as OHLC colored bars or line chart. Line chart color based on close above or below the previous period close as green or red line respectively.
2) % vs Regular - the final value for the window period as % return for that window or index value
3) Turn on/off - bottom right tile displaying window-period performance
Inspired by the simpler NQ 7 Index script by @RaenonX but with normalization to main security at start of window and additional settings input options.
Please provide feedback for additional features, e.g., if a regular/extended session option is useful.
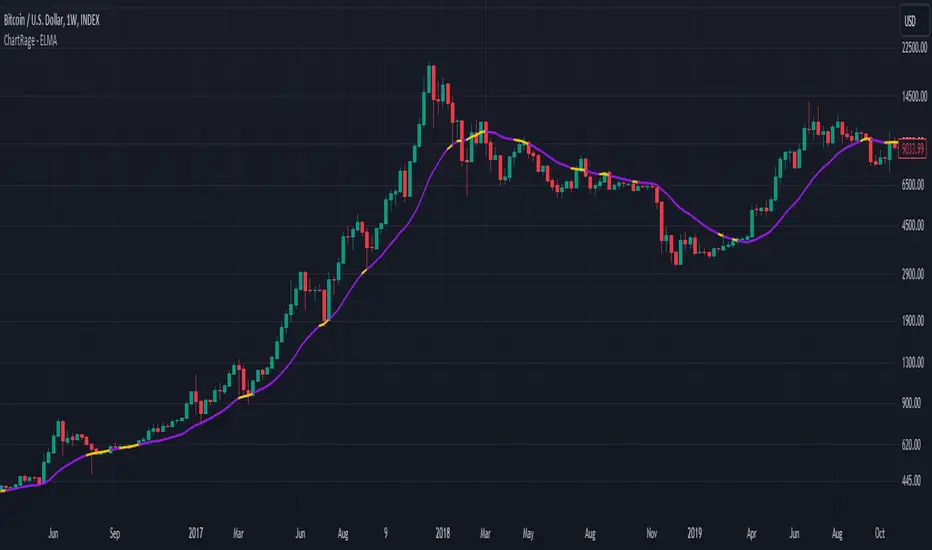
ChartRage - ELMAELMA - Exponential Logarithmic Moving Average
This is a new kind of moving average that is using exponential normalization of a logarithmic formula. The exponential function is used to average the weight on the moving average while the logarithmic function is used to calculate the overall price effect.
Features and Settings:
◻️ Following rate of change instead of absolute levels
◻️ Choose input source of the data
◻️ Real time signals through price interaction
◻️ Change ELMA length
◻️ Change the exponential decay rate
◻️ Customize base color and signal color
Equation of the ELMA:
This formula calculates a weighted average of the logarithm of prices, where more recent prices have a higher weight. The result is then exponentiated to return the ELMA value. This approach emphasizes the relative changes in price, making the ELMA sensitive to the % rate of change rather than absolute price levels. The decay rate can be adjusted in the settings.
Comparison EMA vs ELMA:
In this image we see the differences to the Exponential Moving Average.
Price Interaction and earlier Signals:
In this image we have added the bars, so we can see that the ELMA provides different signals of resistance and support zones and highlights them, by changing to the color yellow, when prices interact with the ELMA.
Strategy by trading Support and Resistance Zones:
The ELMA helps to evaluate trends and find entry points in bullish market conditions, and exit points in bearish conditions. When prices drop below the ELMA in a bull market, it is considered a buying signal. Conversely, in a bear market, it serves as an exit signal when prices trade above the ELMA.
Volatile Markets:
The ELMA works on all timeframes and markets. In this example we used the default value for Bitcoin. The ELMA clearly shows support and resistance zones. Depending on the asset, the length and the decay rate should be adjusted to provide the best results.
Real Time Signals:
Signals occur not after a candle closes but when price interacts with the ELMA level, providing real time signals by shifting color. (default = yellow)
Disclaimer* All analyses, charts, scripts, strategies, ideas, or indicators developed by us are provided for informational and educational purposes only. We do not guarantee any future results based on the use of these tools or past data. Users should trade at their own risk.
This work is licensed under Attribution-NonCommercial-ShareAlike 4.0 International
creativecommons.org
ThWiDraws thick vertical lines behind candles or bars so it looks like the wicks are thick. The thickness is adjustable and so are the color for up bars vs down bars.
2. [pufferman] - Key Bars with auto halflineThe idea is to identify significantly large candles on high volume. These candles frequently offer significant context to the subsequent candles.
The indicator marks unusually large candles with certain body to wick & tail ratio that has above average volume. These candles are marked bullish and bearish (green or red respectively). It is recommended that these colors are a higher tier than the regular candles to denote significance. See chart for reference. regular candles are blue and yellow while key bars are marked green and red.
the half value of the spread (open and close) of the candle is significant level. you want the half line held in whatever direction your trend is. I.e. if a bullish key bar, you want the price to hold above the half line of the key bar. this is the type of price action you want to see in a trending move. Reverse for bearish key bars.
This indicator work on all time frames and will identify keybars according to he users metrics on all time frames. However, the most two recent daily keybar half line is projected onto all intraday timeframes to allow the user quickly see significant daily levels on the intraday time frames.
The indicator is based on moving average of the atr of the spread of the candle and tail and wick vs spread size ratio to determine unusually large bodied candles. The candle also have to have above average volume. Default average is the 10 session MA.
I use blue and yellow regular candles. and so the keybars are colored red and green. you may need to change this. In case the user uses other candle color overlays, the keybars are also denoted via a purple square below the candle.

Historical PE ratio vs medianThe Trailing Twelve-Month Price-to-Earnings (TTM P/E) Ratio vs. Median Value Indicator is a financial analytical tool designed to assess the current valuation of a stock or index in comparison to its historical norm. This is achieved by calculating the P/E ratio using the sum of the entity's earnings per share (EPS) over the past twelve months and dividing it by its current share price. The resulting TTM P/E ratio is then compared against the median P/E ratio calculated over a specified historical period.
The median P/E ratio serves as a benchmark, representing the midpoint of the entity's valuation over the selected timeframe, thus smoothing out short-term volatility and anomalies. By comparing the current TTM P/E ratio to this median, the indicator provides a relative measure of whether the stock or index is currently overvalued, undervalued, or trading at its historical valuation norms.

Custom Dual SMADescription
The Custom Dual SMA Indicator is designed for traders who wish to track and compare the moving averages of two different financial instruments simultaneously on the same chart, usually if there is correlation between to different asset such as TQQQ vs SQQQ. This indicator is particularly useful for those who engage in comparative analysis or pairs trading strategies.
Features
Dual Ticker Input: Users can input any two ticker symbols (e.g., stocks, currencies, commodities) to analyze. This flexibility allows for a broad range of comparative analyses across different markets or sectors.
Customizable SMA Length: The indicator provides the option to set the length of the SMA for each ticker symbol independently. This feature is critical for traders who wish to analyze the moving averages over different time periods, depending on their trading strategy or the specific characteristics of the instruments being analyzed.
Overlay on Price Chart: The calculated SMAs are overlaid directly on the price chart, enabling users to easily visualize how the moving averages of the two instruments move in relation to each other and to their respective price actions.
Color-Coded for Clarity: Each SMA is plotted in a different color (red and blue by default), ensuring clear differentiation and easy interpretation at a glance.
Use Case
This indicator is particularly beneficial for:
Comparative Analysis: Traders can compare the performance and trends of two different instruments, observing how their moving averages converge or diverge over time.
Pairs Trading: Those involved in pairs trading can use this tool to identify potential entry and exit points by analyzing the moving averages of two correlated or inversely correlated instruments.
Diversification Analysis: Investors looking to diversify their portfolio can use this indicator to understand the moving average trends of various instruments, helping them make informed decisions about asset allocation.
Summary
The Custom Dual SMA Indicator is a versatile tool for traders and investors who require a comparative view of the moving averages of two different instruments on the same chart. Its customizable nature and ease of use make it suitable for a wide range of trading strategies and market analyses.

Saty Volume StackBreaks volume into buy and sell volume and stacks them based on which side has higher volume.
Dynamic Buy / Sell Stack
Unlike other buy/sell volume indicators, which statically display this information (typically green over red), this indicator dynamically stacks the higher volume side on top. For example, green over red indicates more buy-side volume, red over green indicators more sell-side volume.
Current Candle Volume Buy/Sell %
A label shows the % buy vs sell volume for the current candle in real-time. This label is also dynamic with the left position being higher volume.
How the Buy/Sell Volume is Calculated
Buy/Sell % is calculated based on price.
Buy % is calculated using the distance between the low of the candle to the closing value of the candle and dividing that by the total range of the candle high to low.
Sell % is calculated using the distance between the high of the candle to the closing value of the candle and dividing that by the total range of the candle high to low.
Please note this is a proxy metric and while it is incredibly useful, it is not going to match up exactly with actual buy/sell volume that can be found on tape.

Intraday Volume Profile [BigBeluga]The Intraday Volume Profile aims to show delta volume on lower timeframes to spot trapped shorts at the bottom or trapped longs at the top, with buyers pushing the price up at the bottom and sellers at the top acting as resistance.
🔶 FEATURES
The indicator includes the following features:
LTF Delta precision (timeframe)
Sensibility color - adjust gradient color sensitivity
Source - source of the candle to use as the main delta calculation
Color mode - display delta coloring in different ways
🔶 DELTA EXAMPLE
In the image above, we can see how delta is created.
If delta is positive, we know that buyers have control over sellers, while if delta is negative, we know sellers have control over buyers.
Using this data, we can spot interesting trades and identify trapped individuals within the candle.
🔶 HOW TO USE
In the image above, we can see how shorts are trapped at the bottom of the wick (red + at the bottom), leading to a pump also called a "short squeeze."
Same example as before, but with trapped longs (blue + at the top).
This can also work as basic support and resistance, for example, trapped shorts at the bottom with positive delta at the bottom acting as strong support for price.
Users can have the option to also display delta data within the corresponding levels, showing Buyers vs Sellers for more precise trading ideas.
NOTE:
User can only display the most recent data for the last 8 buyers and sellers.
It is recommended to use a hollow candle while using this script.

SMA Direction Cross Currency SummaryThis script shows the average SMA direction of each of the majors and crosses when compared to each other. The more blocks to the right the stronger the currency on that timeframe. The more blocks to the left the weaker the currency.
I'm finding it useful to quickly know the average flow of movement for each currency on the higher timeframes and then focus on that for a daily trade. I also like how i dont have to keep jumping between instruments to stay upto date. I'm not a 'real' trader so I have very limited time and attention for this so this does the job as a crude replacement for trawling all the chart each day.
The currencies compared are:
-NZD
-AUD
-JPY
-CHF
-EUR
-GBP
-CAD
-USD
The way it is calculated is that its based on the 20 SMA. For each currency vs the other crosses:
if the SMA is pointing up and price is higher = +2
if the SMA is pointing up and price is lower = +1
if the SMA is pointing down and price is higher = -2
if the SMA is pointing down and price is lower = -1
So if we where considering GBP. We would do that for GBPNZD, GBPAUD, GBPPJY, GBPCHF, GBPEUR, GBPCAD, GBPUSD. We would then consider this sum against all the currencies to understand the relative strength.
Due to the limit on how many instruments can be called in a single indicated you need to load it for each currencies so 8 currencies = 8 indicators.
Its a bit of a frankinstien script - it just throw it togeather so its probably got redundant code etc. Its built around 20 SMA - no idea what would happens when you change that.
Relative Volume Candles [QuantVue]In the words of Dan Zanger, "Trying to trade without using volume is like trying to drive a few hundred miles without putting gas in your tank. Trying to trade without chart patterns is like leaving without having an idea how to get there!"
Volume tends to show up at the beginning and the end of trends. As a general rule, when a stock goes up on low volume, it's seen as negative because it means buyers aren't committed. When a stock goes down on low volume, it means that not many people are trying to sell it, which is positive.
The Relative Volume Candles indicator is based on the Zanger Volume Ratio and designed to help identify key volume patterns effortlessly, with color coded candles and wicks.
The indicator is designed to be used on charts less than 1 Day and calculates the average volume for the user selected lookback period at the given time of day. From there a ratio of the current volume vs the average volume is used to determine the candle’s colors.
The candles wicks are color coded based on whether or not the volume ratio is rising or falling.
So when is it most important to have volume? When prices break out of a consolidation pattern like a bull flag or cup and handle pattern, volume plays a role. When a stock moves out of a range, volume shows how committed buyers are to that move.
Note in order to see this indicator you will need to change the visual order. This is done by selecting the the 3 dots next to the indicator name, scrolling down to visual order and selecting bring to front.
Indicator Features
🔹Selectable candle colors
🔹Selectable ratio levels
🔹Custom lookback period***
***TradingView has a maximum 5,000 bar lookback for most plans. If you are on a lower time frame chart and you select a lookback period larger than 5,000 bars the indicator will not show and you will need to select a shorter lookback period or move to a higher time frame chart.
Give this indicator a BOOST and COMMENT your thoughts!
We hope you enjoy.
Cheers!

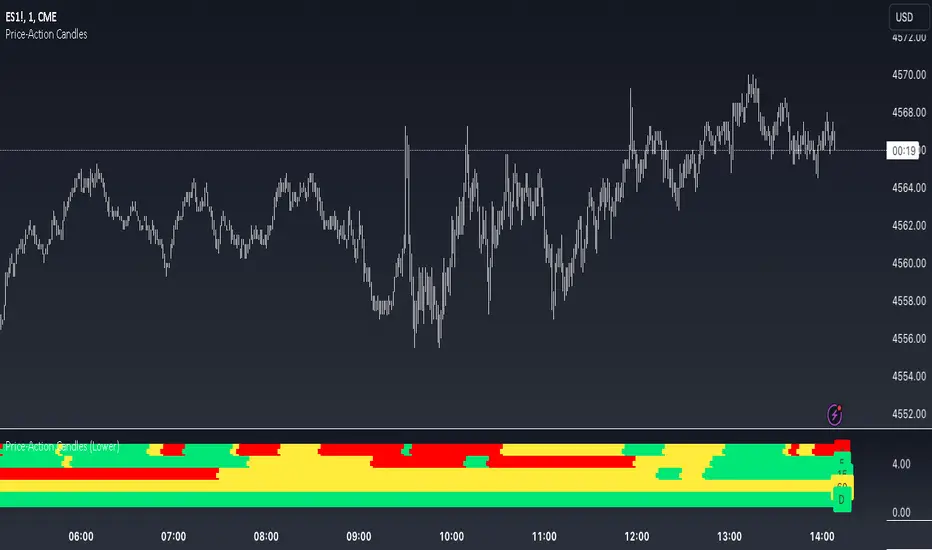
Price-Action Candles (Lower)What is a swing high or swing low?
Swing highs and lows are price extremes. For example say we set our swing length to 5. A candle that is a swing high with a swing length of 5 will have 5 bars to the left that are lower and 5 bars to the right that are lower. A candle that is a swing low with a swing length of 5 will have 5 bars to the left that are higher and 5 bars to the right that are higher.
How is the trend coloring calculated?
The trend coloring is calculated the exact same way as our trend candles study... by storing and comparing historical swing lows and swing highs.
The pinescript code goes as follows:
The pinescript code goes as follows:
var int trend = na
trend := ((hh and high >= psh) or close > csh) ? 1 : ((ll and low <= psl) or close < csl) ? -1 : lh or hl ? 0 : trend
What does that gibberish mean?
-Trend can be GREEN IF
- We have a higher high (current swing high is greater than the previous swing high) and the high is greater than the previous swing high
- OR The current close is greater than the current swing high
-Trend can be RED IF
- We have a lower low (current swing low is less than the previous swing low) and the low is less than the previous swing low
- OR The current close is less than the current swing low
-Trend can be YELLOW IF
- We have a new swing high and the new swing high is less than the previous swing high
- OR We have a new swing low and the new swing low is greater than the previous swing low
If none of the conditions above are true then we continue with whatever color the previous bar was.
What is repainting?
Repainting is "script behavior causing historical vs realtime calculations or plots to behave differently." That definition comes directly from Tradingview. If you want to read the full explanation you can visit it here www.tradingview.com . The price-action candles use swing highs and swing lows which need bars to the left (past) and bars to the right ("future") in order to confirm the swing level. Because of the need to wait for confirmation for swing levels the plot style can be repainting. The Price-Action Candles (Lower) indicator, or this indicator, has no repainting anywhere. We opt to not shift back the candle coloring which causes the repainting, but it is relevant to discuss since this indicator's sibling (Price-Action Candles) can have repainting labels.
Repaint
Here the labels are shifted back the price-action length. Repainting is not present in the Price-Candles (Lower) study, but can be found in this indicator's sibling (Price-Action Candles).
Non-Repaint
Here the labels are not shifted back or "repainted". Repainting is not present in the Price-Candles (Lower) study, but can be found in this indicator's sibling (Price-Action Candles).
Multi-timeframe Analysis
The users can view multi-timeframe historical price action trend via this lower study. Each timeframe is plotted as its own on the lower pane and you can determine what timeframe it is by the label next to the plot.
More examples
Pair the Price-Action Candles (Lower) indicator with our main price indicator that colors candles based on trend and can show price action labels.
Price-Action CandlesWhat is a swing high or swing low?
Swing highs and lows are price extremes. For example say we set our swing length to 5. A candle that is a swing high with a swing length of 5 will have 5 bars to the left that are lower and 5 bars to the right that are lower. A candle that is a swing low with a swing length of 5 will have 5 bars to the left that are higher and 5 bars to the right that are higher.
How are the trend candles calculated?
The trend candles are calculated by storing and comparing historical swing lows and swing highs.
The pinescript code goes as follows:
The pinescript code goes as follows:
var int trend = na
trend := ((hh and high >= psh) or close > csh) ? 1 : ((ll and low <= psl) or close < csl) ? -1 : lh or hl ? 0 : trend
What does that gibberish mean?
-Candle can be GREEN IF
- We have a higher high (current swing high is greater than the previous swing high) and the high is greater than the previous swing high
- OR The current close is greater than the current swing high
-Candle can be RED IF
- We have a lower low (current swing low is less than the previous swing low) and the low is less than the previous swing low
- OR The current close is less than the current swing low
-Candle can be YELLOW IF
- We have a new swing high and the new swing high is less than the previous swing high
- OR We have a new swing low and the new swing low is greater than the previous swing low
If none of the conditions above are true then we continue with whatever color the previous bar was.
What is repainting?
Repainting is "script behavior causing historical vs realtime calculations or plots to behave differently." That definition comes directly from Tradingview. If you want to read the full explanation you can visit it here www.tradingview.com . The price-action candles use swing highs and swing lows which need bars to the left (past) and bars to the right ("future") in order to confirm the swing level. Because of the need to wait for confirmation to for swing levels the plot style can be repainting. With the price-action candles indicator the only repainting part of the indicator is the labels. The price-action candles themselves WILL NOT REPAINT. The labels however can be set to repaint or not depending on the user preference. If the user opts to use repainting then the label location is shifted back by the length of the price-action. So if the "Price-Action Length" input is set to 10, and the user wants repainting, the swing high/low label will be shifted back 10 bars. If the user opts for no repainting, the label will not be shifted and instead show on the exact bar the swing level was confirmed.
Examples Below.
Repaint
Here the labels are shifted back the price-action length.
Non-Repaint
Here the labels are not shifted back because the input setting is set to not repaint.
Multi-timeframe Analysis
The users can view the trend from multiple different timeframes at once with a table displayed at the bottom of their charts. The timeframe can be lower or higher than the chart timeframe.
More examples
Be on the lookout for the Price Action Candles (Lower) indicator where you can view the multi-timeframe labels on a lower price grid in order to see the history over time!

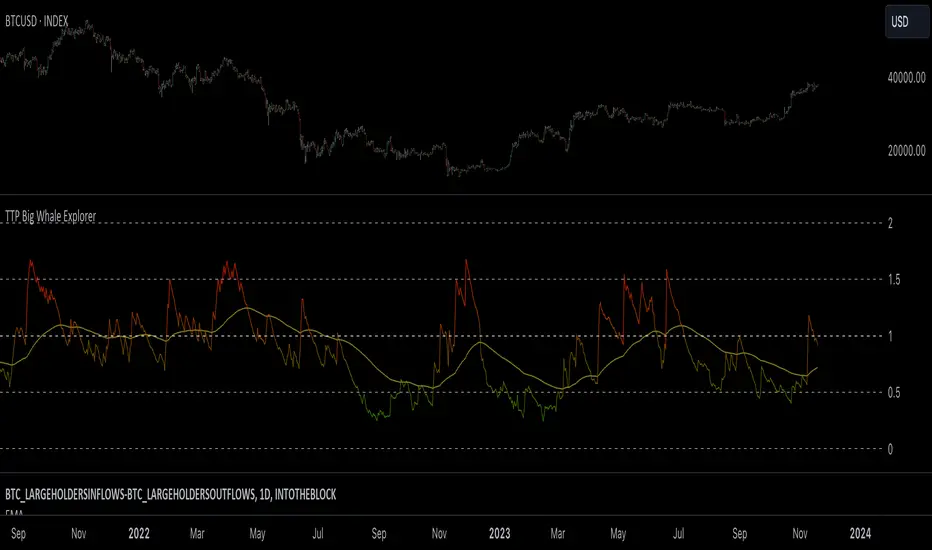
TTP Big Whale ExplorerThe Big Whale Explorer is an indicator that looks into the ratio of large wallets deposits vs withdrawals.
Whales tend to sale their holding when they transfer their holdings into exchanges and they tend to hold when they withdraw.
In this overlay indicator you'll be able to see in an oscillator format the moves of large wallets.
The moves above 1.5 turn into red symbolising that they are starting to distribute. This can eventually have an impact in the price by causing anything from a mild pullback to a considerable crash depending on how much is being actually sold into the market.
Moves below 0.5 mean that the large whales are heavily accumulating and withdrawing. During these periods price could still pullback or even crash but eventually the accumulation can take prices to new highs.
Instructions:
1) Load INDEX:BTCUSD or BNC:BLX to get the most historic data as possible
2) use the daily timeframe
3) load the indicator into the chart
Logical Trading Indicator V.1Features of the Logical Trading Indicator V.1
ATR-Based Trailing Stop Loss
The Logical Trading Indicator V.1 utilizes the Average True Range (ATR) to implement a dynamic trailing stop loss. You can customize the sensitivity of your alerts by adjusting the ATR Multiple and ATR Period settings.
Higher ATR Multiple values create wider stops, while lower values result in tighter stops. This feature ensures that your trades are protected against adverse price movements. For best practice, use higher values on higher timeframes and lower values on lower term timeframes.
Bollinger Bands
The Logical Trading Indicator V.1 includes Bollinger Bands, which can be customized to use either a Simple Moving Average (SMA) or an Exponential Moving Average (EMA) as the basis.
You can adjust the length and standard deviation multiplier of the Bollinger Bands to fine-tune your strategy. The color of the basis line changes to green when price is above and red when price is below the line to represent the trend.
The bands show a range vs a single band that also represents when the price is in overbought and oversold ranges similar to an RSI. These bands also control the take profit signals.
You also have the ability to change the band colors as well as toggle them off, which only affects the view, they are still active which will still fire the take profit signals.
Momentum Indicator
Our indicator offers a momentum filter option that highlights market momentum directly on the candlesticks, identifying periods of bullish, bearish, or consolidation phases. You can enable or disable this filter as needed, providing valuable insights into market conditions.
By default, you will see the candlestick colors represent the momentum direction as green or red, and consolidation periods as white, but the filter on the BUY and SELL signals is not active. The view options and filter can be toggled on and off in the settings.
Buy and Sell Signals
The Logical Trading Indicator V.1 generates buy and sell signals based on a combination of ATR-based filtering, Bollinger Band basis crossover, and optional momentum conditions if selected in the settings. These signals help you make informed decisions about when to enter or exit a trade. You can also enable a consolidation filter to stay out of trades during tight ranges.
Basically a BUY signal fires when the price closes above the basis line, and the price meets or exceeds the ATR multiple from the previous candle length, which is also editable in the settings.
If the momentum filter is engaged, it will not fire BUY signals when in consolidation periods. It works just the opposite for SELL signals.
Take Profit Signals
We've integrated a Take Profit feature that helps you identify points to exit your trades with profits. The indicator marks Long Take Profit when prices close below the upper zone line of the Bollinger Bands after the previous candle closes inside the band, suggesting an optimal point to exit a long trade or consider a short position.
Conversely, Short Take Profit signals appear when prices close above the lower zone after the previous candle closes inside of it, indicating the right time to exit a short trade or contemplate a long position.
Alerts for Informed Trading
The Logical Trading Indicator V.1 comes equipped with alert conditions for buy signals, sell signals, take profit points, and more. Receive real-time notifications to your preferred devices or platforms to stay updated on market movements and trading opportunities.

3x MTF MACD v3.0MACD's on 3 different Time Frames
Indicator Information
- Each Time Frame shows start of Trend and end of trend of the MACD vs the Signal Cross
- They are labled 1,2,3 with respective up or down triangle for possible direction.
User Inputs
- configure the indicator by specifying various inputs. These inputs include colors for bullish
and bearish conditions, the time frame to use, whether to show a Simple Moving Average
(SMA) line, and other parameters.
- Users can choose time frames for analysis (like 30 minutes, 1 hour, etc.)
but they must be in mintues.
- The code also allows users to customize how the indicator looks on the chart by providing
options for position and color.
Main Calculations
- The script calculates the Simple Moving Average (SMA) based on the user-defined time
frame.
- It then determines the color of the plot (line) based on certain conditions, such as whether
the SMA is rising or falling. These conditions help users quickly identify market trends.
Label Creation
- The code creates labels that can be displayed on the chart.
These labels indicate whether there's a bullish or bearish signal.
Level Detection
- The script determines and labels key levels or points of interest in the chart based on
certain conditions.
- It can show labels like "①" and "▲" for bullish conditions and "▼" for bearish conditions.
Table Display
- There's an option to show a table on the chart that displays information about the MACD
indicator Chosen and the NUmber Bubble assocated with that time frame
- The table can include information like which time frame is being analyzed, whether the SMA
line is shown, and other relevant data.
Plotting on the Chart
- The script plots the Simple Moving Average (SMA) on the chart. The color of this line
changes based on the calculated trend conditions.
ATR (Average True Range)
- The script also plots the Average True Range (ATR) on the chart. ATR is used to measure
market volatility.
"In essence, this script is a highly customizable MACD and SMA indicator for traders. It assists traders in comprehending market trends, offering insights into different MACD cycles concerning various timeframes.
Users can configure it to match their trading strategies, and it presents information in a user-friendly manner with colors, labels, and tables.
This simplifies market analysis, allowing traders to make more informed decisions without the distraction of multiple indicators."

Astro: Planetary Aspects v2.0I have updated the excellent script originally written by @BarefootJoey with additional functionality as listed below the script's original description:
@BarefootJoey:
In astrology, planetary aspects refer to the angles formed between two or more planets in a horoscope or birth chart. These angles are created by the positions of the planets in the sky and are thought to represent a particular energy or influence that can impact events on Earth.
The most common planetary aspects are the conjunction (when two planets are in the same position in the zodiac), the opposition (when two planets are direct across from each other in the zodiac), the trine (when two planets are 120 degrees apart in the zodiac), and the square (when two planets are 90 degrees apart in the zodiac).
This oscillator plots the current geocentric/heliocentric aspect for up to two planets and features a customizable precision of degree (up to +/- 15 degrees) for each aspect.
Additional functionality added in by @Yevolution:
1. Overlay the indicator plot on top of the main chart, with the indicator's scale placed on the left - I found it easier to spot price reactions at a given planetary aspect vs seeing the plot in a separate frame
2. Add options to plot a vertical bar for every occurrence of chosen aspects
The script source code has remained open and additional comments have been added by me to explain the changes where relevant.
When I get some more spare time I will add a function to enable future planetary aspect events to also be displayed on the chart to make forecasting using this data easier.

Supertrend x4 w/ Cloud FillSuperTrend is one of the most common ATR based trailing stop indicators.
The average true range (ATR) plays an important role in 'Supertrend' as the indicator uses ATR to calculate its value. The ATR indicator signals the degree of price volatility. In this version you can change the ATR calculation method from the settings. Default method is RMA, when the alternative method is SMA.
The indicator is easy to use and gives an accurate reading about an ongoing trend. It is constructed with two parameters, namely period and multiplier.
The implementation of 4 supertrends and cloud fills allows for a better overall picture of the higher and lower timeframe trend one is trading a particular security in.
The default values used while constructing a supertrend indicator is 10 for average true range or trading period.
The key aspect what differentiates this indicator is the Multiplier. The multiplier is based on how much bigger of a range you want to capture. In our case by default, it starts with 2.636 and 3.336 for Set 1 & Set 2 respectively giving a narrow band range or Short Term (ST) timeframe visual. On the other hand, the multipliers for Set 3 & Set 4 goes up to 9.736 and 8.536 for the multiplier respectively giving a large band range or Long Term (LT) timeframe visual.
A ‘Supertrend’ indicator can be used on equities, futures or forex, or even crypto markets and also on minutes, hourly, daily, and weekly charts as well, but generally, it fails in a sideways-moving market. That's why with this implementation it enables one to stay out of the market if they choose to do so when the market is ranging.
This Supertrend indicator is modelled around trends and areas of interest versus buy and sell signals. Therefore, to better understand this indicator, one must calibrate it to one's need first, which means day trader (shorter timeframe) vs swing trader (longer time frame), and then understand how it can be utilized to improve your entries, exits, risk and position sizing.
Example:
In this chart shown above using SPX500:OANDA, 15R Time Frame, we can see that there is at any give time 1 to 4 clouds/bands of Supertrends. These four are called Set 1, Set 2, Set 3 and Set 4 in the indicator. Set's 1 & 2 are considered short term, whereas Set's 3 & 4 are considered long term. The term short and long are subjective based on one's trading style. For instance, if a person is a 1min chart trader, which would be short term, to get an idea of the trend you would have to look at a longer time frame like a 5min for instance. Similarly, in this cases the timeframes = Multiplier value that you set.
Optional Ideas:
+ Apply some basic EMA/SMA indicator script of your choice for easier understanding of the trend or to allow smooth transition to using this indicator.
+ Split the chart into two vertical layouts and applying this same script coupled with xdecow's 2 WWV candle painting script on both the layouts. Now you can use the left side of the chart to show all bearish move candles only (make the bullish candles transparent) and do the opposite for the right side of the chart. This way you enhance focus to just stick to one side at a given time.
Credits:
This indicator is a derivative of the fine work done originally by KivancOzbilgic
Here is the source to his original indicator: ).
Disclaimer:
This indicator and tip is for educational and entertainment purposes only. This not does constitute to financial advice of any sort.

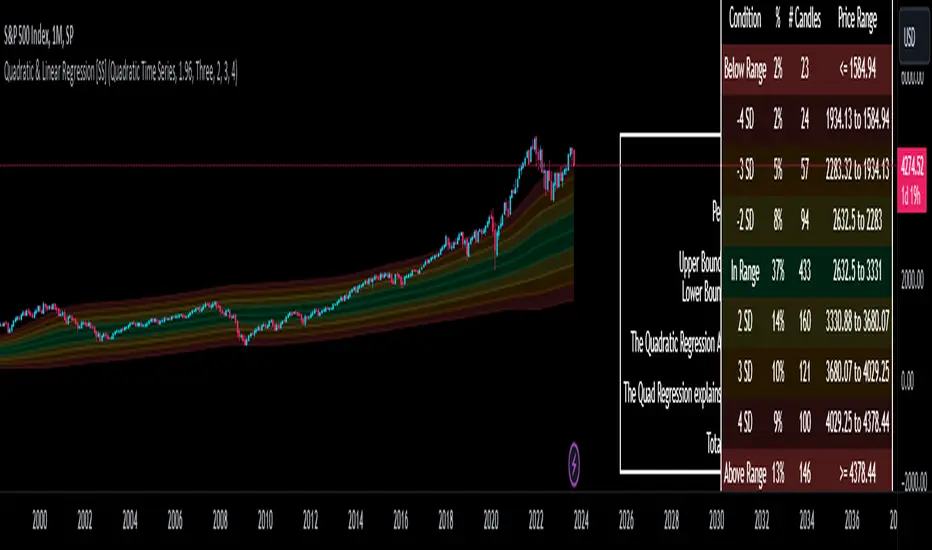
Quadratic & Linear Time Series Regression [SS]Hey everyone,
Releasing the Quadratic/Linear Time Series regression indicator.
About the indicator:
Most of you will be familiar with the conventional linear regression trend boxes (see below):
This is an awesome feature in Tradingview and there are quite a few indicators that follow this same principle.
However, because of the exponential and cyclical nature of stocks, linear regression tends to not be the best fit for stock time series data. From my experience, stocks tend to fit better with quadratic (or curvlinear) regression, which there really isn't a lot of resources for.
To put it into perspective, let's take SPX on the 1 month timeframe and plot a linear regression trend from 1930 till now:
You can see that its not really a great fit because of the exponential growth that SPX has endured since the 1930s. However, if we take a quadratic approach to the time series data, this is what we get:
This is a quadratic time series version, extended by up to 3 standard deviations. You can see that it is a bit more fitting.
Quadratic regression can also be helpful for looking at cycle patterns. For example, if we wanted to plot out how the S&P has performed from its COVID crash till now, this is how it would look using a linear regression approach:
But this is how it would look using the quadratic approach:
So which is better?
Both linear regression and quadratic regression are pivotal and important tools for traders. Sometimes, linear regression is more appropriate and others quadratic regression is more appropriate.
In general, if you are long dating your analysis and you want to see the trajectory of a ticker further back (over the course of say, 10 or 15 years), quadratic regression is likely going to be better for most stocks.
If you are looking for short term trades and short term trend assessments, linear regression is going to be the most appropriate.
The indicator will do both and it will fit the linear regression model to the data, which is different from other linreg indicators. Most will only find the start of the strongest trend and draw from there, this will fit the model to whatever period of time you wish, it just may not be that significant.
But, to keep it easy, the indicator will actually tell you which model will work better for the data you are selecting. You can see it in the example in the main chart, and here:
Here we see that the indicator indicates a better fit on the quadratic model.
And SPY during its recent uptrend:
For that, let's take a look at the Quadratic Vs the Linear, to see how they compare:
Quadratic:
Linear:
Functions:
You will see that you have 2 optional tables. The statistics table which shows you:
The R Squared to assess for Variance.
The Correlation to assess for the strength of the trend.
The Confidence interval which is set at a default of 1.96 but can be toggled to adjust for the confidence reading in the settings menu. (The confidence interval gives us a range of values that is likely to contain the true value of the coefficient with a certain level of confidence).
The strongest relationship (quadratic or linear).
Then there is the range table, which shows you the anticipated price ranges based on the distance in standard deviations from the mean.
The range table will also display to you how often a ticker has spent in each corresponding range, whether that be within the anticipated range, within 1 SD, 2 SD or 3 SD.
You can select up to 3 additional standard deviations to plot on the chart and you can manually select the 3 standard deviations you want to plot. Whether that be 1, 2, 3, or 1.5, 2.5 or 3.5, or any combination, you just enter the standard deviations in the settings menu and the indicator will adjust the price targets and plotted bands according to your preferences. It will also count the amount of time the ticker spent in that range based on your own selected standard deviation inputs.
Tips on Use:
This works best on the larger timeframes (1 hour and up), with RTH enabled.
The max lookback is 5,000 candles.
If you want to ascertain a longer term trend (over years to months), its best to adjust your chart timeframe to the weekly and/or monthly perspective.
And that's the indicator! Hopefully you all find it helpful.
Let me know your questions and suggestions below!
Safe trades to all!
Abz US Real ratesThis indicator shows Fed Funds Rate vs US inflation. It also shows the US 10 year bond yield and provides a color indication that aims to indicate if this is a period where owning TLT is a good idea or not. It is not investment advice and it is only aiming to indicate whether the trend is supportive or not for long dated US bonds in comparison with short dated treasury bills and versus inflation.
Recessions: Recessions are indicated by a grey background.
Yield inversion: Periods where the Fed Funds Rate is above the US 10 year bond yield are shown as a maroon background and frequently are macro indicators of an upcoming recession. Like other macro signals, this can't be relied upon as a timing tool.
This is intended to be used as an indictor on a long term chart. Minimum would be weekly but could be even more valid to focus on a chart with monthly candles.

Volume HeatMap With Profile [ChartPrime]The Volume Heatmap with Profile indicator is a tool designed to provide traders with a comprehensive view of market activity through customizable visualizations. This indicator goes beyond traditional volume analysis by offering a range of adjustable parameters and features that enhance analysis of volume and give a cleaner experience when analyzing it.
To get started click the start and end time for the profile.
Key Features:
Extended Calculation: This indicator extends its calculation to the last bar, ensuring that the user has insights into current market dynamics.
Point of Control (POC): Easily identify the price level at which the highest trading activity has occurred, helping the user pinpoint potential reversal points and significant support/resistance zones.
VWAP Point of Control: Display the Volume Weighted Average Price (VWAP) Point of Control, giving the user a clear reference for determining the average price traders are paying and potential price reversals.
Adjustable Colors for Heatmap: Change the heatmap colors to the users preference, allowing the user to match the indicator's appearance to their chart style and personal visual preferences.
Forecasted Zone: This feature allows traders to forecast areas of high activity by providing the option to adjust colors within this zone. This feature assists in identifying potential breakouts or areas where increased trading volume is anticipated.
Volume Profile: Customize the colors of the volume profile to make it distinct and easily distinguishable on the chart.
Adjustable Volume Levels: Specify the number volume levels that are most relevant to your trading strategy.
Adjustable Placement for Volume Profile: Position the volume profile on the chart. Whether the user prefers it on the left, right, or at the center of the chart, this indicator offers placement flexibility.
The ratio of bull vs bear volume is plotted on the outside of the range indicating how bullish or bearish price action is in a given range.

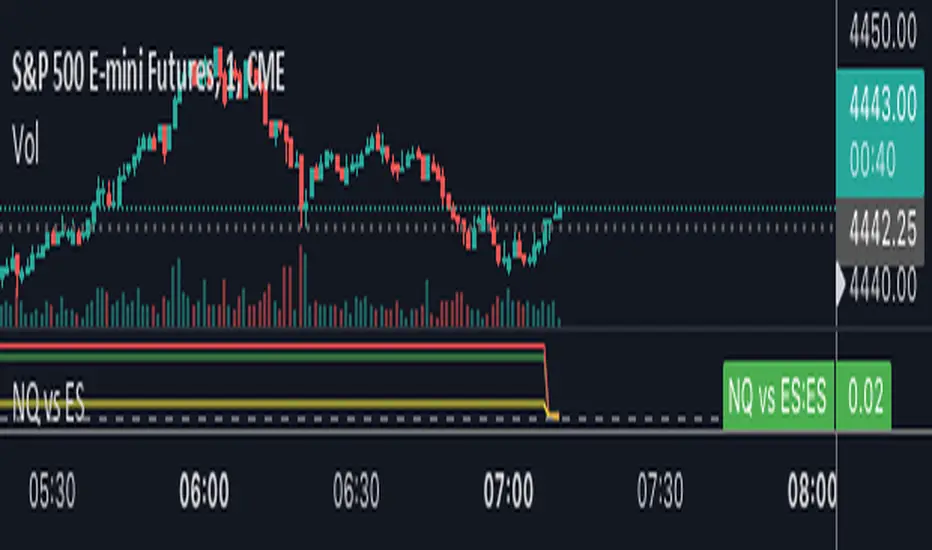
NQ vs ESThe script shows the spread between the realtime NQ and ES percentage change from the day before, from which it is possible to see if NQ is outperforming or underperforming the ES.