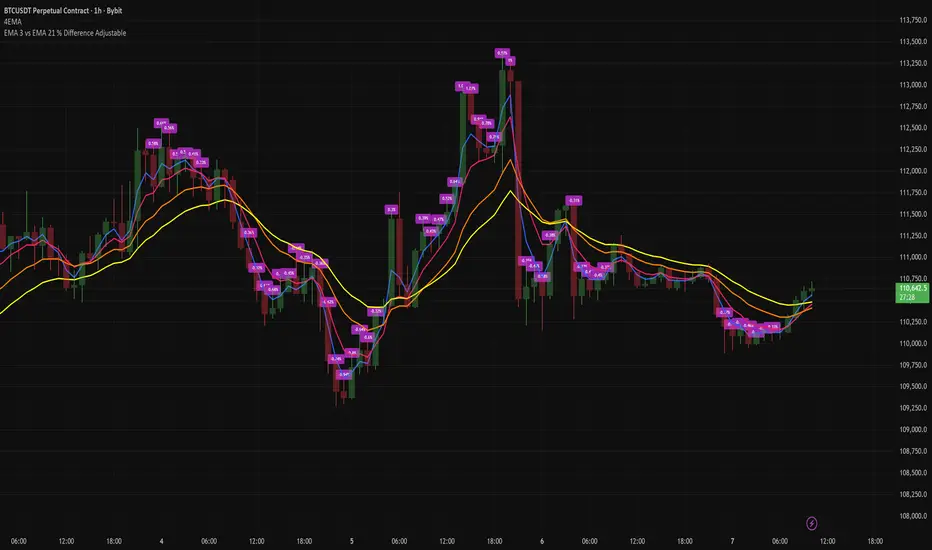
EMA 3 vs EMA 21 % Difference AdjustableTitle: EMA 3 vs EMA 21 % Difference with Adjustable Labels
Description:
This script calculates the percentage difference between EMA 3 and EMA 21 and displays it directly on the chart as a label. Labels are shown only when the difference exceeds a user-defined threshold, helping traders easily spot significant deviations.
Features:
Calculates EMA 3 and EMA 21.
Displays percentage difference as labels above or below candles.
Adjustable label style and size.
User-defined percentage threshold for label visibility.
Plots EMA lines for visual reference.
Ideal for traders who want to monitor short-term EMA divergence relative to a longer-term trend in a clean and customizable way.
在腳本中搜尋"采列VS新圣徒"
1H Candlestick vs EMA Crossover# Description — 1H Candlestick vs EMA Crossover (Pine Script)
This indicator is built in **TradingView Pine Script v5** and is designed to track the relationship between the **1‑hour candlestick close** and the **1‑hour Exponential Moving Average (EMA)**. It works on any chart timeframe but always pulls in **1H data** using `request. security`.
### Core Features
* **Customizable EMA length** (default = 200)
* **Plots the 1H EMA** as an orange line on your chart
* Optionally shows the **1H close** as a faint gray line for reference
* Detects and highlights when the **1H candle close crosses above or below the 1H EMA**
* **Arrows**: Green triangles appear below the bar when a bullish crossover happens (1H close > EMA); red triangles appear above the bar when a bearish crossover happens (1H close < EMA)
* **Alerts**: Built‑in `alert condition` statements let you create TradingView alerts whenever a crossover occurs
### How to Use
1. Adjust the EMA length if you want a faster or slower moving average.
2. Enable alerts: Right‑click the chart → Add Alert → choose this indicator and select either “crossed ABOVE EMA” or “crossed BELOW EMA.”
### Trading Applications
* **Trend Confirmation**: Use the 1H EMA as a higher‑timeframe filter while trading on lower timeframes.
* **Entry/Exit Signals**: Crossovers can mark potential entry points for trend continuation or reversals.
* **Scalping/Intraday**: Even on a 5m or 15m chart, you can overlay the 1H EMA to align your trades with the bigger trend.
This makes the indicator a simple yet powerful tool for aligning trades with higher‑timeframe momentum and avoiding false signals from lower‑timeframe noise.

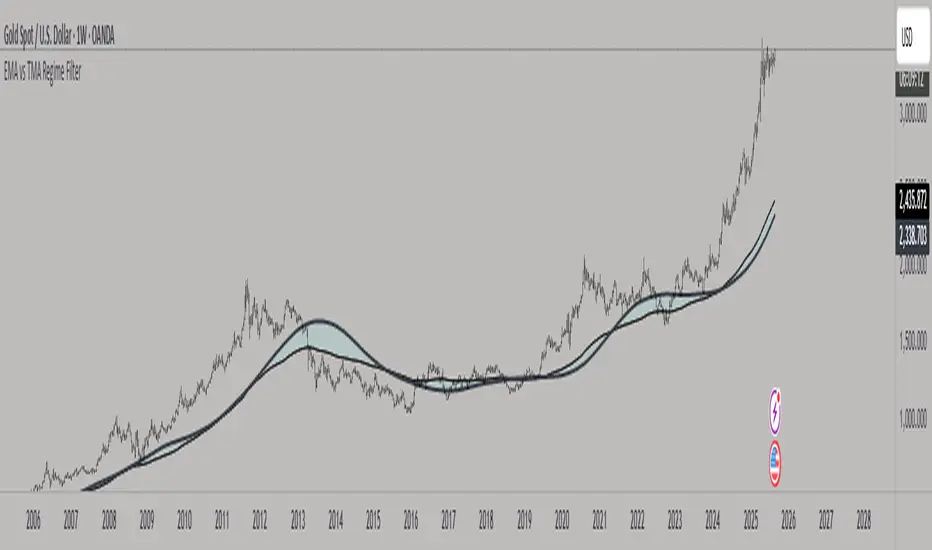
EMA vs TMA Regime FilterEMA vs TMA Regime Filter
This indicator is built as a visual study tool to compare the behavior of the Exponential Moving Average (EMA) and the Triangular Moving Average (TMA).
The EMA applies an exponential weighting to price data, giving stronger importance to the most recent values. This makes it a faster, more responsive line that reflects short-term momentum. The TMA, by contrast, applies a double-smoothing process (or in the “True TMA” option, a split SMA sequence), which produces a much slower curve. The TMA emphasizes balance over reactivity, often used for filtering noise and observing longer-term structure.
When both are plotted on the same chart, their differences become clear. The shaded region between them highlights times when short-term price dynamics diverge from longer-term smoothing. This is where the idea of “regime” comes in — not as a trading signal, but as a descriptive way of seeing whether market action is currently dominated by speed or by stability.
Users can customize:
Line styles, widths, and colors.
Cloud transparency for visual clarity.
Whether to color bars based on relative position (optional, purely visual).
The goal is not to create a system, but to help traders experiment, observe, and learn how different smoothing techniques can emphasize different aspects of price. By switching between the legacy and true TMA, or adjusting lengths, users can study how each approach interprets the same data differently.
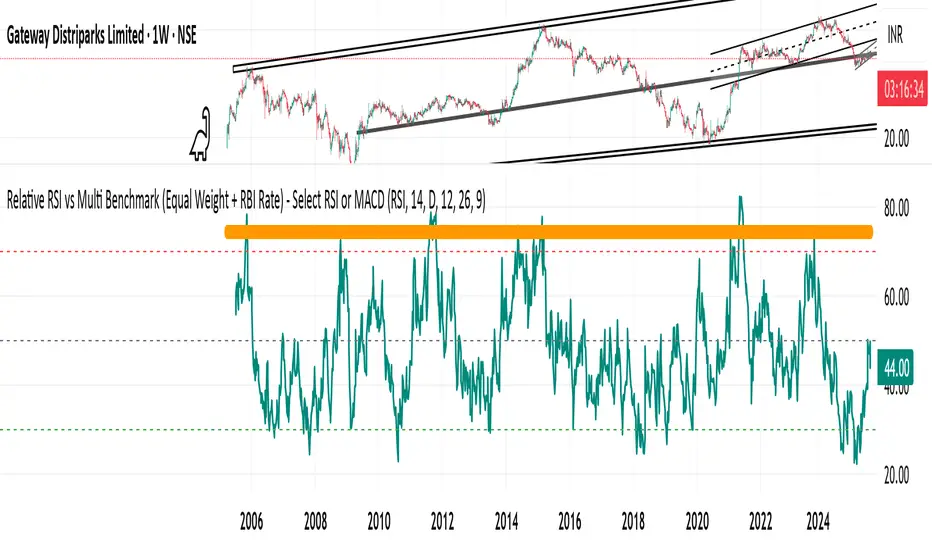
Relative RSI vs Multi Benchmark (Equal Weight + RBI Rate)Relative RSI vs Multi Benchmark (Equal Weight + RBI Rate) - Select RSI or MACD
Alt Season vs USDT Flow DashboardWhat the script tells you (the signals)
It builds four “alt vs stables” lenses and colors the background when they agree.
ALT ex-ETH / STABLES (TOTAL3 / (USDT+USDC+DAI))
Think: “How much alt cap per $1 of dry-powder stables?”
Bullish when price is above its 200-day SMA and rising → risk appetite expanding toward smaller alts.
ALT Share of Risk-On ((TOTAL − STABLES − BTC − ETH) / (TOTAL − STABLES))
Of the non-stable crypto pie, how much is flowing to ex-BTC/ETH alts?
Uptrend = broadening alt participation (late-early to mid alt-season behavior).
Dominance Spread ((TOTAL3 / TOTAL) − (STABLES / TOTAL))
Alts’ share minus stables’ share.
Widening spread means stables are being converted into alts (not just into BTC).
Flow Ratio ROC(TOTAL3, N) / ROC(STABLES, N) (default N=30 days)
Compares alts’ growth rate to stable supply growth.
> 1 and sustained → alts expanding faster than new “dry powder” is appearing.
The background color (“regime”)
Green (ALT-on) when all three conditions align:
ALT/Stable > its SMA
Dominance Spread > its SMA
Flow Ratio > 1
Red (ALT-off) when the opposite holds.
No color = mixed/chop.
How to read it (quick playbook)
Early alt-season tell:
BTC.D starts to slip, total market cap (TOTAL) rising.
ALT/Stable breaks above its 200-SMA and stays there.
Dominance Spread climbs (alts gaining share, stables losing share).
Flow Ratio > 1 for a few weeks.
Maturing phase: ALT Share of Risk-On rises (money broadens from ETH/L1s → mid/small caps).
Exhaustion/false start: Flow Ratio dips < 1 or ALT/Stable loses the 200-SMA while BTC.D stabilizes or rises.
Practical tips
Timeframes: Make calls on 1D. Use 1W to avoid whipsaw; use 4H only for entries once the 1D regime is green.
Smoothing: If you see noisy spikes from market-cap revisions, add a light smoother (e.g., 7D SMA on the plotted lines).
Parameters:
Try ROC length 21–45 days.
Try SMA 150–250 days (200 is a good middle).
Confluence: Keep BTC.D and ETH.D in another pane. Best alt windows: BTC.D trending down, ETH.D flat-to-up initially, then ETH.D flattens as TOTAL3 momentum spreads to mid/small caps.
Risk checks: If USDT.D/USDC.D (stable dominance) spike up while your signals are green, that’s a caution flag (capital retreating to stables).

Relative Weighted Rate of Change (WROC) vs Nifty 50Relative Weighted Rate of Change (WROC) vs Nifty 50

ALTSEASON Monitor: Macro vs Crypto (normalized)ALTSEASON Monitor: Macro vs Crypto (normalized)
Set 1W or 1M timeframe for the macro picture.
If your provider does not have some symbols, change the tickers in the script settings (for example, ETHBTC from another exchange).
For detailed trading, keep this monitor on the second window and watch local entries on individual charts.

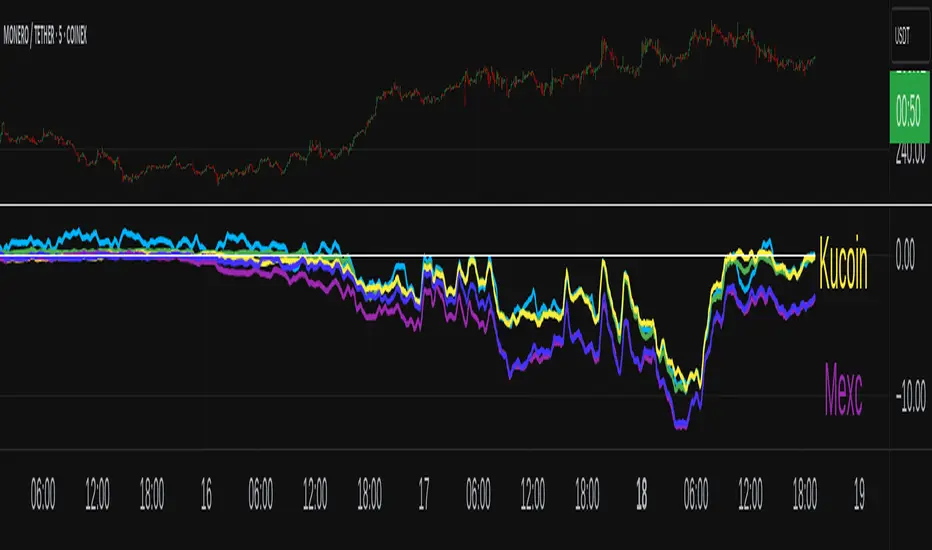
XMR Divergences vs KrakenSUMMARY
This script finds the percentage difference between Kraken, and multiple other exchanges, for the price of XMRUSD, and then runs a variable length moving average of those differences. Optionally, you can multiply by the reported volume of the exchange in question. Skip to "USAGE" at the bottom for a quick view of the settings. But I recommend reading DETAILED DESCRIPTION as well.
PURPOSE
The purpose of this script is to get a look into the relative funds flows of XMR between Kraken and the other exchanges. So long as an exchange withdraws are open: 1) Negative divergences indicate XMR outflows from the exchange under consideration, 2) Postive divergences indicate XMR inflows from Kraken to the exchange.
This appears to be moderately correlated with price movements in Monero (but not always). There is also the theory that positive accumulation is a leading indication of a growing probability of postive price action in the general crypto market, and negative accumulation is a leading indicator of an upcoming peak. In other words, exchanges like to accumulate Monero quietly during calm downtimes, and they like to manage its price from gaining too much attention (pump) during broad market positivity.
BACKGROUND
It's well known among XMR traders that most exchanges are operating on a heavy fractional reserve basis as regards Monero. The past 2 years have seen regular and repeated withdraw freezes, sometimes for weeks/months at a time. Occasionally, liquidity stress tests have been performed, with predictable results - none of these exchanges are able to continue supporting withdraws.
Kraken is the only exchange of meaningful volume that has never frozen withdraws for more than an hour or so. Thus, we theorize that Kraken is operating with all, or most of the XMR they claim to have.
Furthermore, we have seen in the past, large price negative price divergences of these fractional reserve exchanges relative to Kraken. As the social outcry grew stronger for this malfeasance, these exchanges have gone to greater lengths to hide their price divergences.
On minute-by-minute ; hour-by-hour basis, typically, a look with the naked eye would show oscillation around the zero point. But when you average it out, especially on lower timeframes (like the 1 and 5 min candles), you can very clearly see that when withdraws are shut down, these exchanges simultaneously diverge their prices downwards as well.
DETAILED DESCRIPTION
The ideal view of price divergence would compare second-by-second prices, and then run something like a rolling 4-hr or 1-day SMA to average out the overall divergences. However, due to limitations of TradingView, this is impractical/impossible for actual usage/viewing. As a result, a balance must be struck, when selecting the combination of the candle period, and the SMA lookback length.
I find that 5min candles, with a 48-period lookback (that equates to a rolling 4-hour SMA), offers the best view of recent and historical price divergence activity. This of course means that we're only sampling price divergences once every 5 minutes, but it still provides a decent look at what's happening. If this script gets popular, I wouldn't be surprised if these exchanges start timing their candle closes to mask their misdeeds, but that's of course speculative on my part.
The other important factor here, *IS TO MULTIPLY BY VOLUME*. Some of these no-volume exchanges have large price divergences. But if they're not doing any real volume, then it doesn't really have any real market impact. Thus, I recommend keeping the "Make volume adjustment" option on.
If that ends up happening, we'll have to infer that by comparing the difference in close prices, vs the difference in the highest or lowest intra-candle prices (wicks). Typically a divergence should have all 3 showing similar results.
Notes regarding "Sum_of_All": This only makes sense when multiplying by volume. So only check this if you also made the volume adjustment. Generally I believe that *Binance* sets the tone. However, we have seen numerous occasions where Binance diverges down, and the others diverge up. I believe this is a social influence tactic, since most people look at Binance price. Meanwhile, they're trying to accumulate some small amount on the other exchanges to minimize their overall loss. This of course assumes collusion by these exchanges, which is a high likely hood, seeing as how in May 2021, they all diverged together simultaneously (among other evidence).
USAGE
I recommend using your browser zoom, to see data beyond 1 month in the past.
Lookback - The number of candles over which to conduct a moving average. On 5-min candles for example, here's how the math works out:
12 - Equates to a 1 hr MA
24 - 2 hrs
48 - 4 hrs (default)
288 - 1 day
2880 - 10 days
Make Volume Adjustment - Recommend that you usually keep this on.
Line Widths - Set to preference
Show_Close_Price? - You can compute the difference at candle close. Or you can check the other boxes to compare the highest/lowest prices for intra candle prices (wicks).
Show Sum_of_All? - You can sum all of the differences, which only makes sense if you're making the volume adjustement. Default is off. Below, you can also choose which exchanges to include in the sum.
This works best on lower timeframes, like the 1m, 5, and 15m charts. I personally use 5m, with 48 or 96 length lookback. You get a better view of the real time price divergences that way.
Market Energy – Trend vs Retest (with Saturation %)Market Energy – Trend vs Retest Indicator
This indicator measures the bullish and bearish energy in the market based on volume-weighted price changes.
It calculates two smoothed energy waves — bullish energy and bearish energy — using exponential moving averages of volume-adjusted price movements.
The indicator detects trend changes and retests by comparing the relative strength of these waves.
A saturation percentage quantifies the intensity of the current dominant side (bulls or bears) relative to recent highs.
- High saturation (>70%) indicates strong momentum and dominance by bulls or bears.
- Low saturation (<30%) suggests weak momentum and possible market indecision or consolidation.
The background color highlights the current control: green for bulls, red for bears, with transparency indicating the saturation level.
A label shows which side is currently in control along with the saturation percentage for quick interpretation.
Use this tool to identify strong trends, possible retests, and momentum strength to support your trading decisions.

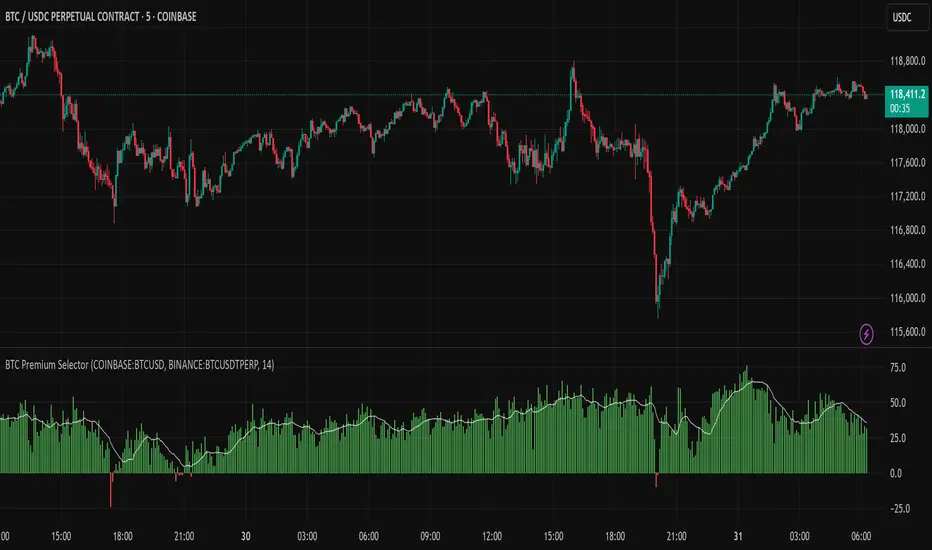
Multi CEX BTC Spot vs Perpetual PremiumThis Indicator shows the BTC Spot vs Perpetual premium across different CEX.
BTC vs MSTR PerformanceBTC vs MSTR Performance - BULL
• Green: MSTR has outperformed BTC over the selected time period.
• Red: BTC has outperformed MSTR during the same time period.
• Horizontal line at 0: Separates positive from negative outperformance.

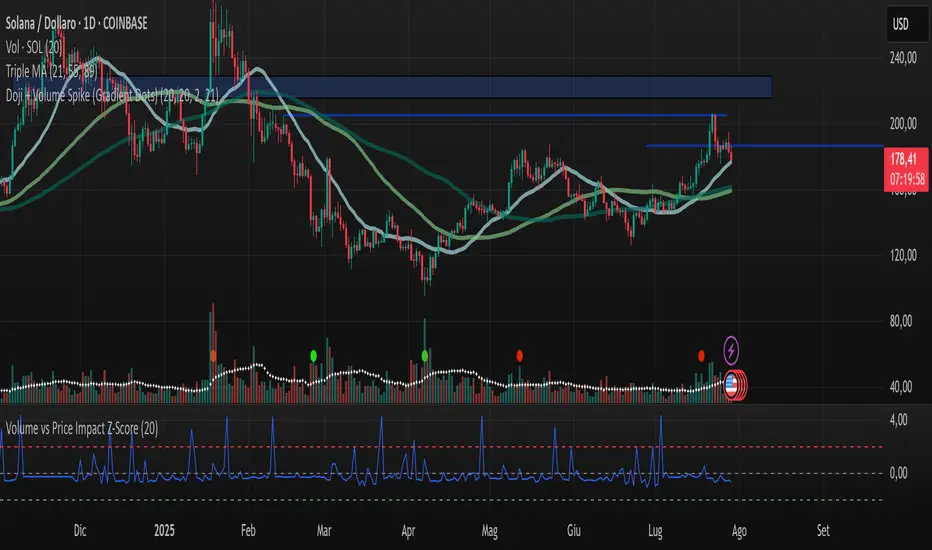
Volume vs Price Impact Z-ScoreVolume vs Price Impact Z‑Score
This indicator measures how disproportionate the traded volume is relative to the price movement of a candle.
Step 1: Volume-to-Price Impact (VPI)
VPI = Volume / (abs(Close - Open) + ε)
(or optionally using High - Low as the price range)
Step 2: Z‑Score Standardization
Z = (VPI - SMA(VPI, length)) / STDEV(VPI, length)
Interpretation:
Z > 2 → High volume with little price movement → possible absorption (accumulation/distribution).
Z < -2 → Large price move with low volume → weak or illiquid move (potential false breakout).
Use cases:
Detecting accumulation/distribution phases.
Highlighting false breakouts or weak price moves.
Supporting entry/exit decisions based on market efficiency (volume vs. price impact).
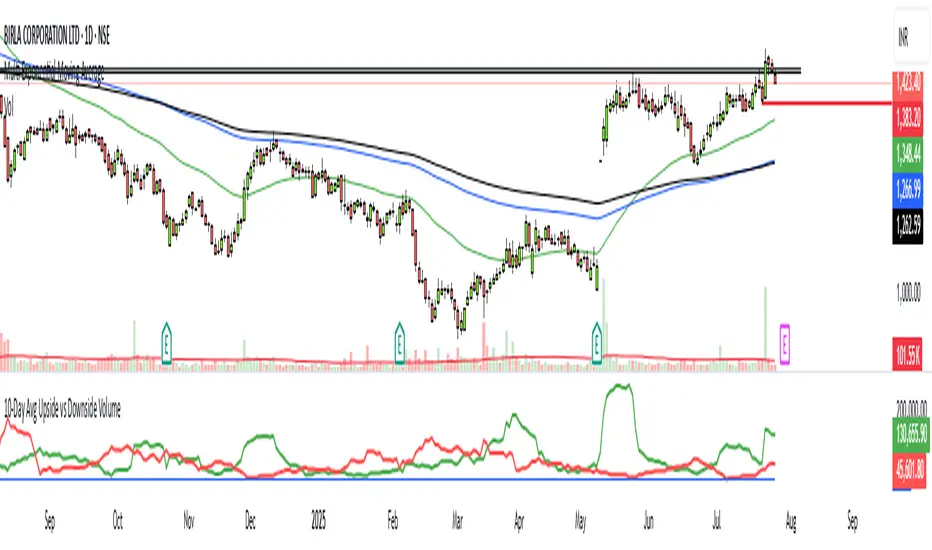
10-Day Avg Upside vs Downside VolumeUpside Volume: The total volume on days when the stock closes higher than the previous day.
Downside Volume: The total volume on days when the stock closes lower than the previous day.
It calculates the 10-day simple moving average of both upside and downside volumes.
An optional ratio line is included to visualize relative buying vs selling pressure.
Intraday vs Overnight OBV🔍 Purpose
This indicator provides a volume-weighted cumulative flow model that mimics On-Balance Volume (OBV) logic but splits the volume impact into intraday vs. overnight sessions. It allows traders to track how volume contributes to price movement in each session and identify whether buying/selling pressure is stronger during or outside of regular trading hours.
This indicator attempts to alleviate some of the downfalls of the standard OBV indicator, which only looks at total volume and total direction. The price of stocks generally behaves extremely differently during market hours and outside market hours, and many of the large moves happen outside of regular market hours on low volume.
⚙️ Core Features
1) OBV-style calculation:
If price increases → volume is added to the OBV stream.
If price decreases → volume is subtracted.
If price is flat → OBV remains unchanged.
2) Session splitting:
Intraday session: movement from today's open to close.
Overnight session: movement from yesterday’s close to today’s open.
Volume is split proportionally between these two periods based on user input.
3) Four visualization modes:
"Intraday" — plots only OBV from intraday price movement.
"Overnight" — plots only OBV from overnight price movement.
"Aggregate" — plots the sum of intraday and overnight OBV for a holistic view.
"Both Intraday and Overnight" — plots intraday and overnight OBV separately on the same chart.
📐 Inputs
1) Synthetic OBV Type:
"Intraday" — Show OBV from open to close only.
"Overnight" — Show OBV from prior close to today's open only.
"Aggregate" — Show a single line combining both.
"Both Intraday and Overnight" — Show both lines on the same chart.
2) Estimated Overnight Volume %:
Percentage of total daily volume assumed to occur during extended hours.
The rest is allocated to regular session (intraday).
Default: 20% overnight, 80% intraday.
🧮 How It Works
Volume Splitting:
Total bar volume is split into overnight Volume and intraday Volume:
Intraday change is the difference between today’s close and open.
Overnight change is the difference between today’s open and yesterday’s close.
Session OBV Calculations:
OBV is incremented/decremented by the session's allocated volume, depending on whether the session’s price change was positive or negative.
Aggregate OBV:
Combines both session deltas for a holistic volume flow view.
📊 Interpretation
Rising OBV (any stream) suggests accumulation; falling OBV suggests distribution.
Divergences between price and OBV lines (especially overnight vs. intraday) can reveal where hidden buying/selling is occurring.
Comparing intraday vs overnight OBV can help:
Spot whether institutional demand is building off-hours.
Detect retail vs. institutional behavior (retail trades often dominate intraday; institutional may prefer after-hours).
💡 Use Cases
Identify whether overnight gaps are supported by overnight volume momentum.
Detect accumulation in low-volume overnight sessions.
Compare intraday and overnight strength during earnings season or news events.
Complement traditional OBV by seeing session-based breakdowns.

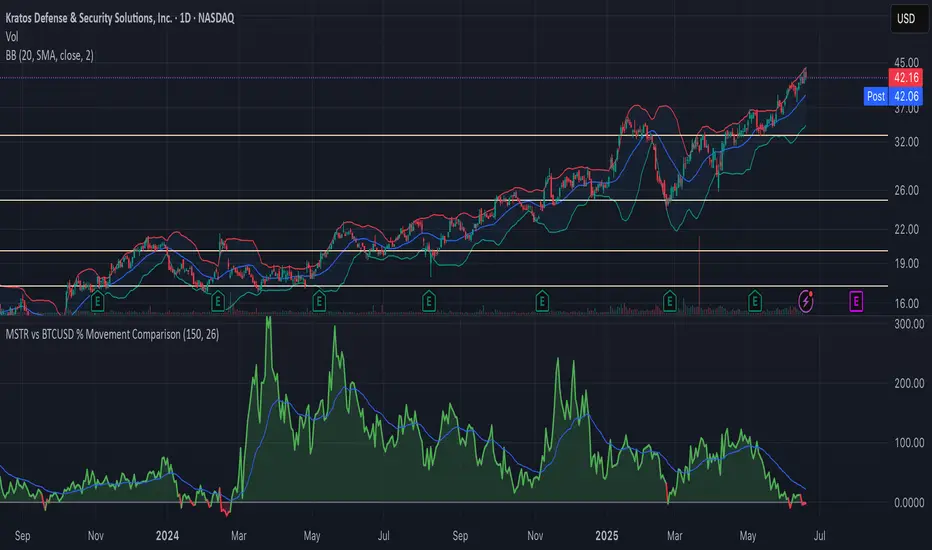
MSTR vs BTCUSD % Movement ComparisonThe indicator, in its current form, is a custom Pine Script (version 6) tool named "MSTR vs BTCUSD % Movement Comparison" that visually compares the percentage price movements of MicroStrategy (MSTR) and Bitcoin (BTCUSD) over a user-defined lookback period. It plots the difference in their percentage changes (diff_pct = mstr_pct - btcusd_pct) as a line, with a zero line for reference, and uses green/red coloring to indicate whether MSTR is outperforming (green, above zero) or underperforming (red, below zero) BTCUSD. The area between the difference line and zero line is filled with semi-transparent green or red for clarity. Additionally, an adjustable-period Exponential Moving Average (EMA) of the percentage difference smooths the trend, helping identify momentum shifts. The indicator is fixed to compare MSTR and BTCUSD, ensuring consistent output regardless of the chart’s active symbol (e.g., MSTR, MTPLF, or others).
Key Features:
Percentage Difference: Shows MSTR’s percentage change minus BTCUSD’s, highlighting relative performance.
Zero Line: A gray solid line at 0 for reference.
Color Coding: Green line/fill when MSTR outperforms, red when it underperforms.
Adjustable EMA: User-defined EMA period (default: 26) smooths the percentage difference.
Fixed Comparison: Always compares MSTR vs. BTCUSD, unaffected by the chart’s symbol.
User Inputs: Lookback period (default: 50 bars) and EMA period (default: 26) are customizable.
Example: On a 1-hour chart, if MSTR rises 4% and BTCUSD rises 1% over 50 bars, the difference line plots at +3 (green) with green fill, and the 26-period EMA might be at +2.2, indicating MSTR’s outperformance trend.
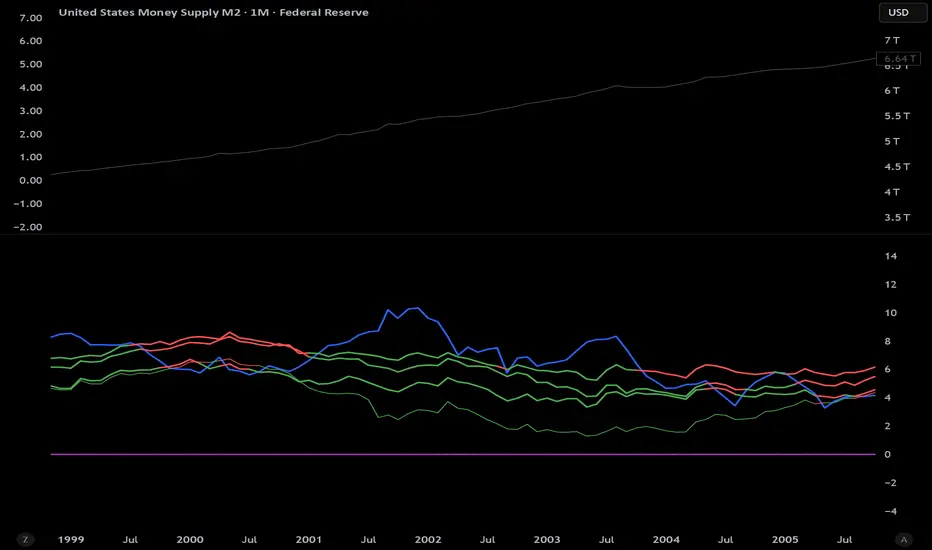
M2 Growth Rate vs Borrowing RateHave you ever wondered how fast M2 is actually growing? Have you ever wanted to compare its percentage growth rate to the actual cost of borrowing? Are you also, like me, a giant nerd with too much time on your hands?
M2 Growth Rate vs Borrowing Rate
This Pine Script indicator analyzes the annualized growth rate of M2 money supply and compares it to key borrowing rates, providing insights into the relationship between money supply expansion and borrowing costs. Users can select between US M2 or a combined M2 (aggregating US, EU, China, Japan, and UK money supplies, adjusted for currency exchange rates). The M2 growth period is customizable, offering options from 1 month to 5 years for flexible analysis over different time horizons. The indicator fetches monthly data for US M2, EU M2, China M2, Japan M2, UK M2, and exchange rates (EURUSD, CNYUSD, JPYUSD, GBPUSD) to compute the combined M2 in USD terms.
It plots the annualized M2 growth rate alongside borrowing rates, including US 2-year and 10-year Treasury yields, corporate bond effective yield, high-yield bond effective yield, and 30-year US mortgage rates. Borrowing rates are color-coded for clarity: red if the rate exceeds the selected M2 growth rate, and green if below, highlighting relative dynamics. Displayed on a separate pane with a zero line for reference, the indicator includes labeled plots for easy identification.
This tool is designed for informational purposes, offering a visual framework to explore economic trends without providing trading signals or financial advice.
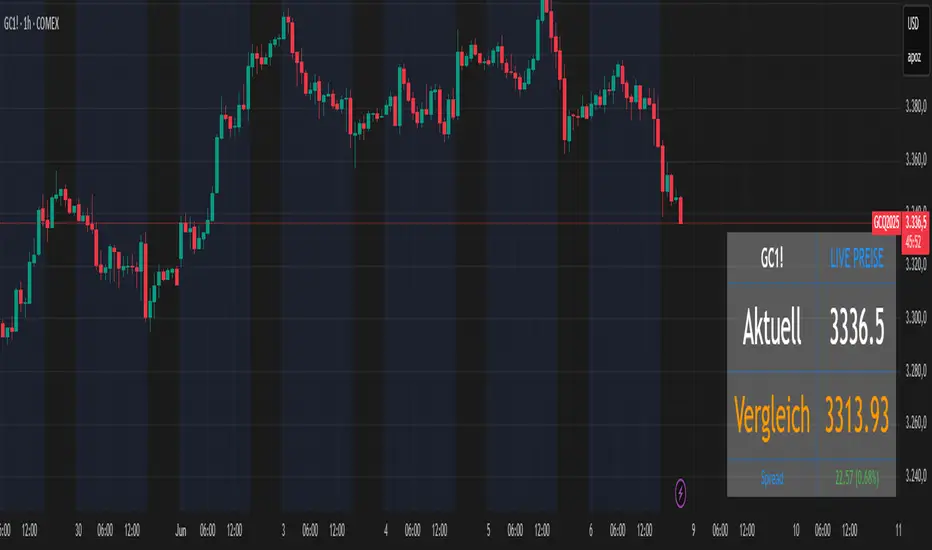
Futures vs CFD Price Display
🎯 Trading the same asset in CFDs and Futures but tired of switching charts to compare prices? This is your indicator!
Stop the constant chart hopping! This live price comparison shows you instantly where the better conditions are.
✨ What you get:
Bidirectional: Works in both Futures AND CFD charts
Live prices: Real-time comparison of both markets
Spread calculation: Automatic difference in points and percentage
Fully customizable: Colors, position, size to your liking
Professional design: Clean display with symbol header
🎯 Perfect for:
Gold traders (Futures vs CFD)
Arbitrage strategies
Spread monitoring
Multi-broker comparisons
⚙️ Customization:
3 sizes (Small/Normal/Large) for all screens
4 positions available
Individual color schemes
Toggle features on/off
💡 Simply enter the symbol and keep both markets in sight!
Notice: "Co-developed with Claude AI (Anthropic) - because even AI needs to pay the server bills! 😄"
Enhanced Stock Ticker with 50MA vs 200MADescription
The Enhanced Stock Ticker with 50MA vs 200MA is a versatile Pine Script indicator designed to visualize the relative position of a stock's price within its short-term and long-term price ranges, providing actionable bullish and bearish signals. By calculating normalized indices based on user-defined lookback periods (defaulting to 50 and 200 bars), this indicator helps traders identify potential reversals or trend continuations. It offers the flexibility to plot signals either on the main price chart or in a separate lower pane, leveraging Pine Script v6's force_overlay functionality for seamless integration. The indicator also includes a customizable ticker table, visual fills, and alert conditions for automated trading setups.
Key Features
Dual Lookback Indices: Computes short-term (default: 50 bars) and long-term (default: 200 bars) indices, normalizing the closing price relative to the high/low range over the specified periods.
Flexible Signal Plotting: Users can toggle between plotting crossover signals (triangles) on the main price chart (location.abovebar/belowbar) or in the lower pane (location.top/bottom) using the Plot Signals on Main Chart option.
Crossover Signals: Generates bullish (Golden Cross) and bearish (Death Cross) signals when the short or long index crosses above 5 or below 95, respectively.
Visual Enhancements:
Plots short-term (blue) and long-term (white) indices in a separate pane with customizable lookback periods.
Includes horizontal reference lines at 0, 20, 50, 80, and 100, with green and red fills to highlight overbought/oversold zones.
Dynamic fill between indices (green when short > long, red when long > short) for quick trend visualization.
Displays a ticker and legend table in the top-right corner, showing the symbol and lookback periods.
Alert Conditions: Supports alerts for bullish and bearish crossovers on both short and long indices, enabling integration with TradingView's alert system.
Technical Innovation: Utilizes Pine Script v6's force_overlay parameter to plot signals on the main chart from a non-overlay indicator, combining the benefits of a separate pane and chart-based signals in a single script.
Technical Details
Calculation Logic:
Uses confirmed bars (barstate.isconfirmed) to calculate indices, ensuring reliability by avoiding real-time bar fluctuations.
Short-term index: (close - lowest(low, lookback_short)) / (highest(high, lookback_short) - lowest(low, lookback_short)) * 100
Long-term index: (close - lowest(low, lookback_long)) / (highest(high, lookback_long) - lowest(low, lookback_long)) * 100
Signals are triggered using ta.crossover() and ta.crossunder() for indices crossing 5 (bullish) and 95 (bearish).
Signal Plotting:
Main chart signals use force_overlay=true with location.abovebar/belowbar for precise alignment with price bars.
Lower pane signals use location.top/bottom for visibility within the indicator pane.
Plotting is controlled by boolean conditions (e.g., bullishLong and plot_on_chart) to ensure compliance with Pine Script's global scope requirements.
Performance Considerations: Optimized for efficiency by calculating indices only on confirmed bars and using lightweight plotting functions.
How to Use
Add to Chart:
Copy the script into TradingView's Pine Editor and add it to your chart.
Configure Settings:
Short Lookback Period: Adjust the short-term lookback (default: 50 bars) to match your trading style (e.g., 20 for shorter-term analysis).
Long Lookback Period: Adjust the long-term lookback (default: 200 bars) for broader market context.
Plot Signals on Main Chart: Check this box to display signals on the price chart; uncheck to show signals in the lower pane.
Interpret Signals:
Golden Cross (Bullish): Green (long) or blue (short) triangles indicate the index crossing above 5, suggesting a potential buying opportunity.
Death Cross (Bearish): Red (long) or white (short) triangles indicate the index crossing below 95, signaling a potential selling opportunity.
Set Alerts:
Use TradingView's alert system to create notifications for the four alert conditions: Long Index Valley, Long Index Peak, Short Index Valley, and Short Index Peak.
Customize Visuals:
The ticker table displays the symbol and lookback periods in the top-right corner.
Adjust colors and styles via TradingView's settings if desired.
Example Use Cases
Swing Trading: Use the short-term index (e.g., 50 bars) to identify short-term reversals within a broader trend defined by the long-term index.
Trend Confirmation: Monitor the fill between indices to confirm whether the short-term trend aligns with the long-term trend.
Automated Trading: Leverage alert conditions to integrate with bots or manual trading strategies.
Notes
Testing: Always backtest the indicator on your chosen market and timeframe to validate its effectiveness.
Optional Histogram: The script includes a commented-out histogram for the index difference (index_short - index_long). Uncomment the plot(index_diff, ...) line to enable it.
Compatibility: Built for Pine Script v6 and tested on TradingView as of May 27, 2025.
Acknowledgments
This indicator was inspired by the need for a flexible tool that combines lower-pane analysis with main chart signals, made possible by Pine Script's force_overlay feature. Share your feedback or suggestions in the comments below, and happy trading!

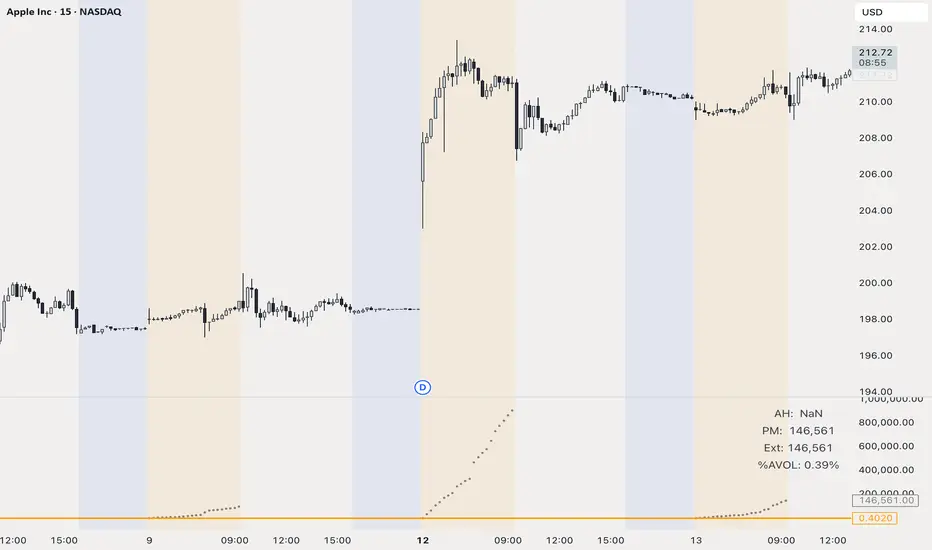
Extended-hours Volume vs AVOL// ──────────────────────────────────────────────────────────────────────────────
// Extended-Hours Volume vs AVOL • HOW IT WORKS & HOW TO TRADE IT
// ──────────────────────────────────────────────────────────────────────────────
//
// ░ What this indicator is
// ------------------------
// • It accumulates PRE-MARKET (04:00-09:30 ET) and AFTER-HOURS (16:00-20:00 ET)
// volume on intraday charts and compares that running total with the stock’s
// 21-day average daily volume (“AVOL” by default).
// • Three live read-outs are shown in the data-window/table:
//
// AH – volume traded since the 16:00 ET close
// PM – volume traded before the 09:30 ET open
// Ext – AH + PM (updates in pre-market only)
// %AVOL – Ext ÷ AVOL × 100 (updates in pre-market)
//
// • It is intended for U.S. equities but the session strings can be edited for
// other markets.
//
// ░ Why it matters
// ----------------
// Big extended-hours volume almost always precedes outsized intraday range.
// By quantifying that volume as a % of “normal” trade (AVOL), you can filter
// which gappers and news names deserve focus *before* the bell rings.
//
// ░ Quick-start trade plan (educational template – tune to taste)
// ----------------------------------------------------------------
// 1. **Scan** the watch-list between 08:30-09:25 ET.
// ► Keep charts on 1- or 5-minute candles with “Extended Hours” ✔ checked.
// 2. **Filter** by `Ext` or `%AVOL`:
// – Skip if < 10 % → very low interest
// – Flag if 20-50 % → strong interest, Tier-1 candidate
// – Laser-focus if > 50 % → crowd favourite; expect liquidity & range
// 3. **Opening Range Breakout (long example)**
// • Preconditions: Ext ≥ 20 % & price above yesterday’s close.
// • Let the first 1- or 5-min bar complete after 09:30.
// • Stop-buy 1 tick above that bar (or pre-market high – whichever higher).
// • Initial stop below that bar low (or pre-market low).
// • First target = 1R or next HTF resistance.
// 4. **Red-to-Green reversal (gap-down long)**
// • Ext ≥ 30 % but pre-market gap is negative.
// • Enter as price reclaims yesterday’s close on live volume.
// • Stop under reclaim bar; scale out into VWAP / first liquidity pocket.
// 5. **Risk** – size so the full stop is ≤ 1 R of account. Volume fade or
// loss of %AVOL slope is a reason to tighten or exit early.
//
// ░ Tips
// ------
// • AVOL look-back can be changed in the input panel (21 days ⇒ ~1 month).
// • To monitor several symbols, open a multi-chart layout and sort your
// watch-list by %AVOL descending – leaders float to the top automatically.
// • Replace colour constants with hex if the namespace ever gets shadowed.
//
// ░ Disclaimer
// ------------
// For educational purposes only. Not financial advice. Trade your own plan.
//
// ──────────────────────────────────────────────────────────────────────────────
Bull vs Bear Volume (Enhanced)Bull vs Bear Volume (Enhanced) is a custom volume histogram that separates and visualizes estimated buying vs. selling volume within each candle. This allows traders to better understand market sentiment and detect imbalances in demand and supply.
🔍 What It Does:
Plots bullish volume (green) above the x-axis and bearish volume (red) below.
Estimates bull/bear volume by analyzing the close location within the candle's range.
Highlights volume spikes with lime (bullish) or maroon (bearish) when volume exceeds a user-defined threshold.
Includes an optional total volume line for added context.
Supports smoothing via simple moving average (SMA) to reduce noise.
🛠️ Inputs:
Toggle smoothing and set its length.
Enable/disable threshold spike highlighting.
Show/hide the total volume overlay.
Adjust the threshold multiplier for spike detection.
⚠️ Important:
This script uses a proxy method based on candle structure to estimate volume split — it does not use real-time order flow or trade direction data.
Works best on liquid assets with consistent volume.

Credit Spread Monitor: HY & IG vs US10Y📉 Credit Spread Monitor: HY & IG vs US10Y
This indicator provides a dynamic and visual way to monitor credit spreads relative to the US Treasury benchmark. By comparing High Yield (HY) and Investment Grade (IG) corporate bond yields to the 10-Year US Treasury Yield (US10Y), it helps assess market stress, investor risk appetite, and potential macro turning points.
🔍 What It Does
-Calculates credit spreads:
HY Spread = BAMLH0A0HYM2EY − US10Y
IG Spread = BAMLC0A0CMEY − US10Y
-Detects macro risk regimes using statistical thresholds and yield curve signals:
🔴 HY Spread > +2σ → Potential financial stress
🟠 Inverted Yield Curve + HY Spread > 2% → Recession risk
🟢 HY Spread < 1.5% → Risk-on environment
-Visually highlights conditions with intuitive background colors for fast decision-making.
📊 Data Sources Explained
🔴 High Yield (HY): BAMLH0A0HYM2EY → ICE BofA US High Yield Index Effective Yield
🔵 Investment Grade (IG): BAMLC0A0CMEY → ICE BofA US Corporate Index Effective Yield
⚪ Treasury 10Y: US10Y → 10-Year US Treasury Yield
⚪ Treasury 2Y: US02Y → 2-Year US Treasury Yield (used to detect curve inversion)
✅ This Indicator Is Ideal For:
Macro traders looking to anticipate economic inflection points
Portfolio managers monitoring systemic risk or credit cycles
Fixed-income analysts tracking the cost of corporate borrowing
ETF/Asset allocators identifying shifts between risk-on and risk-off environments
🧠 Why It's Useful
This script helps visualize how tight or loose credit conditions are relative to government benchmarks. Since HY spreads typically widen before major downturns, this tool can provide early warning signals. Similarly, compressed spreads may indicate overheating or complacency in risk markets.
🛠️ Practical Use Case:
You’re managing a multi-asset portfolio. The HY spread jumps above +2σ while the yield curve remains inverted. You decide to reduce exposure to equities and high-yield bonds and rotate into cash or Treasuries as recession risk rises.
📎 Additional Notes
Sourced from FRED (Federal Reserve Economic Data) and TradingView’s bond feeds.
Designed to work best on daily resolution, using open prices to ensure consistency across series with different update timings.
This script is original, not based on built-in or public templates, and intended to offer educational, statistical, and visual insights for serious market participants.

BTC vs ALT Lag Detector [MEXC Overlay]This indicator monitors the price movement of Bitcoin (BTC) and compares it in real time to a customizable list of major altcoins on the MEXC exchange.
It helps you identify lagging altcoins — tokens that are underperforming or overperforming BTC’s price action over a selected timeframe. These temporary deviations can offer profitable entry or rotation opportunities, especially for scalpers, day traders, and arbitrage-style strategies.
Key Features:
- Real-time deviation detection between BTC and altcoins
- Customizable comparison timeframe: 1m, 6m, 12m, 30m, 1h, 4h, or 1d
- Deviation threshold alert: Highlights coins that lag BTC by more than 0.5%, 1%, 2%, or 3%
- Compact stats table embedded in the price chart
- Fully adjustable layout: Table position (Top/Bottom/Center + Left/Right), Font size (Tiny, Small, Medium)
- Built-in alert system when deviation exceeds your chosen threshold
How to Use It:
Set your desired timeframe for comparison (e.g., 1 hour).
Select a deviation threshold (e.g., 1.0%).
The table will show:
Each altcoin’s % change
BTC’s % change
The delta (deviation) vs BTC
Red highlights indicate alts whose deviation exceeded the threshold.
When at least one alt lags beyond your threshold, the indicator can trigger an alert — helping you capitalize on potential catch-up trades.
Please provide any feedback on it.

Stock vs SPY % ChangeStock vs SPY % Change Indicator
This Pine Script indicator helps you compare a stock's price performance to the S&P 500 (using SPY ETF) over a user-defined period. It calculates the percentage price change of the stock and SPY, then displays the difference as a relative performance metric. A positive value (plotted in green) indicates the stock is outperforming SPY (e.g., dropping only 3% while SPY drops 10%), while a negative value (plotted in red) shows underperformance.
Features:
Adjustable lookback period (default: 20 days) to analyze recent performance.
Visual plot with green/red coloring for quick interpretation.
Zero line to clearly separate outperformance from underperformance.
How to Use:
Apply the indicator to your stock's chart.
Set the "Lookback Period" in the settings (e.g., 20 for ~1 month).
Check the plot:
Green (above 0) = Stock's % change is better than SPY's.
Red (below 0) = Stock's % change is worse than SPY's.
Use on daily or weekly charts for best results.
Ideal for identifying stocks that hold up better during market downturns or outperform in uptrends. Perfect for relative strength analysis and to spot accumulation.
