Ehlers Simple Cycle Indicator [LazyBear]One of the early cycle indicators from John Ehlers.
Ehlers suggests using this with ITrend (see linked PDF below). Osc/signal crosses identify entry/exit points.
Options page has the usual set of configurable params.
More info:
- Simple Cycle Indicator: www.mesasoftware.com
List of my public indicators: bit.ly
List of my app-store indicators: blog.tradingview.com
在腳本中搜尋"长江电子+半导体行业研究框架培训+pdf"

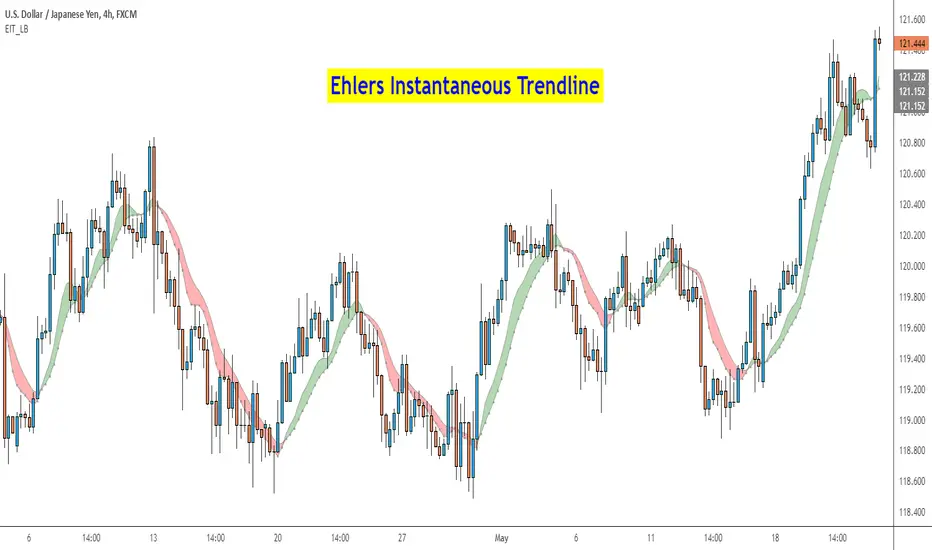
Ehlers Instantaneous Trend [LazyBear]One more to add to the Ehlers collection.
Ehlers Instantaneous Trendline, by John Ehlers, identifies the market trend by doing removing cycle component. I think, this simplicity is what makes it attractive :) To understand Ehlers's thought process behind this, refer to the PDF linked below.
There are atleast 6 variations of this ITrend. This version is from his early presentations.
Is this better than a simple HMA? May be, May be not. I will leave it to you to decide :)
I have added options to show this as a ribbon, and to color bars based on ITrend. Check out the options page.
More info:
- ITrend: www.mesasoftware.com
List of my public indicators: bit.ly
List of my app-store indicators: blog.tradingview.com
Ehlers Center of Gravity Oscillator [LazyBear]As part of my "Ehler's Indicators week", here's one more.
CG Oscillator, by John Ehlers, provides a smoothed, essentially zero lag oscillator for identifying market turning points. The "CG" in the name of the oscillator refers to "Center Of Gravity" of the prices over the window of observation.
Entry/Exit are based on the osc/signal crossovers. Enabling the "Color bars" options helps in easily identifying crossovers.
More info:
- CG osc (pdf): www.mesasoftware.com
- TASC Article: traders.com
- Cybernetic Analysis for Stocks and Futures (Ehlers, 2004)
List of my public indicators: bit.ly
List of my app-store indicators: blog.tradingview.com

CM_NarrowRange_WideRange_Bars_V1Ever heard of NR2, NR3, NR4, NR7 Strategies?
Version 1 of Narrow Range And Wide Range Bars
Link To Rare Book On Technical Price Patterns!!!
More To Come Once I Go Thru Book.
***While I haven’t read the book yet…Skimming Thru it Shows Great Examples of The Statistics Any Technical Trader Should Know Regarding Their Trading Methodology!!!
Link To PDF - Day Trading With Short Term Price Patterns And Opening Range Breakout.
d.pr

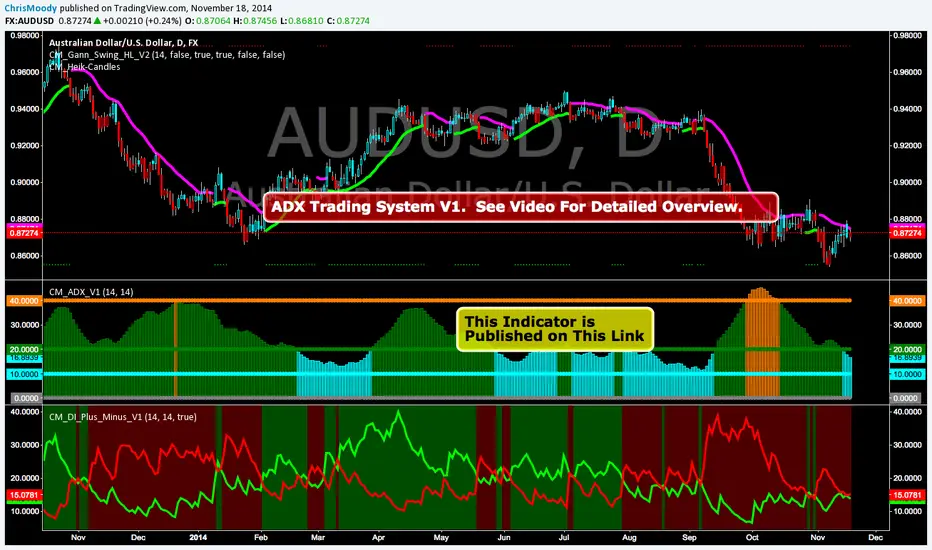
CM_ADX_V1ADX System Overview
So I Came Across Another Trading System for Only $997. However, if you purchased in the next 24hours the whole system could be Yours For Only $497.
So I decided to Code it. This is only Version 1, and I discuss in the Video What I’ve found so for, some plans for Version 2 of the indicator, and I ask for your feedback on anything you find.
Indicators used in System:
CM_DI_Plus_Minus_V1 (Indicator On Bottom).
CM_ADX_V1 (Indicator On 2nd Pane).
CM_Gann_Swing_Hi_Lo (Indicator on Price Pane). This Indicator was published before…Link Below.
CM_DI_Plus_Minus_V1
In Video I go over settings and how to customize charts.
Link To Video:
vimeopro.com
Link To Downloadable PDF Shown in Video:
d.pr
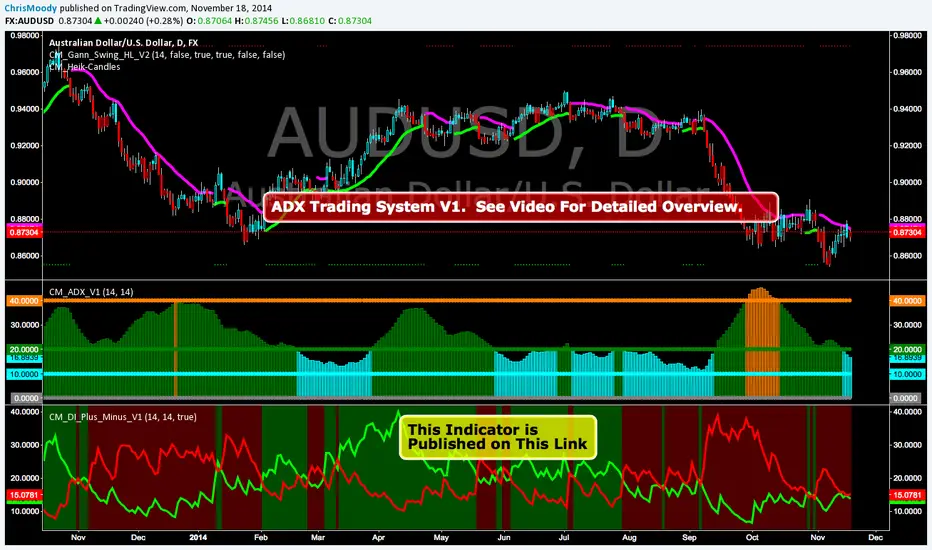
CM_DI_Plus_MinusADX System Overview
So I Came Across Another Trading System for Only $997. However, if you purchased in the next 24hours the whole system could be Yours For Only $497.
So I decided to Code it. This is only Version 1, and I discuss in the Video What I’ve found so for, some plans for Version 2 of the indicator, and I ask for your feedback on anything you find.
Indicators used in System:
CM_DI_Plus_Minus_V1 (Indicator On Bottom).
CM_ADX_V1 (Indicator On 2nd Pane).
CM_Gann_Swing_Hi_Lo (Indicator on Price Pane). This Indicator was published before…Link Below.
In Video I go over settings and how to customize charts.
Link To Video:
vimeopro.com
Link To Downloadable PDF Shown in Video:
d.pr
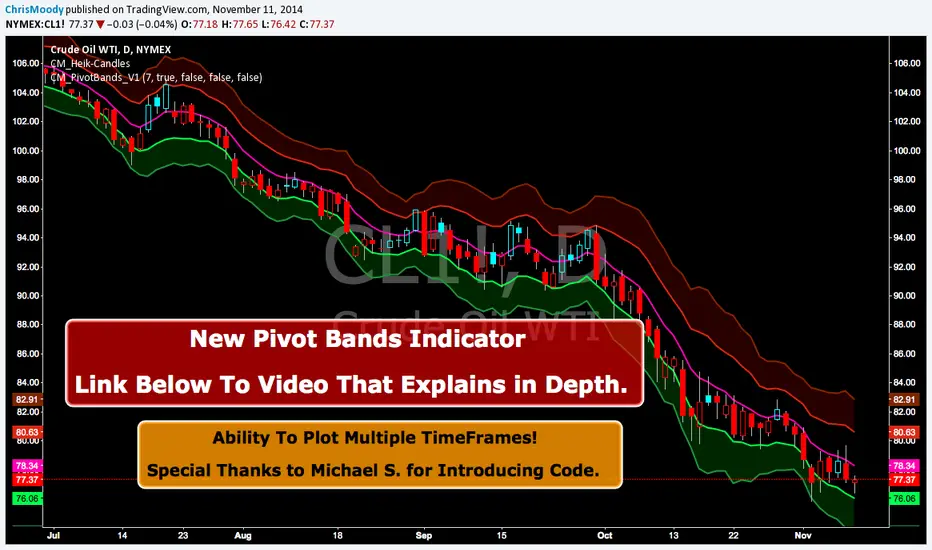
CM Pivot Bands V1CM_Pivot Bands V1
Special Thanks to Michael S for Introducing Code.
Instead of a Long Write Up I Recorded A Video Going Into Detail On V1 Of This Indicator. Please View To See My Initial Findings, My Thoughts For V2, And Items I Need YOUR Help With!!!
In Inputs Tab Indicator Has Ability to Turn On/Off Multiple TimeFrames…Thought Process Explained In Video.
Link To Video:
vimeopro.com
Link To PDF Mentioned In Video:
d.pr
MACD Leader [LazyBear]Smoothing methods have lag, and since MACD makes use of moving averages, it usually lags behind price. You cannot eliminate lag completely, but one way of working around this is by adding a component of the price/MA difference back to MA. This technique is called Zero-lag (well, almost). "MACD Leader" makes use of this to form a leading signal to MACD.
First proposed by Giorgos E. Siligardos, "Leader" leads normal MACD, especially when significant trend changes are about to take place. This has the following features:
- It is similar to MACD in smoothness.
- It can be plotted along with MACD in the same window using the same scaling.
- It has the ability to lead MACD at critical situations
For detailed discussion on the various divergence patterns, refer to the PDF I have linked in the "More Info" below.
I have provided an option to plot MACD and MACD signal on the same pane. You can enable/disable them via options page.
For Pinescript coders: Try enabling histo on this to compare with normal MACD histo :)
More info:
drive.google.com
List of my other indicators:
- Chart:
- GDoc: docs.google.com

Elastic Volume Weighted Moving Average & Envelope [LazyBear]Elastic Volume Weighted Moving Average (eVWMA) is a statistical measure using the volume to define the period of the moving average. The eVWMA can be looked at as an approximation to the average price paid per share. Multiplier is usually the number of shares, but it can be approximated using cumulative sum of volume (Enable it via "Use Cumulative Volume" option) or sum of volume over "n" periods.
I have also added an option to draw eVWMA envelope (eVWMA on HLC).
More info:
christian-fries.de
List of all my indicators:
- Chart:
- GDoc: docs.google.com

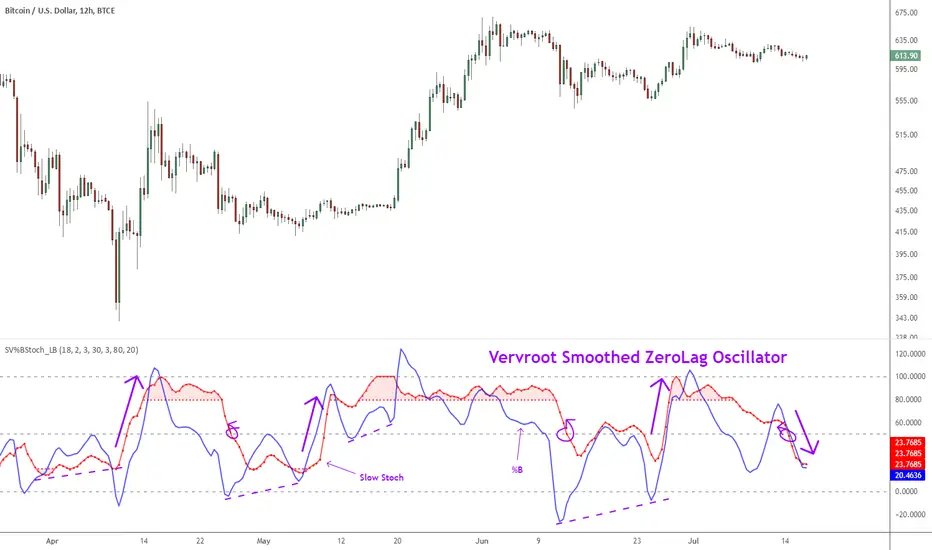
Indicator: Vervoort Smoothed Oscillator [LazyBear]This is Mr. Sylvian Vervoort's take on improving some well-known indicators (%B and Stoch) using smoothing techniques. A combination of TEMA and WMA does a nice job smoothing out %B, derived from zero-lag “Rainbow” data series. The same Rainbow series, averaged with the typical price, smooth the Stochastic K oscillator to produce slowStoch.
Vervroot's strategy for this oscillator (detailed explanation in the reference material below):
- It must be bullish for a buy signal and bearish for a sell signal. This means that both the oscillators must be moving up or down.
- Use the oscillators for detecting divergences. Divergence even in one is still valid.
- Stoch crossing 50 is a good confirmation signal. Momentum usually is an excellent leading indicator, so keep an eye on Stoch.
More info:
www.traders.com
www.scribd.com
Complete list of my indicators (Check the comments, I keep the list updated there):
Fisher Transform Indicator by Ehlers - Strategy Market prices do not have a Gaussian probability density function
as many traders think. Their probability curve is not bell-shaped.
But trader can create a nearly Gaussian PDF for prices by normalizing
them or creating a normalized indicator such as the relative strength
index and applying the Fisher transform. Such a transformed output
creates the peak swings as relatively rare events.
Fisher transform formula is: y = 0.5 * ln ((1+x)/(1-x))
The sharp turning points of these peak swings clearly and unambiguously
identify price reversals in a timely manner.

Fisher Transform Indicator by Ehlers Market prices do not have a Gaussian probability density function
as many traders think. Their probability curve is not bell-shaped.
But trader can create a nearly Gaussian PDF for prices by normalizing
them or creating a normalized indicator such as the relative strength
index and applying the Fisher transform. Such a transformed output
creates the peak swings as relatively rare events.
Fisher transform formula is: y = 0.5 * ln ((1+x)/(1-x))
The sharp turning points of these peak swings clearly and unambiguously
identify price reversals in a timely manner.

Indicator: Elder Impulse SystemAccording to Elder, "The Impulse System encourages you to enter a trade cautiously but exit fast, by identifying inflection points where a trend speeds up or slows down. This is the professional approach to trading, the total opposite of the amateur's style. Beginners jump into trades without thinking too much and take forever to get out, hoping and waiting for the market to turn their way."
The Impulse System is based on two indicators, a 13-day exponential moving average and the MACD-Histogram. The moving average identifies the trend, while the MACD-Histogram measures momentum. As a result, the Impulse System combines trend following and momentum to identify impulses that can be traded.
By default it uses your chart's time frame, but you can set it to any custom time frame via options page. Optionally, price bars can be color coded too.
More info:
stockcharts.com
Steps to import / use custom indicators from this chart:
PDF: drive.google.com

Indicators: Volume-Weighted MACD Histogram & Sentiment Zone OscVolume-Weighted MACD Histogram
-------------------------------------------------------------------------------------
Volume-Weighted MACD Histogram, first discussed by Buff Dormeier, is a modified version of MACD study. It calculates volume-averaged Close price for finding the histogram.
More info:
www.moneyshow.com
Sentiment Zone Oscillator
-------------------------------------------------------------------------------------
Sentiment Zone Oscillator, developed by Walid Khalil, is a complementing oscillator to VZO and PZO.
To quote Walid:
>> The sentiment zone oscillator (SZO) is a leading contrary oscillator that measures the extreme emotions of a single market or share.
>> It measures and defines both extremes, bullishness (overoptimism) and bearishness (overpessimism), that could lead to a change
>> in sentiment, eventually changing the trend of the time frame under study. The SZO was devised on the belief that after several waves
>> of rising prices, investors begin to get bullish on the stock with increasing confidence since the price has been rising for some time.
>> The SZO measures that bullishness/bearishness and marks overbought/oversold levels.
SZO has its own oversold/overbought bands. Also, when SZO goes above 7, it indicates extreme optimism. When the SZO goes below -7, it indicates extreme pessimism.
More info: www.traders.com
How to import / use custom indicators from this chart?
-------------------------------------------------------------------------------------
PDF: drive.google.com
