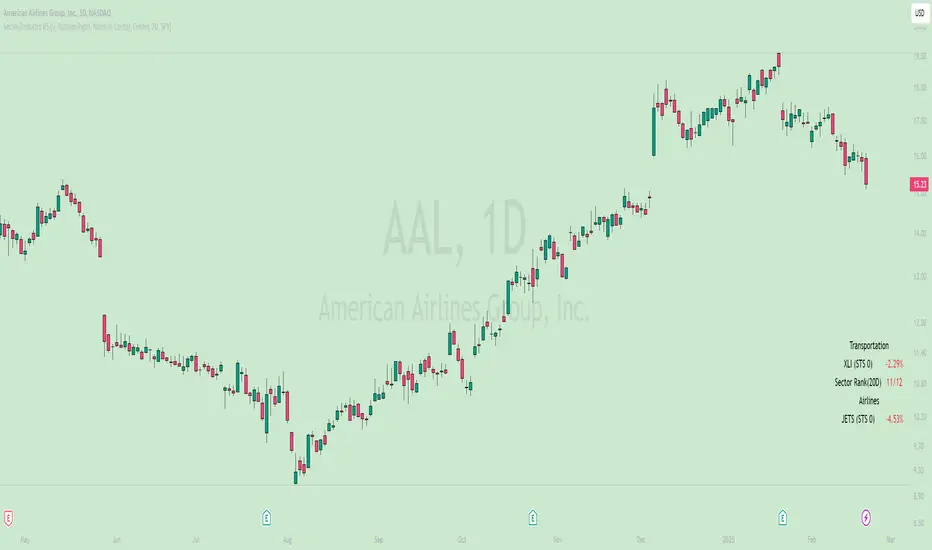
Sector/Industry Relative StrengthOverview
The Sector/Industry Relative Strength (RS) Indicator is a powerful tool designed to help traders and investors analyze the performance of sectors and industries relative to the broader market (SPY). It provides real-time insights into sector and industry strength, helping you identify leading and lagging areas of the market.
Key Features
Sector and Industry Analysis:
Automatically detects the sector and industry of the current symbol.
Displays the corresponding sector and industry ETF.
Relative Strength (STS) Calculation:
Calculates the Sector/Industry Trend Strength (STS) by comparing the sector or industry ETF to SPY over the past 20 days.
STS is expressed as a percentile (0-100), indicating how strong the sector/industry ETF has been relative to SPY over the past 20 days.
Example: An STS of 70 means that during the past 20 days, the ETF’s relative strength against SPY was stronger than 70% of those days.
Sector Rank:
Ranks the current sector ETF against a predefined list of major sector ETFs.
Highlights whether the sector is outperforming or underperforming SPY (green if outperforming, red if underperforming).
Customizable Display:
Choose which elements to display (e.g., sector, industry, ETFs, STS, sector rank).
Customize table position, size, text alignment, and colors.
Real-Time Performance:
Tracks daily price changes for sector and industry ETFs.
Displays percentage change from open to close.
How to Use
Add the Indicator:
Apply the indicator to any stock or ETF chart.
The script will automatically detect the sector and industry of the selected symbol.
Interpret the Data:
Sector/Industry: Displays the current sector and industry.
ETF: Shows the corresponding sector and industry ETF.
STS (Sector/Industry Trend Strength): A percentile score (0-100) indicating the relative strength of the sector/industry ETF compared to SPY over the past 20 days.
Sector Rank: Ranks the sector ETF against other major sectors (e.g., "3/12" means the sector is ranked 3rd out of 12).
Customize the Display:
Use the input settings to:
Show/hide specific elements (e.g., sector, industry, ETFs, STS, sector rank).
Adjust the table position, size, and text alignment.
Change colors for positive/negative changes.
Make Informed Decisions:
Use the STS score and sector rank to identify potential trading opportunities.
Focus on sectors and industries with high STS scores and strong rankings (green).
Input Parameters
Table Settings:
Table Position: Choose where to display the table (Top Left, Top Right, Bottom Left, Bottom Right).
Table Size: Adjust the size of the table (Tiny, Small, Normal, Large).
Text Color: Customize the text color.
Background Color: Set the table background color.
Display Options:
Show ETFs: Toggle the display of sector and industry ETFs.
Show STS: Toggle the display of the Sector/Industry Trend Strength (STS) score.
Show Sector/Industry: Toggle the display of sector and industry information.
Show Sector Rank: Toggle the display of the sector rank.
Parameters:
Sector Rank Time Length: Set the number of days used for calculating the sector rank (default: 20).
Example Use Cases
Sector Rotation:
Identify sectors with high STS scores and strong rankings (green) to allocate capital.
Avoid sectors with low STS scores and weak rankings (red).
Industry Analysis:
Compare the STS scores of different industries within the same sector.
Use the STS score to gauge relative strength and identify potential opportunities.
Market Timing:
Use the STS score and sector rank to time entries and exits in sector-specific ETFs.
Combine with other technical indicators for confirmation.
在腳本中搜尋"非ST、非创业板、非科创板主板股票的筹码分布数据"
Rolling Window Geometric Brownian Motion Projections📊 Rolling GBM Projections + EV & Adjustable Confidence Bands
Overview
The Rolling GBM Projections + EV & Adjustable Confidence Bands indicator provides traders with a robust, dynamic tool to model and project future price movements using Geometric Brownian Motion (GBM). By combining GBM-based simulations, expected value (EV) calculations, and customizable confidence bands, this indicator offers valuable insights for decision-making and risk management.
Key Features
Rolling GBM Projections: Simulate potential future price paths based on drift (μμ) and volatility (σσ).
Expected Value (EV) Line: Represents the average projection of simulated price paths.
Confidence Bands: Define ranges where the price is expected to remain, adjustable from 51% to 99%.
Simulation Lines: Visualize individual GBM paths for detailed analysis.
EV of EV Line: A smoothed trend of the EV, offering additional clarity on price dynamics.
Customizable Lookback Periods: Adjust the rolling lookback periods for drift and volatility calculations.
Mathematical Foundation
1. Geometric Brownian Motion (GBM)
GBM is a mathematical model used to simulate the random movement of asset prices, described by the following stochastic differential equation:
dSt=μStdt+σStdWt
dSt=μStdt+σStdWt
Where:
StSt: Price at time tt
μμ: Drift term (expected return)
σσ: Volatility (standard deviation of returns)
dWtdWt: Wiener process (standard Brownian motion)
2. Drift (μμ) and Volatility (σσ)
Drift (μμ): Represents the average logarithmic return of the asset. Calculated using a simple moving average (SMA) over a rolling lookback period.
μ=SMA(ln(St/St−1),Lookback Drift)
μ=SMA(ln(St/St−1),Lookback Drift)
Volatility (σσ): Measures the standard deviation of logarithmic returns over a rolling lookback period.
σ=STD(ln(St/St−1),Lookback Volatility)
σ=STD(ln(St/St−1),Lookback Volatility)
3. Price Simulation Using GBM
The GBM formula for simulating future prices is:
St+Δt=St×e(μ−12σ2)Δt+σϵΔt
St+Δt=St×e(μ−21σ2)Δt+σϵΔt
Where:
ϵϵ: Random variable from a standard normal distribution (N(0,1)N(0,1)).
4. Confidence Bands
Confidence bands are determined using the Z-score corresponding to a user-defined confidence percentage (CC):
Upper Band=EV+Z⋅σ
Upper Band=EV+Z⋅σ
Lower Band=EV−Z⋅σ
Lower Band=EV−Z⋅σ
The Z-score is computed using an inverse normal distribution function, approximating the relationship between confidence and standard deviations.
Methodology
Rolling Drift and Volatility:
Drift and volatility are calculated using logarithmic returns over user-defined rolling lookback periods (default: μ=20μ=20, σ=16σ=16).
Drift defines the overall directional tendency, while volatility determines the randomness and variability of price movements.
Simulations:
Multiple GBM paths (default: 30) are generated for a specified number of projection candles (default: 12).
Each path is influenced by the current drift and volatility, incorporating random shocks to simulate real-world price dynamics.
Expected Value (EV):
The EV is calculated as the average of all simulated paths for each projection step, offering a statistical mean of potential price outcomes.
Confidence Bands:
The upper and lower bounds of the confidence bands are derived using the Z-score corresponding to the selected confidence percentage (e.g., 68%, 95%).
EV of EV:
A running average of the EV values, providing a smoothed perspective of price trends over the projection horizon.
Indicator Functionality
User Inputs:
Drift Lookback (Bars): Define the number of bars for rolling drift calculation (default: 20).
Volatility Lookback (Bars): Define the number of bars for rolling volatility calculation (default: 16).
Projection Candles (Bars): Set the number of bars to project future prices (default: 12).
Number of Simulations: Specify the number of GBM paths to simulate (default: 30).
Confidence Percentage: Input the desired confidence level for bands (default: 68%, adjustable from 51% to 99%).
Visualization Components:
Simulation Lines (Blue): Display individual GBM paths to visualize potential price scenarios.
Expected Value (EV) Line (Orange): Highlight the mean projection of all simulated paths.
Confidence Bands (Green & Red): Show the upper and lower confidence limits.
EV of EV Line (Orange Dashed): Provide a smoothed trendline of the EV values.
Current Price (White): Overlay the real-time price for context.
Display Toggles:
Enable or disable components (e.g., simulation lines, EV line, confidence bands) based on preference.
Practical Applications
Risk Management:
Utilize confidence bands to set stop-loss levels and manage trade risk effectively.
Use narrower confidence intervals (e.g., 50%) for aggressive strategies or wider intervals (e.g., 95%) for conservative approaches.
Trend Analysis:
Observe the EV and EV of EV lines to identify overarching trends and potential reversals.
Scenario Planning:
Analyze simulation lines to explore potential outcomes under varying market conditions.
Statistical Insights:
Leverage confidence bands to understand the statistical likelihood of price movements.
How to Use
Add the Indicator:
Copy the script into the TradingView Pine Editor, save it, and apply it to your chart.
Customize Settings:
Adjust the lookback periods for drift and volatility.
Define the number of projection candles and simulations.
Set the confidence percentage to tailor the bands to your strategy.
Interpret the Visualization:
Use the EV and confidence bands to guide trade entry, exit, and position sizing decisions.
Combine with other indicators for a holistic trading strategy.
Disclaimer
This indicator is a mathematical and statistical tool. It does not guarantee future performance.
Use it in conjunction with other forms of analysis and always trade responsibly.
Happy Trading! 🚀

TTP SuperTrend ADXThis indicator uses the strength of the trend from ADX to decide how the SuperTrend (ST) should behave.
Motivation
ST is a great trend following indicator but it's not capable of adapting to the trend strength.
The ADX, Average Directional Index measures the strength of the trend and can be use to dynamically tweak the ST factor so that it's sensitivity can adapt to the trend strength.
Implementation
The indicator calculates a normalised value of the ADX based on the data available in the chart.
Based on these values ST will use different factors to increase or reduce the factor use by ST: expansion or compression.
ST expansion vs compression
Expanding the ST would mean that the stronger a trends get the ST factor will grow causing it to distance further from the price delaying the next ST trend flip.
Compressing the ST would mean that the stronger a trends get the ST factor will shrink causing it to get closer to the price speeding up the next ST trend flip.
Features
- Alerts for trend flip
- Alerts for trend status
- Backtestable stream
- SuperTrend color gets more intense with the strength of the trend

Custom 4 Moving Averages with Styles & ThresholdsThis Pine Script indicator is designed to provide traders with a unique method of analyzing price action through four customizable moving averages, alongside buy and sell threshold detection. The script is fully original and adds value by allowing traders to configure and visualize multiple MAs with different smoothing options, and by detecting critical buy/sell moments based on the interaction between price and the moving averages.
What the Script Does:
Custom Moving Averages: The script plots four distinct moving averages (MA1, MA2, MA3, and MA4) on the chart. Each MA can be configured for length, offset, and optional smoothing to match different trading strategies. This flexibility allows traders to tailor the script for various timeframes, trend detection, and market conditions.
Buy (BT) and Sell (ST) Threshold Detection: The indicator identifies critical points for buying and selling:
Buy Threshold (BT): The script identifies potential buy points when the current candle's low is above the MA2 from the previous candle, suggesting potential upward momentum.
Sell Threshold (ST): It detects potential sell points when the current MA2 falls below the previous candle’s low, indicating possible downward momentum. These thresholds are clearly marked on the chart with green arrows for BT (Buy) and red arrows for ST (Sell).
Horizontal Threshold Lines: Horizontal lines are drawn when BT or ST conditions are met. These lines help traders visualize support and resistance levels, providing clarity in decision-making. The length of these lines is customizable, allowing users to control how long they remain visible on the chart.
Dynamic Cleanup of Old Lines: To keep the chart clean and reduce clutter, the script automatically removes old BT and ST lines after a set period, ensuring that traders can focus on the most relevant data.
Underlying Concepts:
Moving Averages: Moving averages are a fundamental tool in technical analysis for identifying trends. This script uses various moving averages (calculated from high, low, close, and HL2) and allows for smoothing to adjust the sensitivity to price movements. Traders can apply this flexibility to multiple trading styles, from scalping to swing trading.
Threshold Conditions: The buy and sell conditions in this script are based on simple but effective price action patterns, where the interaction between price and MA2 determines entry or exit points. This approach is useful in trend-following strategies, where traders aim to capitalize on momentum shifts.
How to Use the Script:
Configure Moving Averages: Start by adjusting the lengths, offsets, and smoothing options for each moving average. For short-term trading, shorter MA lengths might be more suitable, while longer MAs can help identify broader trends.
Observe Buy and Sell Signals: Look for green arrows (BT) as potential buy signals and red arrows (ST) as potential sell signals. These signals appear when certain conditions between price and MA2 are met, giving traders clear visual cues for entries and exits.
Support/Resistance Levels: Pay attention to the horizontal lines drawn when BT or ST conditions occur. These lines can act as support or resistance levels, helping you identify potential price targets or stop-loss points.
Why This Script is Useful:
This indicator combines the power of multiple moving averages with customizable features, making it versatile for different market conditions. By adding clear buy and sell signals based on a logical threshold system, the script helps traders make informed decisions with minimal guesswork. Unlike many basic indicators, this one provides flexibility and original insight into market dynamics, making it a valuable tool for both beginner and experienced traders.

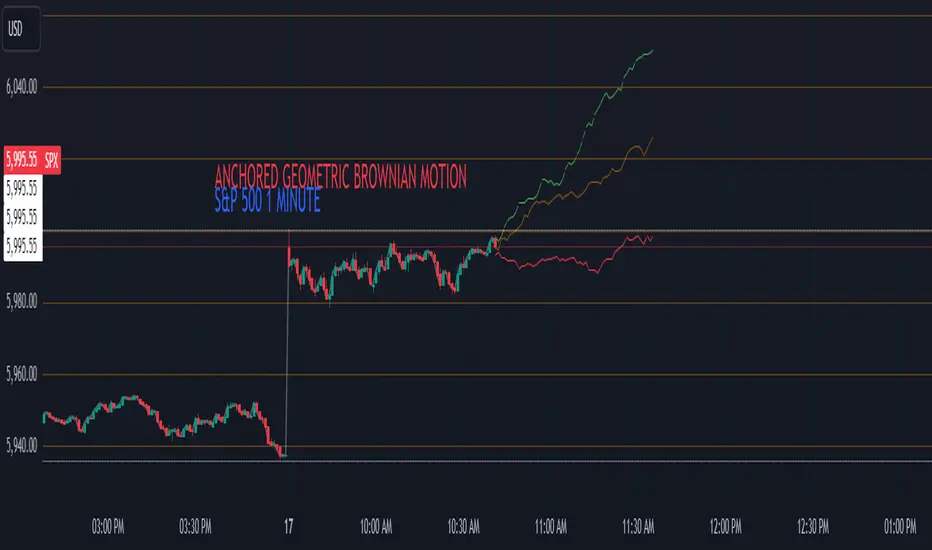
Anchored Geometric Brownian Motion Projections w/EVAnchored GBM (Geometric Brownian Motion) Projections + EV & Confidence Bands
Version: Pine Script v6
Overlay: Yes
Author:
Published On:
Overview
The Anchored GBM Projections + EV & Confidence Bands indicator leverages the Geometric Brownian Motion (GBM) model to project future price movements based on historical data. By simulating multiple potential future price paths, it provides traders with insights into possible price trajectories, their expected values, and confidence intervals. Additionally, it offers a "Mean of EV" (EV of EV) line, representing the running average of expected values across the projection period.
Key Features
Anchor Time Setup:
Define a specific point in time from which the projections commence.
By default, it uses the current bar's timestamp but can be customized.
Projection Parameters:
Projection Candles (Bars): Determines the number of future bars (time periods) to project.
Number of Simulations: Specifies how many GBM paths to simulate, ensuring statistical relevance via the Central Limit Theorem (CLT).
Display Toggles:
Simulation Lines: Visual representation of individual GBM simulation paths.
Expected Value (EV) Line: The average price across all simulations at each projection bar.
Upper & Lower Confidence Bands: 95% confidence intervals indicating potential price boundaries.
EV of EV Line: Running average of EV values, providing a smoothed central tendency across the projection period. Additionally, this line often acts as an indicator of trend direction.
Visualization:
Clear and distinguishable lines with customizable colors and styles.
Overlayed on the price chart for direct comparison with actual price movements.
Mathematical Foundation
Geometric Brownian Motion (GBM):
Definition: GBM is a continuous-time stochastic process used to model stock prices. It assumes that the logarithm of the stock price follows a Brownian motion with drift.
Equation:
S(t)=S0⋅e(μ−12σ2)t+σW(t)
S(t)=S0⋅e(μ−21σ2)t+σW(t) Where:
S(t)S(t) = Stock price at time tt
S0S0 = Initial stock price
μμ = Drift coefficient (average return)
σσ = Volatility coefficient (standard deviation of returns)
W(t)W(t) = Wiener process (standard Brownian motion)
Drift (μμ) and Volatility (σσ):
Drift (μμ) represents the expected return of the stock.
Volatility (σσ) measures the stock's price fluctuation intensity.
Central Limit Theorem (CLT):
Principle: With a sufficiently large number of independent simulations, the distribution of the sample mean (EV) approaches a normal distribution, regardless of the underlying distribution.
Application: Ensures that the EV and confidence bands are statistically reliable.
Expected Value (EV) and Confidence Bands:
EV: The mean price across all simulations at each projection bar.
Confidence Bands: Range within which the actual price is expected to lie with a specified probability (e.g., 95%).
EV of EV (Mean of Sample Means):
Definition: Represents the running average of EV values across the projection period, offering a smoothed central tendency.
Methodology
Anchor Time Setup:
The indicator starts projecting from a user-defined Anchor Time. If not customized, it defaults to the current bar's timestamp.
Purpose: Allows users to analyze projections from a specific historical point or the latest market data.
Calculating Drift and Volatility:
Returns Calculation: Computes the logarithmic returns from the Anchor Time to the current bar.
returns=ln(StSt−1)
returns=ln(St−1St)
Drift (μμ): Calculated as the simple moving average (SMA) of returns over the period since the Anchor Time.
Volatility (σσ): Determined using the standard deviation (stdev) of returns over the same period.
Simulation Generation:
Number of Simulations: The user defines how many GBM paths to simulate (e.g., 30).
Projection Candles: Determines the number of future bars to project (e.g., 12).
Process:
For each simulation:
Start from the current close price.
For each projection bar:
Generate a random number zz from a standard normal distribution.
Calculate the next price using the GBM formula:
St+1=St⋅e(μ−12σ2)+σz
St+1=St⋅e(μ−21σ2)+σz
Store the projected price in an array.
Expected Value (EV) and Confidence Bands Calculation:
EV Path: At each projection bar, compute the mean of all simulated prices.
Variance and Standard Deviation: Calculate the variance and standard deviation of simulated prices to determine the confidence intervals.
Confidence Bands: Using the standard normal z-score (1.96 for 95% confidence), establish upper and lower bounds:
Upper Band=EV+z⋅σEV
Upper Band=EV+z⋅σEV
Lower Band=EV−z⋅σEV
Lower Band=EV−z⋅σEV
EV of EV (Running Average of EV Values):
Calculation: For each projection bar, compute the average of all EV values up to that bar.
EV of EV =1j+1∑k=0jEV
EV of EV =j+11k=0∑jEV
Visualization: Plotted as a dynamic line reflecting the evolving average EV across the projection period.
Visualization Elements
Simulation Lines:
Appearance: Semi-transparent blue lines representing individual GBM simulation paths.
Purpose: Illustrate a range of possible future price trajectories based on current drift and volatility.
Expected Value (EV) Line:
Appearance: Solid orange line.
Purpose: Shows the average projected price at each future bar across all simulations.
Confidence Bands:
Upper Band: Dashed green line indicating the upper 95% confidence boundary.
Lower Band: Dashed red line indicating the lower 95% confidence boundary.
Purpose: Highlight the range within which the price is statistically expected to remain with 95% confidence.
EV of EV Line:
Appearance: Dashed purple line.
Purpose: Displays the running average of EV values, providing a smoothed trend of the central tendency across the projection period. As the mean of sample means it approximates the population mean (i.e. the trend since the anchor point.)
Current Price:
Appearance: Semi-transparent white line.
Purpose: Serves as a reference point for comparing actual price movements against projected paths.
Usage Instructions
Configuring User Inputs:
Anchor Time:
Set to a specific timestamp to start projections from a historical point or leave it as default to use the current bar's time.
Projection Candles (Bars):
Define the number of future bars to project (e.g., 12). Adjust based on your trading timeframe and analysis needs.
Number of Simulations:
Specify the number of GBM paths to simulate (e.g., 30). Higher numbers yield more accurate EV and confidence bands but may impact performance.
Display Toggles:
Show Simulation Lines: Toggle to display or hide individual GBM simulation paths.
Show Expected Value Line: Toggle to display or hide the EV path.
Show Upper Confidence Band: Toggle to display or hide the upper confidence boundary.
Show Lower Confidence Band: Toggle to display or hide the lower confidence boundary.
Show EV of EV Line: Toggle to display or hide the running average of EV values.
Managing TradingView's Object Limits:
Understanding Limits:
TradingView imposes a limit on the number of graphical objects (e.g., lines) that can be rendered. High values for projection candles and simulations can quickly consume these limits. TradingView appears to only allow a total of 55 candles to be projected, so if you want to see two complete lines, you would have to set the projection length to 27: since 27 * 2 = 54 and 54 < 55.
Optimizing Performance:
Use Toggles: Enable only the necessary visual elements. For instance, disable simulation lines and confidence bands when focusing on the EV and EV of EV lines. You can also use the maximum projection length of 55 with the lower limit confidence band as the only line, visualizing a long horizon for your risk.
Adjust Parameters: Lower the number of projection candles or simulations to stay within object limits without compromising essential insights.
Interpreting the Indicator:
Simulation Lines (Blue):
Represent individual potential future price paths based on GBM. A wider spread indicates higher volatility.
Expected Value (EV) Line (Goldenrod):
Shows the mean projected price at each future bar, providing a central trend.
Confidence Bands (Green & Red):
Indicate the statistical range (95% confidence) within which the price is expected to remain.
EV of EV Line (Dotted Line - Goldenrod):
Reflects the running average of EV values, offering a smoothed perspective of expected price trends over the projection period.
Current Price (White):
Serves as a benchmark for assessing how actual prices compare to projected paths.
Practical Applications
Risk Management:
Confidence Bands: Help in identifying potential support and resistance levels based on statistical confidence intervals.
EV Path: Assists in setting realistic target prices and stop-loss levels aligned with projected expectations.
Trend Analysis:
EV of EV Line: Offers a smoothed trendline, aiding in identifying overarching market directions amidst price volatility. Indicative of the population mean/overall trend of the data since your anchor point.
Scenario Planning:
Simulation Lines: Enable traders to visualize multiple potential outcomes, fostering better decision-making under uncertainty.
Performance Evaluation:
Comparing Actual vs. Projected Prices: Assess how actual price movements align with projected scenarios, refining trading strategies over time.
Mathematical and Statistical Insights
Simulation Integrity:
Independence: Each simulation path is generated independently, ensuring unbiased and diverse projections.
Randomness: Utilizes a Gaussian random number generator to introduce variability in diffusion terms, mimicking real market randomness.
Statistical Reliability:
Central Limit Theorem (CLT): By simulating a sufficient number of paths (e.g., 30), the sample mean (EV) converges to the population mean, ensuring reliable EV and confidence band calculations.
Variance Calculation: Accurate computation of variance from simulation data ensures precise confidence intervals.
Dynamic Projections:
Running Average (EV of EV): Provides a cumulative perspective, allowing traders to observe how the average expectation evolves as the projection progresses.
Customization and Enhancements
Adjustable Parameters:
Tailor the projection length and simulation count to match your trading style and analysis depth.
Visual Customization:
Modify line colors, styles, and transparency to enhance clarity and fit chart aesthetics.
Extended Statistical Metrics:
Future iterations can incorporate additional metrics like median projections, skewness, or alternative confidence intervals.
Dynamic Recalculation:
Implement logic to automatically update projections as new data becomes available, ensuring real-time relevance.
Performance Considerations
Object Count Management:
High simulation counts and extended projection periods can lead to a significant number of graphical objects, potentially slowing down chart performance.
Solution: Utilize display toggles effectively and optimize projection parameters to balance detail with performance.
Computational Efficiency:
The script employs efficient array handling and conditional plotting to minimize unnecessary computations and object creation.
Conclusion
The Anchored GBM Projections + EV & Confidence Bands indicator is a robust tool for traders seeking to forecast potential future price movements using statistical models. By integrating Geometric Brownian Motion simulations with expected value calculations and confidence intervals, it offers a comprehensive view of possible market scenarios. The addition of the "EV of EV" line further enhances analytical depth by providing a running average of expected values, aiding in trend identification and strategic decision-making.
Hope it helps!
HTFBands█ OVERVIEW
Contains type and methods for drawing higher-timeframe bands of several types:
Bollinger bands
Parabolic SAR
Supertrend
VWAP
By copy pasting ready made code sections to your script you can add as many multi-timeframe bands as necessary.
█ HOW TO USE
Please see instructions in the code. (Important: first fold all sections of the script: press Cmd + K then Cmd + - (for Windows Ctrl + K then Ctrl + -)
█ FULL LIST OF FUNCTIONS AND PARAMETERS
atr2(length)
An alternate ATR function to the `ta.atr()` built-in, which allows a "series float"
`length` argument.
Parameters:
length (float) : (series int/float) Length for the smoothing parameter calculation.
Returns: (float) The ATR value.
pine_supertrend2(factor, atrLength, wicks)
An alternate SuperTrend function to `supertrend()`, which allows a "series float"
`atrLength` argument.
Parameters:
factor (float) : (series int/float) Multiplier for the ATR value.
atrLength (float) : (series int/float) Length for the ATR smoothing parameter calculation.
wicks (simple bool) : (simple bool) Condition to determine whether to take candle wicks into account when
reversing trend, or to use the close price. Optional. Default is false.
Returns: ( ) A tuple of the superTrend value and trend direction.
method getDefaultBandQ1(bandType)
For a given BandType returns its default Q1
Namespace types: series BandTypes
Parameters:
bandType (series BandTypes)
method getDefaultBandQ2(bandType)
For a given BandType returns its default Q2
Namespace types: series BandTypes
Parameters:
bandType (series BandTypes)
method getDefaultBandQ3(bandType)
For a given BandType returns its default Q3
Namespace types: series BandTypes
Parameters:
bandType (series BandTypes)
method init(this, bandsType, q1, q2, q3, vwapAnchor)
Initiates RsParamsBands for each band (used in htfUpdate() withi req.sec())
Namespace types: RsParamsBands
Parameters:
this (RsParamsBands)
bandsType (series BandTypes)
q1 (float) : (float) Depending on type: BB - length, SAR - AF start, ST - ATR's prd
q2 (float) : (float) Depending on type: BB - StdDev mult, SAR - AF step, ST - mult
q3 (float) : (float) Depending on type: BB - not used, SAR - AF max, ST - not used
vwapAnchor (series VwapAnchors) : (VwapAnchors) VWAP ahcnor
method init(this, bandsType, tf, showRecentBars, lblsShow, lblsMaxLabels, lblSize, lnMidClr, lnUpClr, lnLoClr, fill, fillClr, lnWidth, lnSmoothen)
Initialises object with params (incl. input). Creates arrays if any.
Namespace types: HtfBands
Parameters:
this (HtfBands)
bandsType (series BandTypes) : (BandTypes) Just used to enable/disable - if BandTypes.none then disable )
tf (string) : (string) Timeframe
showRecentBars (int) : (int) Only show over this number of recent bars
lblsShow (bool) : (bool) Show labels
lblsMaxLabels (int) : (int) Max labels to show
lblSize (string) : (string) Size of the labels
lnMidClr (color) : (color) Middle band color
lnUpClr (color) : (color) Upper band color
lnLoClr (color) : (color) Lower band color
fill (bool)
fillClr (color) : (color) Fill color
lnWidth (int) : (int) Line width
lnSmoothen (bool) : (bool) Smoothen the bands
method htfUpdateTuple(rsPrms, repaint)
(HTF) Calculates Bands within request.security(). Returns tuple . If any or all of the bands are not available returns na as their value.
Namespace types: RsParamsBands
Parameters:
rsPrms (RsParamsBands) : (RsParamsBands) Parameters of the band.
repaint (bool) : (bool) If true does not update on realtime bars.
Returns: A tuple (corresponds to fields in RsReturnBands)
method importRsRetTuple(this, htfBi, mid, up, lo, dir)
Imports a tuple returned from req.sec() into an HtfBands object
Namespace types: HtfBands
Parameters:
this (HtfBands) : (HtfBands) Object to import to
htfBi (int) : (float) Higher timeframe's bar index (Default = na)
mid (float)
up (float) : (float) Value of upper band (Default = na)
lo (float) : (float) Value of lower band (Default = na)
dir (int) : (int) Direction (for bands like Parabolic SAR) (Default = na)
method addUpdDrawings(this, rsPrms)
Draws band's labels
Namespace types: HtfBands
Parameters:
this (HtfBands)
rsPrms (RsParamsBands)
method update(this)
Sets band's values to na on intrabars if `smoothen` is set.
Namespace types: HtfBands
Parameters:
this (HtfBands)
method newRsParamsBands(this)
A wraper for RsParamsBands.new()
Namespace types: LO_A
Parameters:
this (LO_A)
method newHtfBands(this)
A wraper for HtfBands.new()
Namespace types: LO_B
Parameters:
this (LO_B)
RsParamsBands
Used to pass bands' params to req.sec()
Fields:
bandsType (series BandTypes) : (enum BandTypes) Type of the band (BB, SAR etc.)
q1 (series float) : (float) Depending on type: BB - length, SAR - AF start, ST - ATR's prd
q2 (series float) : (float) Depending on type: BB - StdDev mult, SAR - AF step, ST - mult
q3 (series float) : (float) Depending on type: BB - not used, SAR - AF max, ST - not used
vwapAnchor (series VwapAnchors)
RsReturnBands
Used to return bands' data from req.sec(). Params of the bands are in RsParamsBands
Fields:
htfBi (series float) : (float) Higher timeframe's bar index (Default = na)
upBand (series float) : (float) Value of upper band (Default = na)
loBand (series float) : (float) Value of lower band (Default = na)
midBand (series float) : (float) Value of middle band (Default = na)
dir (series int) : (float) Direction (for bands like Parabolic SAR) (Default = na)
BandsDrawing
Contains plot visualization parameters and stores and keeps track of lines, labels and other visual objects (not plots)
Fields:
lnMidClr (series color) : (color) Middle band color
lnLoClr (series color) : (color) Lower band color
lnUpClr (series color) : (color) Upper band color
fillUpClr (series color)
fillLoClr (series color)
lnWidth (series int) : (int) Line width
lnSmoothen (series bool) : (bool) Smoothen the bands
showHistory (series bool) : (bool) If true show bands lines, otherwise only current level
showRecentBars (series int) : (int) Only show over this number of recent bars
arLbl (array) : (label Labels
lblsMaxLabels (series int) : (int) Max labels to show
lblsShow (series bool) : (bool) Show labels
lblSize (series string) : (string) Size of the labels
HtfBands
Calcs and draws HTF bands
Fields:
rsRet (RsReturnBands) : (RsReturnBands) Bands' values
rsRetNaObj (RsReturnBands) : (RsReturnBands) Dummy na obj for returning from request.security()
rsPrms (RsParamsBands) : (RsParamsBands) Band parameters (for htfUpdate() called in req.sec() )
drw (BandsDrawing) : (BandsDrawing) Contains plot visualization parameters and stores and keeps track of lines, labels and other visual objects (not plots)
enabled (series bool) : (bool) Toggles bands on/off
tf (series string) : (string) Timeframe
LO_A
LO Library object, whose only purpose is to serve as a shorthand for library name in script code.
Fields:
dummy (series string)
LO_B
LO Library object, whose only purpose is to serve as a shorthand for library name in script code.
Fields:
dummy (series string)

Market Structure & Liquidity: CHoCHs+Nested Pivots+FVGs+Sweeps//Purpose:
This indicator combines several tools to help traders track and interpret price action/market structure; It can be divided into 4 parts;
1. CHoCHs, 2. Nested Pivot highs & lows, 3. Grade sweeps, 4. FVGs.
This gives the trader a toolkit for determining market structure and shifts in market structure to help determine a bull or bear bias, whether it be short-term, med-term or long-term.
This indicator also helps traders in determining liquidity targets: wether they be voids/gaps (FVGS) or old highs/lows+ typical sweep distances.
Finally, the incorporation of HTF CHoCH levels printing on your LTF chart helps keep the bigger picture in mind and tells traders at a glance if they're above of below Custom HTF CHoCH up or CHoCH down (these HTF CHoCHs can be anything from Hourly up to Monthly).
//Nomenclature:
CHoCH = Change of Character
STH/STL = short-term high or low
MTH/MTL = medium-term high or low
LTH/LTL = long-term high or low
FVG = Fair value gap
CE = consequent encroachement (the midline of a FVG)
~~~ The Four components of this indicator ~~~
1. CHoCHs:
•Best demonstrated in the below charts. This was a method taught to me by @Icecold_crypto. Once a 3 bar fractal pivot gets broken, we count backwards the consecutive higher lows or lower highs, then identify the CHoCH as the opposite end of the candle which ended the consecutive backwards count. This CHoCH (UP or DOWN) then becomes a level to watch, if price passes through it in earnest a trader would consider shifting their bias as market structure is deemed to have shifted.
•HTF CHoCHs: Option to print Higher time frame chochs (default on) of user input HTF. This prints only the last UP choch and only the last DOWN choch from the input HTF. Solid line by default so as to distinguish from local/chart-time CHoCHs. Can be any Higher timeframe you like.
•Show on table: toggle on show table(above/below) option to show in table cells (top right): is price above the latest HTF UP choch, or is price below HTF DOWN choch (or is it sat between the two, in a state of 'uncertainty').
•Most recent CHoCHs which have not been met by price will extend 10 bars into the future.
• USER INPUTS: overall setting: SHOW CHOCHS | Set bars lookback number to limit historical Chochs. Set Live CHoCHs number to control the number of active recent chochs unmet by price. Toggle shrink chochs once hit to declutter chart and minimize old chochs to their origin bars. Set Multi-timeframe color override : to make Color choices auto-set to your preference color for each of 1m, 5m, 15m, H, 4H, D, W, M (where up and down are same color, but 'up' icon for up chochs and down icon for down chochs remain printing as normal)
2. Nested Pivot Highs & Lows; aka 'Pivot Highs & Lows (ST/MT/LT)'
•Based on a seperate, longer lookback/lookforward pivot calculation. Identifies Pivot highs and lows with a 'spikeyness' filter (filtering out weak/rounded/unimpressive Pivot highs/lows)
•by 'nested' I mean that the pivot highs are graded based on whether a pivot high sits between two lower pivot highs or vice versa.
--for example: STH = normal pivot. MTH is pivot high with a lower STH on either side. LTH is a pivot high with a lower MTH on either side. Same applies to pivot lows (STL/MTL/LTL)
•This is a useful way to measure the significance of a high or low. Both in terms of how much it might be typically swept by (see later) and what it would imply for HTF bias were we to break through it in earnest (more than just a sweep).
• USER INPUTS: overall setting: show pivot highs & lows | Bars lookback (historical pivots to show) | Pivots: lookback/lookforward length (determines the scale of your pivot highs/lows) | toggle on/off Apply 'Spikeyness' filter (filters out smooth/unimpressive pivot highs/lows). Set Spikeyness index (determines the strength of this filter if turned on) | Individually toggle on each of STH, MTH, LTH, STL, MTL, LTL along with their label text type , and size . Toggle on/off line for each of these Pivot highs/lows. | Set label spacer (atr multiples above / below) | set line style and line width
3. Grade Sweeps:
•These are directly related to the nested pivots described above. Most assets will have a typical sweep distance. I've added some of my expected sweeps for various assets in the indicator tooltips.
--i.e. Eur/Usd 10-20-30 pips is a typical 'grade' sweep. S&P HKEX:5 - HKEX:10 is a typical grade sweep.
•Each of the ST/MT/LT pivot highs and lows have optional user defined grade sweep boxes which paint above until filled (or user option for historical filled boxes to remain).
•Numbers entered into sweep input boxes are auto converted into appropriate units (i.e. pips for FX, $ or 'handles' for indices, $ for Crypto. Very low $ units can be input for low unit value crypto altcoins.
• USER INPUTS: overall setting: Show sweep boxes | individually select colors of each of STH, MTH, LTH, STL, MTL, LTL sweep boxes. | Set Grade sweep ($/pips) number for each of ST, MT, LT. This auto converts between pips and $ (i.e. FX vs Indices/Crypto). Can be a float as small or large as you like ($0.000001 to HKEX:1000 ). | Set box text position (horizontal & vertical) and size , and color . | Set Box width (bars) (for non extended/ non-auto-terminating at price boxes). | toggle on/off Extend boxes/lines right . | Toggle on/off Shrink Grade sweeps on fill (they will disappear in realtime when filled/passed through)
4. FVGs:
•Fair Value gaps. Represent 'naked' candle bodies where the wicks to either side do not meet, forming a 'gap' of sorts which has a tendency to fill, or at least to fill to midline (CE).
•These are ICT concepts. 'UP' FVGS are known as BISIs (Buyside imbalance, sellside inefficiency); 'DOWN' FVGs are known as SIBIs (Sellside imbalance, buyside inefficiency).
• USER INPUTS: overall setting: show FVGs | Bars lookback (history). | Choose to display: 'UP' FVGs (BISI) and/or 'DOWN FVGs (SIBI) . Choose to display the midline: CE , the color and the line style . Choose threshold: use CE (as opposed to Full Fill) |toggle on/off Shrink FVG on fill (CE hit or Full fill) (declutter chart/see backtesting history)
////••Alerts (general notes & cautionary notes)::
•Alerts are optional for most of the levels printed by this indicator. Set them via the three dots on indicator status line.
•Due to dynamic repainting of levels, alerts should be used with caution. Best use these alerts either for Higher time frame levels, or when closely monitoring price.
--E.g. You may set an alert for down-fill of the latest FVG below; but price will keep marching up; form a newer/higher FVG, and the alert will trigger on THAT FVG being down-filled (not the original)
•Available Alerts:
-FVG(BISI) cross above threshold(CE or full-fill; user choice). Same with FVG(SIBI).
-HTF last CHoCH down, cross below | HTF last CHoCH up, cross above.
-last CHoCH down, cross below | last CHoCH up, cross above.
-LTH cross above, MTH cross above, STH cross above | LTL cross below, MTL cross below, STL cross below.
////••Formatting (general)::
•all table text color is set from the 'Pivot highs & Lows (ST, MT, LT)' section (for those of you who prefer black backgrounds).
•User choice of Line-style, line color, line width. Same with Boxes. Icon choice for chochs. Char or label text choices for ST/MT/LT pivot highs & lows.
////••User Inputs (general):
•Each of the 4 components of this indicator can be easily toggled on/off independently.
•Quite a lot of options and toggle boxes, as described in full above. Please take your time and read through all the tooltips (hover over '!' icon) to get an idea of formatting options.
•Several Lookback periods defined in bars to control how much history is shown for each of the 4 components of this indicator.
•'Shrink on fill' settings on FVGs and CHoCHs: Basically a way to declutter chart; toggle on/off depending on if you're backtesting or reading live price action.
•Table Display: applies to ST/MT/LT pivot highs and to HTF CHoCHs; Toggle table on or off (in part or in full)
////••Credits:
•Credit to ICT (Inner Circle Trader) for some of the concepts used in this indicator (FVGS & CEs; Grade sweeps).
•Credit to @Icecold_crypto for the specific and novel concept of identifying CHoCHs in a simple, objective and effective manner (as demonstrated in the 1st chart below).
CHoCH demo page 1: shifting tweak; arrow diagrams to demonstrate how CHoCHs are defined:
CHoCH demo page 2: Simplified view; short lookback history; few CHoCHs, demo of 'latest' choch being extended into the future by 10 bars:
USAGE: Bitcoin Hourly using HTF daily CHoCHs:
USAGE-2: Cotton Futures (CT1!) 2hr. Painting a rather bullish picture. Above HTF UP CHoCH, Local CHoCHs show bullish order flow, Nice targets above (MTH/LTH + grade sweeps):
Full Demo; 5min chart; CHoCHs, Short term pivot highs/lows, grade sweeps, FVGs:
Full Demo, Eur/Usd 15m: STH, MTH, LTH grade sweeps, CHoCHs, Usage for finding bias (part A):
Full Demo, Eur/Usd 15m: STH, MTH, LTH grade sweeps, CHoCHs, Usage for finding bias, 3hrs later (part B):
Realtime Vs Backtesting(A): btc/usd 15m; FVGs and CHoCHs: shrink on fill, once filled they repaint discreetly on their origin bar only. Realtime (Shrink on fill, declutter chart):
Realtime Vs Backtesting(B): btc/usd 15m; FVGs and CHoCHs: DON'T shrink on fill; they extend to the point where price crosses them, and fix/paint there. Backtesting (seeing historical behaviour):

SuperTrend ToolkitThe SuperTrend Toolkit (Super Kit) introduces a versatile approach to trend analysis by extending the application of the SuperTrend indicator to a wide array of @TradingView's built-in or Community Scripts . This tool facilitates the integration of the SuperTrend algorithm with various indicators, including oscillators, moving averages, overlays, and channels.
Methodology:
The SuperTrend, at its core, calculates a trend-following indicator based on the Average-True-Range (ATR) and price action. It creates dynamic support and resistance levels, adjusting to changing market conditions, and aiding in trend identification.
pine_st(simple float factor = 3., simple int length = 10) =>
float atr = ta.atr(length)
float up = hl2 + factor * atr
up := up < nz(up ) or close > nz(up ) ? up : nz(up )
float lo = hl2 - factor * atr
lo := lo > nz(lo ) or close < nz(lo ) ? lo : nz(lo )
int dir = na
float st = na
if na(atr )
dir := 1
else if st == nz(up )
dir := close > up ? -1 : 1
else
dir := close < lo ? 1 : -1
st := dir == -1 ? lo : up
@TradingView's native SuperTrend lacks the flexibility to incorporate different price sources into its calculation.
Community scripts, addressed the limitation by implementing the option to input different price sources, for example, one of the most popular publications, @KivancOzbilgic's SuperTrend script.
In May 2023, @TradingView introduced an update allowing the passing of another indicator's plot as a source value via the input.source() function. However, the built-in ta.atr function still relied on the chart's price data, limiting the formerly mentioned scripts to the chart's price data alone.
Unique Approach -
This script addresses the aforementioned limitations by processing the data differently.
Firstly we create a User-Defined-Type (UDT) replicating a bar's open, high, low, close (OHLC) values.
type bar
float o = open
float h = high
float l = low
float c = close
We then use this type to store the external input data.
src = input.source(close, "External Source")
bar b = bar.new(
nz(src ) , open 𝘷𝘢𝘭𝘶𝘦
math.max(nz(src ), src), high 𝘷𝘢𝘭𝘶𝘦
math.min(nz(src ), src), low 𝘷𝘢𝘭𝘶𝘦
src ) close 𝘷𝘢𝘭𝘶𝘦
Finally, we pass the data into our custom built SuperTrend with ATR functions to derive the external source's version of the SuperTrend indicator.
supertrend st = b.st(mlt, len)
- Setup Guide -
Utility and Use Cases:
Universal Compatibility - Apply SuperTrend to any built-in indicator or script, expanding its use beyond traditional price data.
- A simple example on one of my own public scripts -
Trend Analysis - Gain additional trend insights into otherwise mainly mean reverting or volume indicators.
- Alerts Setup Guide -
The Super Kit empowers traders and analysts with a tool that adapts the robust SuperTrend algorithm to a myriad of indicators, allowing comprehensive trend analysis and strategy development.

Standardized SuperTrend Oscillator
The Standardized SuperTrend Oscillator (SSO) is a versatile tool that transforms the SuperTrend indicator into an oscillator, offering both trend-following and mean reversion capabilities. It provides deeper insights into trends by standardizing the SuperTrend with respect to its upper and lower bounds, allowing traders to identify potential reversals and contrarian signals.
Methodology:
Lets begin with describing the SuperTrend indicator, which is the fundamental tool this script is based on.
SuperTrend:
The SuperTrend is calculated based on the average true range (ATR) and multiplier. It identifies the trend direction by placing a line above or below the price. In an uptrend, the line is below the price; in a downtrend, it's above the price.
pine_st(float src = hl2, float factor = 3., simple int len = 10) =>
float atr = ta.atr(len)
float up = src + factor * atr
up := up < nz(up ) or close > nz(up ) ? up : nz(up )
float lo = src - factor * atr
lo := lo > nz(lo ) or close < nz(lo ) ? lo : nz(lo )
int dir = na
float st = na
if na(atr )
dir := 1
else if st == nz(up )
dir := close > up ? -1 : 1
else
dir := close < lo ? 1 : -1
st := dir == -1 ? lo : up
SSO Oscillator:
The SSO is derived from the SuperTrend and the source price. It calculates the standardized difference between the SuperTrend and the source price. The standardization is achieved by dividing this difference by the distance between the upper and lower bounds of the SuperTrend.
float sso = (src - st) / (up - lo)
Components and Features:
SuperTrend of Oscillator - An additional SuperTrend based on the direction and volatility of the oscillator, behaving as the SuperTrend OF the SuperTrend. This provides further trend analysis of the underlying broad trend regime.
Reversion Tracer - The RSI of the direction of the original SuperTrend, providing a dynamic threshold for premium and discount price areas.
float rvt = ta.rsi(dir, len)
Heikin Ashi Transform - An option to apply the Heikin Ashi transform to the source price of the oscillator, providing a smoother visual representation of trends.
Display Modes - Choose between Line mode for a standard oscillator view or Candle mode, displaying the oscillator as Heikin Ashi candles for more in-depth trend analysis.
Contrarian and Reversion Signals:
Contrarian Signals - Based on the SuperTrend of the oscillator, these signals can act as potential buy or sell indications, highlighting potential trend exhaustion or premature reversals.
Reversion Signals - Generated when the oscillator crosses above or below the Reversion Tracer, signaling potential mean reversion opportunities or trend breakouts.
Utility and Use Cases:
Trend Analysis - Utilize the SSO as a trend-following tool with the added benefits of the oscillator's SuperTrend and Heikin Ashi transform.
Valuation Analysis - Leverage the oscillator's reversion signals for identifying potential mean reversion opportunities in the market.
The Standardized SuperTrend Oscillator enhances the capabilities of the SuperTrend indicator, offering a balanced approach to both trend-following and mean reversion strategies. Its customizable options and contrarian signals make it a valuable instrument for traders seeking comprehensive trend analysis and potential reversal signals.

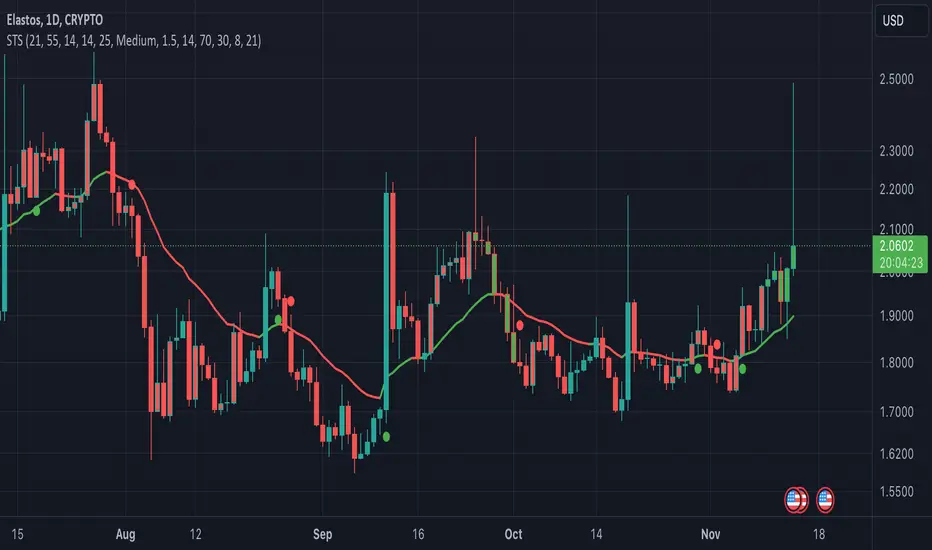
Sash Trending Suite NEWWhy
The " Sash Trending Suite " (STS) indicator simplifies trading by highlighting market trends and potential reversals. In a world of complex charts and overwhelming data, STS helps traders quickly understand market direction and make informed decisions.
---
How and What
STS combines key technical tools into one easy-to-read indicator, directly showing important signals on the chart:
Macro Trend Detection
How : Uses two EMAs (fast and slow) and the ADX to identify strong bullish or bearish trends.
What to Look For :
Bar Colors :
Green Bars : Indicate a strong upward (bullish) trend.
Red Bars : Indicate a strong downward (bearish) trend.
Benefit : Quickly see the overall market direction.
Alpha Track Line
How : An adaptive EMA that acts as a dynamic support or resistance line.
What to Look For :
Line Colors :
Green Line : Price is above the line (bullish momentum).
Red Line : Price is below the line (bearish momentum).
Benefit : Visualize momentum shifts easily.
Reversal Signals
How : Combines RSI with price action to spot potential market reversals.
What to Look For :
"R" Labels :
Turquoise "R" Below Bar : Potential bullish reversal.
Amber "R" Above Bar : Potential bearish reversal.
Benefit : Identify possible turning points for entry or exit.
Micro Trend Detection
How : Uses shorter EMAs to catch minor trend changes.
What to Look For :
Small Circles :
Green Circle Below Bar : Micro bullish signal.
Red Circle Above Bar : Micro bearish signal.
Benefit : Spot short-term trend shifts promptly.
Alerts
How : Built-in alerts notify you of key events.
What to Expect :
Trend Changes : Alerts when a new bullish or bearish trend starts.
Reversals : Alerts for potential bullish or bearish reversals.
Benefit : Stay updated without constantly watching the chart.
---
Summary
The "Sash Trending Suite" provides:
Simplified Analysis : One indicator shows trend direction, momentum, reversals, and micro trends.
Clear Visuals : Color-coded bars and symbols make interpretation easy.
Timely Alerts : Know about important market changes instantly.
By focusing on essential signals and displaying them clearly, STS helps traders navigate the market with confidence and simplicity.
Dr.Om's SuperTrend IndicatorRiding along the Super Trend -
Super Trend Bullish candle (STBullCandle) is a candle where low is lower than supertrend and close is greater than super trend.
Conditions for going Long -
1. High of current candle should be higher than high of STBullCandle.
2. We can consider 1 or 2 candles after the STBullCandle for this condition.
3. If filterRsi is enabled, then we make an additional check of RSI being greater than the weighted moving average.
4. Should not be holding an existing long position
5. SuperTrend should be positive
Super Trend Bearish candle (STBearCandle) is a candle where high is higher than supertrend and close is lower than super trend.
Conditions for going Short -
1. Low of current candle should be lower than low of STBullCandle.
2. We can consider 1 or 2 candles after the STBearCandle for this condition.
3. If filterRsi is enabled, then we make an additional check of RSI being lower than the weighted moving average.
4. Should not be holding an existing short position
5. SuperTrend should be negative.
If holding long, EXIT LONG Position Criteria -
1. SL would be if close is lesser than the ST candle low
2. Direction of ST becomes Negative
3. If Reward to Risk ratio is given, then exit if target is achieved.
If holding short, EXIT SHORT Position Criteria -
1. SL would be if close is higher than the ST candle high
2. Direction of ST becomes +ve
3. If Reward to Risk ratio is given, then exit if target is achieved.

SOFTENED RSI DİFFRACTİON BANDSThis indicator takes the moving averages of the rsi values, gives signals in the lower and upper breaks, prevents the rsi upper threshold from signaling above a certain rsi value, as the rsi upper threshold value increases, the number of signals increases and the number of risky signals also increases. As the rsi upper threshold value decreases, the signals decrease and become better quality You can determine the most appropriate threshold value according to the commodity type.
bu indikatör rsi değerlerinin hareketli ortalamalarını alır alttan ve üstten kırılımlarında sinyal verir rsi üst eşiği belli bir rsi değerinin üstünde sinyal vermesini engeller rsi üst eşik değeri arttıkça sinyal sayısı artar aynı zamanda riskli sinyal sayısıda artar rsi üst eşik değeri azaldıkça sinyaller azalır ve daha kaliteli hale gelir emtia tipine göre en uygun eşik değerini belirleyebilirsiniz.
HYE Trend Hunter [Strategy]*** Stratejinin Türkçe ve İngilizce açıklaması aşağıya eklenmiştir.
HYE Trend Hunter
In this strategy, two of the most basic data (price and volume) necessary for detecting trends as early as possible and entering the trade on time are used. In this context, the approaches of some classical and new generation indicators using price and volume have been taken into account.
The strategy is prepared to generate buy signals only. The following steps were followed to generate the buy and exit signals.
1-) First of all, the two most basic data of the strategy, “slow leading line” and “fast leading line” need to be calculated. For this, we use the formula of the “senkou span A” line of the indicator known as the Ichimoku Cloud. We also need to calculate lines known as tenkan sen and kijun sen in ichimoku because they are used in the calculation of this formula.
The high and low values of the candles are taken into account when calculating the Tenkansen, Kijunsen and Senkou Span A lines in the Ichimoku cloud. In this strategy, the highest and lowest values of the periodic VWAP are taken into account when calculating the "slow leading line" and "fast leading line". (The periodic vwap formula was coded and made available by @neolao on tradingviev). Also, in the ichimoku cloud, while the Senkou Span A line is plotted 26 periods into the future, we consider the values of the fast and slow leading lines in the last candle in this strategy.
ORIGINAL ICHIMOKU SPAN A FORMULA
Tenkansen = (Highest high of the last 9 candles + Lowest low of the last 9 candles) / 2
Kijunsen = (Highest high of the last 26 candles + Lowest low of the last 26 candles) / 2
Senkou Span A = Tenkansen + Kijunsen / 2
HYE TREND HUNTER SPAN A FORMULA*
Tenkansen = (Highest VWAP of the last 9 candles + Lowest VWAP of the last 9 candles) / 2
Kijunsen = (Highest VWAP of the last 26 candles + Lowest VWAP of the last 26 candles) / 2
Senkou Span A = Tenkansen + Kijunsen / 2
* We use the original ichimoku values 9 and 26 for the slow line, and 5 and 13 for the fast line. These settings can be changed from the strategy settings.
2-) At this stage, we have 2 lines that we obtained by using the formula of the ichimoku cloud, one of the most classical trend indicators, and by including the volume-weighted average price.
a-) Fast Leading Line (5-13)
b-) Slow Leading Line (9-26)
For the calculation we will do soon, we get a new value by taking the average of these two lines. Using this value, which is the average of the fast and slow leading lines, we plot the Bollinger Bands indicator, which is known as one of the most classic volatility indicators of technical analysis. Thus, we are trying to understand whether there is a volatility change in the market, which may mean the presence of a trend start. We will use this data in the calculation of buy-sell signals.
In the classical Bollinger Bands calculation, the standard deviation is calculated by applying a multiplier at the rate determined by the user (2 is used in the original settings) to the moving average calculated with the “closing price”, and this value is added or subtracted from the moving average and upper band and lower band lines are drawn.
In the HYE Trend Hunter Strategy, instead of the moving average calculated with the closing price in the Bollinger Band calculation, we consider the average of the fast and slow leading lines calculated in the 1st step and draw the Bollinger upper and lower bands accordingly. We use the values of 2 and 20 as the standard deviation and period, as in the original settings. These settings can also be changed from the strategy settings.
3-) At this stage, we have fast and slow leading lines trying to understand the trend direction using VWAP, and Bollinger lower and upper bands calculated by the average of these lines.
In this step, we will use another tool that will help us understand whether the invested market (forex, crypto, stocks) is gaining momentum in volume. The Time Segmented Volume indicator was created by the Worden Brothers Inc. and coded by @liw0 and @vitelot on tradingview. The TSV indicator segments the price and volume of an investment instrument according to certain time periods and makes calculations on comparing these price and volume data to reveal the buying and selling periods.
To trade in the buy direction on the HYE Trend Hunter Strategy, we look for the TSV indicator to be above 0 and above its exponential moving average value. TSV period and exponential moving average period settings (13 and 7) can also be changed in the strategy settings.
BUY SIGNAL
1-) Fast Leading Line value should be higher than the Fast Leading Line value in the previous candle.
2-) Slow Leading Line value should be higher than the Slow Leading Line value in the previous candle.
3-) Candle Closing value must be higher than the Upper Bollinger Band.
4-) TSV value must be greater than 0.
5-) TSV value must be greater than TSVEMA value.
EXIT SIGNAL
1-) Fast Leading Line value should be lower than the Fast Leading Line value in the previous candle.
2-) Slow Leading Line value should be lower than the Slow Leading Line value in the previous candle.
TIPS AND WARNINGS
1-) The standard settings of the strategy work better in higher timeframes (4-hour, daily, etc.). For lower timeframes, you should change the strategy settings and find the best value for yourself.
2-) All lines (fast and slow leading lines and Bollinger bands) except TSV are displayed on the strategy. For a simpler view, you can hide these lines in the strategy settings.
3-) You can see the color changes of the fast and slow leading lines as well as you can specify a single color for these lines in the strategy settings.
4-) It is an strategy for educational and experimental purposes. It cannot be considered as investment advice. You should be careful and make your own risk assessment when opening real market trades using this strategy.
_______________________________________________
HYE Trend Avcısı
Bu stratejide, trendlerin olabildiğince erken tespit edilebilmesi ve zamanında işleme girilebilmesi için gerekli olan en temel iki veriden (fiyat ve hacim) yararlanılmaktadır. Bu kapsamda, fiyat ve hacim kullanan bazı klasik ve yeni nesil indikatörlerin yaklaşımları dikkate alınmıştır.
Strateji yalnızca alış yönlü sinyaller üretecek şekilde hazırlanmıştır. Alış ve çıkış sinyallerinin üretilmesi için aşağıdaki adımlar izlenmiştir.
1-) Öncelikle, stratejinin en temel iki verisi olan “yavaş öncü çizgi” ve “hızlı öncü çizgi” hesaplamasının yapılması gerekiyor. Bunun için de Ichimoku Bulutu olarak bilinen indikatörün “senkou span A” çizgisinin formülünü kullanıyoruz. Bu formülün hesaplamasında kullanılmaları nedeniyle ichimoku’da tenkan sen ve kijun sen olarak bilinen çizgileri de hesaplamamız gerekiyor.
Ichimoku bulutunda Tenkansen, Kijunsen ve Senkou Span A çizgileri hesaplanırken mumların yüksek ve düşük değerleri dikkate alınıyor. Bu stratejide ise “yavaş öncü çizgi” ve “hızlı öncü çizgi” hesaplanırken periyodik VWAP’ın en yüksek ve en düşük değerleri dikkate alınıyor. (Periyodik vwap formülü, tradingviev’de @neolao tarafından kodlanmış ve kullanıma açılmış). Ayrıca, ichimoku bulutunda Senkou Span A çizgisi geleceğe yönelik çizilirken (26 mum ileriye dönük) biz bu stratejide öncü çizgilerin son mumdaki değerlerini dikkate alıyoruz.
ORJİNAL ICHIMOKU SPAN A FORMÜLÜ
Tenkansen = (Son 9 mumun en yüksek değeri + Son 9 mumun en düşük değeri) / 2
Kijunsen = (Son 26 mumun en yüksek değeri + Son 26 mumun en düşük değeri) / 2
Senkou Span A = Tenkansen + Kijunsen / 2
HYE TREND HUNTER SPAN A FORMÜLÜ*
Tenkansen = (Son 9 mumun en yüksek VWAP değeri + Son 9 mumun en düşük VWAP değeri) / 2
Kijunsen = (Son 26 mumun en yüksek VWAP değeri + Son 26 mumun en düşük VWAP değeri) / 2
Senkou Span A = Tenkansen + Kijunsen / 2
* Yavaş çizgi için orijinal ichimoku değerleri olan 9 ve 26’yı kullanırken, hızlı çizgi için 5 ve 13’ü kullanıyoruz. Bu ayarlar, strateji ayarlarından değiştirilebiliyor.
2-) Bu aşamada, elimizde en klasik trend indikatörlerinden birisi olan ichimoku bulutunun formülünden faydalanarak, işin içinde hacim ağırlıklı ortalama fiyatı da sokmak suretiyle elde ettiğimiz 2 çizgimiz var.
a-) Hızlı Öncü Çizgi (5-13)
b-) Yavaş Öncü Çizgi (9-26)
Birazdan yapacağımız hesaplama için bu iki çizginin de ortalamasını alarak yeni bir değer elde ediyoruz. Hızlı ve yavaş öncü çizgilerin ortalaması olan bu değeri kullanarak, teknik analizin en klasik volatilite indikatörlerinden birisi olarak bilinen Bollinger Bantları indikatörünü çizdiriyoruz. Böylelikle piyasada bir trend başlangıcının varlığı anlamına gelebilecek volatilite değişikliği var mı yok mu anlamaya çalışıyoruz. Bu veriyi al-sat sinyallerinin hesaplamasında kullanacağız.
Klasik Bollinger Bantları hesaplamasında, “kapanış fiyatıyla” hesaplanan hareketli ortalamaya, kullanıcı olarak belirlenen oranda (orijinal ayarlarında 2 kullanılır) bir çarpan uygulanarak standart sapma hesaplanıyor ve bu değer hareketli ortalamaya eklenip çıkartılarak üst bant ve alt bant çizgileri çiziliyor.
HYE Trend Avcısı stratejisinde, Bollinger Bandı hesaplamasında kapanış fiyatıyla hesaplanan hareketli ortalama yerine, 1. adımda hesapladığımız hızlı ve yavaş öncü çizgilerin ortalamasını dikkate alıyoruz ve buna göre bollinger üst ve alt bantlarını çizdiriyoruz. Standart sapma ve periyot olarak yine orijinal ayarlarında olduğu gibi 2 ve 20 değerlerini kullanıyoruz. Bu ayarlar da strateji ayarlarından değiştirilebiliyor.
3-) Bu aşamada, elimizde VWAP kullanarak trend yönünü anlamaya çalışan hızlı ve yavaş öncü çizgilerimiz ile bu çizgilerin ortalaması ile hesaplanan bollinger alt ve üst bantlarımız var.
Bu adımda, yatırım yapılan piyasanın (forex, kripto, hisse senedi) hacimsel olarak ivme kazanıp kazanmadığını anlamamıza yarayacak bir araç daha kullanacağız. Time Segmented Volume indikatörü, Worden Kardeşler şirketi tarafından oluşturulmuş ve tradingview’de @liw0 ve @vitelot tarafından kodlanarak kullanıma açılmış. TSV indikatörü, bir yatırım aracının fiyatını ve hacmini belirli zaman aralıklarına göre bölümlere ayırarak, bu fiyat ve hacim verilerini, alış ve satış dönemlerini ortaya çıkarmak için karşılaştırmak üzerine hesaplamalar yapar.
HYE Trend Avcısı stratejisinde alış yönünde işlem yapmak için, TSV indikatörünün 0’ın üzerinde olmasını ve kendi üstel hareketli ortalama değerinin üzerinde olmasını arıyoruz. TSV periyodu ve üstel hareketli ortalama periyodu ayarları da (13 ve 7) strateji ayarlarından değiştirilebiliyor.
ALIŞ SİNYALİ
1-) Hızlı Öncü Çizgi değeri bir önceki mumdaki Hızlı Öncü Çizgi değerinden yüksek olmalı.
2-) Yavaş Öncü Çizgi değeri bir önceki mumdaki Yavaş Öncü Çizgi değerinden yüksek olmalı.
3-) Kapanış Değeri, Üst Bollinger Bandı değerinden yüksek olmalı.
4-) TSV değeri 0’dan büyük olmalı.
5-) TSV değeri TSVEMA değerinden büyük olmalı.
ÇIKIŞ SİNYALİ
1-) Hızlı Öncü Çizgi değeri bir önceki mumdaki Hızlı Öncü Çizgi değerinden düşük olmalı.
2-) Yavaş Öncü Çizgi değeri bir önceki mumdaki Yavaş Öncü Çizgi değerinden düşük olmalı.
İPUÇLARI VE UYARILAR
1-) Stratejinin standart ayarları, yüksek zaman dilimlerinde (4 saatlik, günlük vs.) daha iyi çalışıyor. Düşük zaman dilimleri için strateji ayarlarını değiştirmeli ve kendiniz için en iyi değeri bulmalısınız.
2-) Stratejide tüm çizgiler (hızlı ve yavaş öncü çizgiler ile bollinger bantları) -TSV dışında- açık olarak gelmektedir. Daha sade bir görüntü için bu çizgilerin görünürlüğünü strateji ayarlarından gizleyebilirsiniz.
3-) Hızlı ve yavaş öncü çizgilerin renk değişimlerini görebileceğiniz gibi bu çizgiler için tek bir renk olarak da strateji ayarlarında belirleme yapabilirsiniz.
4-) Eğitim ve deneysel amaçlı bir stratejidir. Yatırım tavsiyesi olarak değerlendirilemez. Bu stratejiyi kullanarak gerçek piyasa işlem açarken dikkatli olmalı ve kendi risk değerlendirmenizi yapmalısınız.

HYE Trend Hunter [Indicator]*** İndikatörün Türkçe ve İngilizce açıklaması aşağıya eklenmiştir.
HYE Trend Hunter
In this indicator, two of the most basic data (price and volume) necessary for detecting trends as early as possible and entering the trade on time are used. In this context, the approaches of some classical and new generation indicators using price and volume have been taken into account.
The indicator is prepared to generate buy signals only. The following steps were followed to generate the buy and exit signals.
1-) First of all, the two most basic data of the indicator, “slow leading line” and “fast leading line” need to be calculated. For this, we use the formula of the “senkou span A” line of the indicator known as the Ichimoku Cloud. We also need to calculate lines known as tenkan sen and kijun sen in ichimoku because they are used in the calculation of this formula.
The high and low values of the candles are taken into account when calculating the Tenkansen, Kijunsen and Senkou Span A lines in the Ichimoku cloud. In this indicator, the highest and lowest values of the periodic VWAP are taken into account when calculating the "slow leading line" and "fast leading line". (The periodic vwap formula was coded and made available by @neolao on tradingviev). Also, in the ichimoku cloud, while the Senkou Span A line is plotted 26 periods into the future, we consider the values of the fast and slow leading lines in the last candle in this indicator.
ORIGINAL ICHIMOKU SPAN A FORMULA
Tenkansen = (Highest high of the last 9 candles + Lowest low of the last 9 candles) / 2
Kijunsen = (Highest high of the last 26 candles + Lowest low of the last 26 candles) / 2
Senkou Span A = Tenkansen + Kijunsen / 2
HYE TREND HUNTER SPAN A FORMULA*
Tenkansen = (Highest VWAP of the last 9 candles + Lowest VWAP of the last 9 candles) / 2
Kijunsen = (Highest VWAP of the last 26 candles + Lowest VWAP of the last 26 candles) / 2
Senkou Span A = Tenkansen + Kijunsen / 2
* We use the original ichimoku values 9 and 26 for the slow line, and 5 and 13 for the fast line. These settings can be changed from the indicator settings.
2-) At this stage, we have 2 lines that we obtained by using the formula of the ichimoku cloud, one of the most classical trend indicators, and by including the volume-weighted average price.
a-) Fast Leading Line (5-13)
b-) Slow Leading Line (9-26)
For the calculation we will do soon, we get a new value by taking the average of these two lines. Using this value, which is the average of the fast and slow leading lines, we plot the Bollinger Bands indicator, which is known as one of the most classic volatility indicators of technical analysis. Thus, we are trying to understand whether there is a volatility change in the market, which may mean the presence of a trend start. We will use this data in the calculation of buy-sell signals.
In the classical Bollinger Bands calculation, the standard deviation is calculated by applying a multiplier at the rate determined by the user (2 is used in the original settings) to the moving average calculated with the “closing price”, and this value is added or subtracted from the moving average and upper band and lower band lines are drawn.
In the HYE Trend Hunter indicator, instead of the moving average calculated with the closing price in the Bollinger Band calculation, we consider the average of the fast and slow leading lines calculated in the 1st step and draw the Bollinger upper and lower bands accordingly. We use the values of 2 and 20 as the standard deviation and period, as in the original settings. These settings can also be changed from the indicator settings.
3-) At this stage, we have fast and slow leading lines trying to understand the trend direction using VWAP, and Bollinger lower and upper bands calculated by the average of these lines.
In this step, we will use another tool that will help us understand whether the invested market (forex, crypto, stocks) is gaining momentum in volume. The Time Segmented Volume indicator was created by the Worden Brothers Inc. and coded by @liw0 and @vitelot on tradingview. The TSV indicator segments the price and volume of an investment instrument according to certain time periods and makes calculations on comparing these price and volume data to reveal the buying and selling periods.
To trade in the buy direction on the HYE Trend Hunter indicator, we look for the TSV indicator to be above 0 and above its exponential moving average value. TSV period and exponential moving average period settings (13 and 7) can also be changed in the indicator settings.
BUY SIGNAL
1-) Fast Leading Line value should be higher than the Fast Leading Line value in the previous candle.
2-) Slow Leading Line value should be higher than the Slow Leading Line value in the previous candle.
3-) Candle Closing value must be higher than the Upper Bollinger Band.
4-) TSV value must be greater than 0.
5-) TSV value must be greater than TSVEMA value.
EXIT SIGNAL
1-) Fast Leading Line value should be lower than the Fast Leading Line value in the previous candle.
2-) Slow Leading Line value should be lower than the Slow Leading Line value in the previous candle.
TIPS AND WARNINGS
1-) The standard settings of the indicator work better in higher timeframes (4-hour, daily, etc.). For lower timeframes, you should change the indicator settings and find the best value for yourself.
2-) All lines (fast and slow leading lines and Bollinger bands) except TSV are displayed on the indicator. For a simpler view, you can hide these lines in the indicator settings.
3-) You can see the color changes of the fast and slow leading lines as well as you can specify a single color for these lines in the Indicator settings.
4-) Alarms have been added for Buy and Exit. When setting up the alarm, you should set it to be triggered at "every bar close". Otherwise it may repaint. There is no repaint after the candle closes.
5-) It is an indicator for educational and experimental purposes. It cannot be considered as investment advice. You should be careful and make your own risk assessment when opening real market trades using this indicator.
_______________________________________________
HYE Trend Avcısı
Bu indikatörde, trendlerin olabildiğince erken tespit edilebilmesi ve zamanında işleme girilebilmesi için gerekli olan en temel iki veriden (fiyat ve hacim) yararlanılmaktadır. Bu kapsamda, fiyat ve hacim kullanan bazı klasik ve yeni nesil indikatörlerin yaklaşımları dikkate alınmıştır.
İndikatör yalnızca alış yönlü sinyaller üretecek şekilde hazırlanmıştır. Alış ve çıkış sinyallerinin üretilmesi için aşağıdaki adımlar izlenmiştir.
1-) Öncelikle, indikatörün en temel iki verisi olan “yavaş öncü çizgi” ve “hızlı öncü çizgi” hesaplamasının yapılması gerekiyor. Bunun için de Ichimoku Bulutu olarak bilinen indikatörün “senkou span A” çizgisinin formülünü kullanıyoruz. Bu formülün hesaplamasında kullanılmaları nedeniyle ichimoku’da tenkan sen ve kijun sen olarak bilinen çizgileri de hesaplamamız gerekiyor.
Ichimoku bulutunda Tenkansen, Kijunsen ve Senkou Span A çizgileri hesaplanırken mumların yüksek ve düşük değerleri dikkate alınıyor. Bu indikatörde ise “yavaş öncü çizgi” ve “hızlı öncü çizgi” hesaplanırken periyodik VWAP’ın en yüksek ve en düşük değerleri dikkate alınıyor. (Periyodik vwap formülü, tradingviev’de @neolao tarafından kodlanmış ve kullanıma açılmış). Ayrıca, ichimoku bulutunda Senkou Span A çizgisi geleceğe yönelik çizilirken (26 mum ileriye dönük) biz bu indikatörde öncü çizgilerin son mumdaki değerlerini dikkate alıyoruz.
ORJİNAL ICHIMOKU SPAN A FORMÜLÜ
Tenkansen = (Son 9 mumun en yüksek değeri + Son 9 mumun en düşük değeri) / 2
Kijunsen = (Son 26 mumun en yüksek değeri + Son 26 mumun en düşük değeri) / 2
Senkou Span A = Tenkansen + Kijunsen / 2
HYE TREND HUNTER SPAN A FORMÜLÜ*
Tenkansen = (Son 9 mumun en yüksek VWAP değeri + Son 9 mumun en düşük VWAP değeri) / 2
Kijunsen = (Son 26 mumun en yüksek VWAP değeri + Son 26 mumun en düşük VWAP değeri) / 2
Senkou Span A = Tenkansen + Kijunsen / 2
* Yavaş çizgi için orijinal ichimoku değerleri olan 9 ve 26’yı kullanırken, hızlı çizgi için 5 ve 13’ü kullanıyoruz. Bu ayarlar, indikatör ayarlarından değiştirilebiliyor.
2-) Bu aşamada, elimizde en klasik trend indikatörlerinden birisi olan ichimoku bulutunun formülünden faydalanarak, işin içinde hacim ağırlıklı ortalama fiyatı da sokmak suretiyle elde ettiğimiz 2 çizgimiz var.
a-) Hızlı Öncü Çizgi (5-13)
b-) Yavaş Öncü Çizgi (9-26)
Birazdan yapacağımız hesaplama için bu iki çizginin de ortalamasını alarak yeni bir değer elde ediyoruz. Hızlı ve yavaş öncü çizgilerin ortalaması olan bu değeri kullanarak, teknik analizin en klasik volatilite indikatörlerinden birisi olarak bilinen Bollinger Bantları indikatörünü çizdiriyoruz. Böylelikle piyasada bir trend başlangıcının varlığı anlamına gelebilecek volatilite değişikliği var mı yok mu anlamaya çalışıyoruz. Bu veriyi al-sat sinyallerinin hesaplamasında kullanacağız.
Klasik Bollinger Bantları hesaplamasında, “kapanış fiyatıyla” hesaplanan hareketli ortalamaya, kullanıcı olarak belirlenen oranda (orijinal ayarlarında 2 kullanılır) bir çarpan uygulanarak standart sapma hesaplanıyor ve bu değer hareketli ortalamaya eklenip çıkartılarak üst bant ve alt bant çizgileri çiziliyor.
HYE Trend Avcısı indikatöründe, Bollinger Bandı hesaplamasında kapanış fiyatıyla hesaplanan hareketli ortalama yerine, 1. adımda hesapladığımız hızlı ve yavaş öncü çizgilerin ortalamasını dikkate alıyoruz ve buna göre bollinger üst ve alt bantlarını çizdiriyoruz. Standart sapma ve periyot olarak yine orijinal ayarlarında olduğu gibi 2 ve 20 değerlerini kullanıyoruz. Bu ayarlar da indikatör ayarlarından değiştirilebiliyor.
3-) Bu aşamada, elimizde VWAP kullanarak trend yönünü anlamaya çalışan hızlı ve yavaş öncü çizgilerimiz ile bu çizgilerin ortalaması ile hesaplanan bollinger alt ve üst bantlarımız var.
Bu adımda, yatırım yapılan piyasanın (forex, kripto, hisse senedi) hacimsel olarak ivme kazanıp kazanmadığını anlamamıza yarayacak bir araç daha kullanacağız. Time Segmented Volume indikatörü, Worden Kardeşler şirketi tarafından oluşturulmuş ve tradingview’de @liw0 ve @vitelot tarafından kodlanarak kullanıma açılmış. TSV indikatörü, bir yatırım aracının fiyatını ve hacmini belirli zaman aralıklarına göre bölümlere ayırarak, bu fiyat ve hacim verilerini, alış ve satış dönemlerini ortaya çıkarmak için karşılaştırmak üzerine hesaplamalar yapar.
HYE Trend Avcısı indikatöründe alış yönünde işlem yapmak için, TSV indikatörünün 0’ın üzerinde olmasını ve kendi üstel hareketli ortalama değerinin üzerinde olmasını arıyoruz. TSV periyodu ve üstel hareketli ortalama periyodu ayarları da (13 ve 7) indikatör ayarlarından değiştirilebiliyor.
ALIŞ SİNYALİ
1-) Hızlı Öncü Çizgi değeri bir önceki mumdaki Hızlı Öncü Çizgi değerinden yüksek olmalı.
2-) Yavaş Öncü Çizgi değeri bir önceki mumdaki Yavaş Öncü Çizgi değerinden yüksek olmalı.
3-) Kapanış Değeri, Üst Bollinger Bandı değerinden yüksek olmalı.
4-) TSV değeri 0’dan büyük olmalı.
5-) TSV değeri TSVEMA değerinden büyük olmalı.
ÇIKIŞ SİNYALİ
1-) Hızlı Öncü Çizgi değeri bir önceki mumdaki Hızlı Öncü Çizgi değerinden düşük olmalı.
2-) Yavaş Öncü Çizgi değeri bir önceki mumdaki Yavaş Öncü Çizgi değerinden düşük olmalı.
İPUÇLARI VE UYARILAR
1-) İndikatörün standart ayarları, yüksek zaman dilimlerinde (4 saatlik, günlük vs.) daha iyi çalışıyor. Düşük zaman dilimleri için indikatör ayarlarını değiştirmeli ve kendiniz için en iyi değeri bulmalısınız.
2-) İndikatörde tüm çizgiler (hızlı ve yavaş öncü çizgiler ile bollinger bantları) -TSV dışında- açık olarak gelmektedir. Daha sade bir görüntü için bu çizgilerin görünürlüğünü indikatör ayarlarından gizleyebilirsiniz.
3-) Hızlı ve yavaş öncü çizgilerin renk değişimlerini görebileceğiniz gibi bu çizgiler için tek bir renk olarak da İndikatör ayarlarında belirleme yapabilirsiniz.
4-) Alış ve Çıkış için alarmlar eklenmiştir. Alarm kurulumu yaparken “Her çubuk kapanışında” tetiklenecek şekilde ayarlama yapmalısınız. Aksi takdirde repaint yapabilir. Mum kapanışından sonra repaint söz konusu değildir.
5-) Eğitim ve deneysel amaçlı bir indikatördür. Yatırım tavsiyesi olarak değerlendirilemez. Bu indikatörü kullanarak gerçek piyasa işlem açarken dikkatli olmalı ve kendi risk değerlendirmenizi yapmalısınız.

Wyckoff Accumulation Distribution Wyckoff Accumulation & Distribution Indicator (RSI-Based)
This Pine Script is a technical analysis indicator built around the Wyckoff Method, designed to detect accumulation and distribution phases using RSI (Relative Strength Index) and pivot points. It automatically marks key structural turning points on the chart and highlights relevant zones with colored boxes.
What Does It Do?
Draws accumulation and distribution boxes based on RSI behavior.
Automatically detects Wyckoff structural signals:
SC (Selling Climax)
AR (Automatic Rally)
ST (Secondary Test)
BC (Buying Climax)
DAR (Automatic Reaction)
DST (Secondary Test - Distribution)
Identifies trend transitions by detecting sideways RSI movement.
Attempts to detect spring and UTAD-like deviations based on RSI reversals.
Uses RSI extremes in conjunction with pivot points to generate Wyckoff signals.
How Does It Work?
RSI Zone: It identifies sideways markets when RSI stays within ±20 of the 50 level (this range is configurable).
Pivot Points: It detects pivot highs/lows that sync with RSI values (pivotLen is adjustable).
Trend Box Drawing:
When RSI exits the sideways zone, the script draws a gray box between the highest high and lowest low within that range.
If RSI breaks upward, the box becomes green (Accumulation); if downward, it becomes red (Distribution).
Wyckoff Structural Points:
SC/BC: Detected when a pivot occurs with RSI below/above a threshold.
AR/DAR: The next opposite pivot after SC or BC.
ST/DST: The next same-direction pivot after AR or DAR.
How to Use It
Works best on 4H or daily charts for more reliable signals. Shorter timeframes may generate noise.
Primarily used for interpreting RSI structures through the lens of Wyckoff methodology.
Box colors help quickly identify market phase:
Green box: Likely Accumulation
Red box: Likely Distribution
Triangular markers show key signals:
SC, AR, ST: Accumulation points
BC, DAR, DST: Distribution points
Use these signals alongside price action to manually interpret Wyckoff phases.
image.binance.vision
image.binance.vision
What Is the Wyckoff Method?
The Wyckoff Method, developed in the 1930s by Richard Wyckoff, is a market analysis approach that focuses on supply and demand dynamics behind price movements.
Wyckoff’s 5 Phases:
Accumulation: Smart money gradually buying at low prices.
Markup: Price begins trending upwards.
Distribution: Smart money selling to retail traders.
Markdown: Downtrend begins as supply outweighs demand.
Re-accumulation / Re-distribution: Trend-continuation phases with consolidations.
This indicator is specifically designed to detect phase 1 (Accumulation) and phase 3 (Distribution).
Extra Notes
Repainting is minimal, as pivots are confirmed using historical candles.
Labels use plotshape for a clean, minimalist visual style.
Other Wyckoff events (like SOS, LPS, UT, UTAD) could be added in future updates.
This script does not generate buy/sell signals; it is meant for structural interpretation.
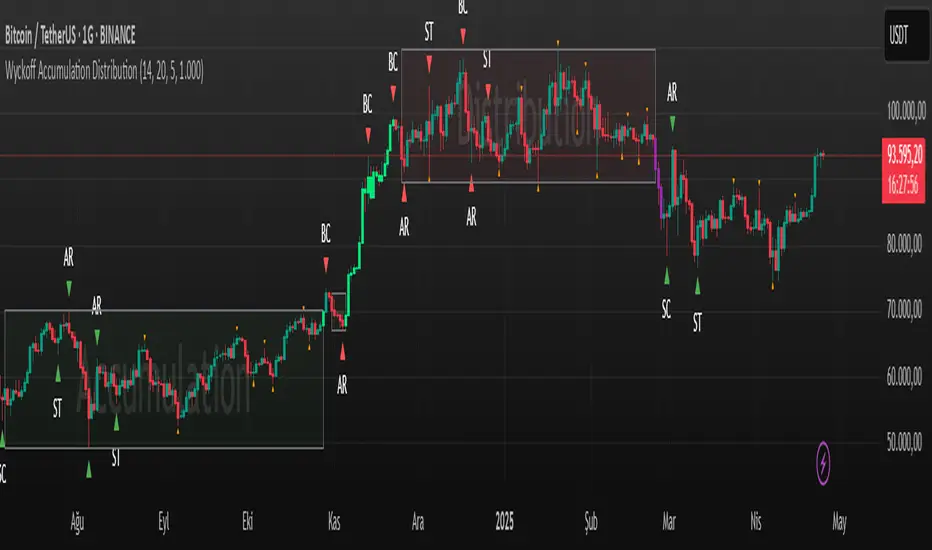
FVG Radar [Mr_Rakun]The FVG Radar indicator is designed to automatically detect Fair Value Gaps (FVG) on your TradingView chart. It visually highlights bullish and bearish gaps with colored boxes and provides alerts when specific conditions are met.
How It Works
Fair Value Gap (FVG) Detection:
The script identifies gaps based on previous price action. A bullish FVG is recognized when there is a gap below a higher low candle, and a bearish FVG when there is a gap above a lower high candle.
Radar Area:
A yellow “Radar Area” box is drawn on the chart using upper and lower bands defined as a percentage above and below the current price. This area helps you visualize where the price is relative to these bands.
Alerts:
Alerts are triggered based on user-defined conditions:
When price crosses half of the gap (if the "Clear FVG When Price Reaches Half" option is enabled).
When price fully fills the gap (if the option is disabled).
The alert will only be activated after waiting a specified number of bars post-gap formation (as set by the "Wait X Bars After FVG Formation" parameter).
Input Parameters
Radar Upper Band (%):
Sets the upper threshold percentage relative to the current price for the radar area.
Radar Lower Band (%):
Sets the lower threshold percentage relative to the current price for the radar area.
Minimum FVG Size (%):
Determines the minimum size (as a percentage) for a gap to be recognized as a valid FVG.
Clear FVG When Price Reaches Half:
If enabled, the FVG will be cleared when the price reaches the midpoint of the gap. If disabled, the entire gap must be filled before it is cleared.
Wait X Bars After FVG Formation:
Specifies the number of bars to wait after an FVG is detected before triggering an alert. This delay helps to avoid premature alerts.
Bullish and Bearish FVG Colors and Opacity:
Customize the appearance of the FVG boxes for bullish (green) and bearish (red) gaps, including the opacity of these visual elements.
How to Use
Add the Indicator:
Load the FVG Radar indicator on your TradingView chart.
Customize Settings:
Adjust the input parameters based on your trading style and the market’s volatility. The radar area settings help you set your own visual reference for price deviations.
Monitor the Chart:
Watch for the colored boxes that represent FVGs. The boxes will display the size of the gap as a percentage.
Respond to Alerts:
When an alert is triggered after the specified number of bars, it indicates that the price has interacted with the gap. Use this information to guide your trading decisions.
Türkçe --------------------------------------------
FVG Radar göstergesi, TradingView grafiğinizde Fair Value Gap (FVG) – yani adil değer boşluklarını – otomatik olarak tespit etmek için tasarlanmıştır. Bu boşluklar, yükseliş ve düşüş boşluklarını farklı renkli kutularla vurgular ve belirli koşullar sağlandığında uyarılar verir.
Nasıl Çalışır
Fair Value Gap (FVG) Tespiti:
Gösterge, önceki fiyat hareketlerine dayalı olarak boşlukları belirler. Yükseliş boşluğu, düşük seviyenin yukarıdaki mumun altındaki boşlukla oluştuğu durumlarda; düşüş boşluğu ise, yüksek seviyenin aşağıdaki mumun üstünde boşluk oluştuğunda tespit edilir.
Radar Alanı:
Grafikte, mevcut fiyata göre belirlenen üst ve alt yüzde bantlarına dayalı olarak sarı renkte “Radar Alanı” kutusu çizilir. Bu alan, fiyatın bu bantlara göre nerede olduğunu görsel olarak anlamanıza yardımcı olur.
Uyarılar:
Kullanıcının belirlediği koşullara göre uyarılar verilir:
Fiyat, boşluğun yarısına ulaştığında (eğer "FVG'nin yarısına ulaştığında temizle" seçeneği etkinse).
Fiyat boşluğu tamamen doldurduğunda (seçenek devre dışı bırakıldığında).
Uyarı, boşluk oluşumundan sonra belirlenen bar sayısı kadar bekledikten sonra tetiklenir ("FVG Oluşumundan Sonra X Bar Bekle" parametresi).
Giriş Parametreleri
Radar Upper Band (%):
Mevcut fiyata göre radar alanı için üst eşik yüzdesini ayarlar.
Radar Lower Band (%):
Mevcut fiyata göre radar alanı için alt eşik yüzdesini ayarlar.
Minimum FVG Size (%):
Bir boşluğun geçerli bir FVG olarak tanınabilmesi için gereken minimum boyutu (yüzde olarak) belirler.
FVG'nin yarısına ulaştığında temizle:
Etkinse, fiyat boşluğun orta noktasına ulaştığında boşluk temizlenir. Devre dışı bırakılırsa, boşluğun tamamen doldurulması gerekir.
FVG Oluşumundan Sonra X Bar Bekle:
Bir FVG tespit edildikten sonra uyarı tetiklenmeden önce beklenmesi gereken bar sayısını belirler. Bu gecikme, erken uyarıların önüne geçmeyi amaçlar.
Yükseliş ve Düşüş FVG Renkleri ve Opaklık:
Yükseliş boşlukları (yeşil) ve düşüş boşlukları (kırmızı) için kutuların görünümünü ve opaklığını özelleştirmenize olanak tanır.
Nasıl Kullanılır
Göstergeyi Ekleyin:
FVG Radar göstergesini TradingView grafiğinize ekleyin.
Ayarları Özelleştirin:
Ticaret tarzınıza ve piyasanın oynaklığına göre giriş parametrelerini ayarlayın. Radar alanı ayarları, fiyat sapmalarını kendi görsel referansınızla tanımlamanıza yardımcı olur.
Grafiği İzleyin:
FVG’leri temsil eden renkli kutuları takip edin. Kutular, boşluğun yüzdelik büyüklüğünü gösterecektir.
Uyarılara Tepki Verin:
Belirlenen bar sayısı sonrasında tetiklenen uyarı, fiyatın boşluk ile etkileşime girdiğini gösterir. Bu bilgiyi, ticaret kararlarınızı yönlendirmek için kullanın.

Auto Wyckoff Schematic [by DanielM]This indicator is designed to automatically detect essential components of Wyckoff schematics. This tool aims to capture the critical phases of liquidity transfer from weak to strong hands, occurring before a trend reversal. While the Wyckoff method is a comprehensive and a very nuanced approach, every Wyckoff schematic is unique, making it impractical to implement all its components without undermining the detection of the pattern. Consequently, this script focuses on the essential elements critical to identifying these schematics effectively.
Key Features:
Swing Detection Sensitivity:
The sensitivity of swing detection is adjustable through the input parameter. This parameter controls the number of past bars analyzed to determine swing highs and lows, allowing users to fine-tune detection based on market volatility and timeframes.
Pattern Detection Logic:
Accumulation Schematic:
Detects consecutive lower swing lows, representing phases like Selling Climax (SC) and Spring, which often precede a trend reversal upward. After the final low is identified, a higher high is detected to confirm the upward trend initiation.
Labeled Key Points:
SC: Selling Climax, marking the beginning of the accumulation zone.
ST: Secondary Test during the schematic.
ST(b): Secondary Test in phase B.
Spring: The lowest point in the schematic, signaling a final liquidity grab.
SOS: Sign of Strength, confirming a bullish breakout.
The schematic is outlined visually with a rectangle to highlight the price range.
Distribution Schematic:
Detects consecutive higher swing highs, which indicate phases such as Buying Climax (BC) and UTAD, often leading to a bearish reversal. After the final high, a lower low is detected to confirm the downward trend initiation.
Labeled Key Points:
BC: Buying Climax, marking the beginning of the distribution zone.
ST: Secondary Test during the schematic.
UT: Upthrust.
UTAD: Upthrust After Distribution, signaling the final upward liquidity grab before a bearish trend.
SOW: Sign of Weakness, confirming a bearish breakout.
The schematic is visually outlined with a rectangle to highlight the price range.
Notes:
Simplification for Practicality: Due to the inherent complexity and variability of Wyckoff schematics, the indicator focuses only on the most essential features—liquidity transfer and key reversal signals.
Limitations: The tool does not account for all components of Wyckoff's method (e.g., minor phases or nuanced volume analysis) to maintain clarity and usability.
Unique Behavior: Every Wyckoff schematic is different, and this tool is designed to provide a simplified, generalized approach to detecting these unique patterns.

AIR Supertrend (Average Interpercentile Range)Supertrend (ST) is a popular stop loss and trend identification script. The simplicity of seeing a clean trend on a chart makes it attractive, yet it is restricted by only allowing the source, length and multiplier to be adjusted, & these tend to have a limited effect on the properties of the identified trend.
There is a wide variety of interesting ST scripts on TradingView that give the user more control, but none to my knowledge, based on measuring the statistical dispersion of Average Interpercentile Range (AIR).
Two more levels of control:
Normally, ATR Average True Range is used to calculate the range in ST. ATR is initially calculated using RMA to smooth out True Range. This script gives the user the option of changing the MA to some more interesting varieties & modifying their parameters.
The default range setting when you load the indicator on a chart will be AIR.
The real strength of the indicator, however, and the reason I am publishing it, is to release AIR. Play round with the percentile range setting. Lowering it will allow you to stay longer in a trade in a volatile market. Raising it will make it tighter.
For comparison, you can switch back the range setting to ATR and load up RMA to see how the original, classic ST plots.
Alerts are included in this version. Alway use a stop loss.
DISCLAIMER: None of this is financial advice.
Credits to these authors, whose hard work inspired parts of this script:
@ KivancOzbilgic - SuperTrend
@ KioseffTrading - Tillson T3 MA
@ cheatcountry - Hann Window Smoothing
@ mutantdog - Interquartile Range function in his 'Blaze' script

New Highs-New-Lows on US Stock Market - Main Chart Edition#### ENGLISH ####
This script visualizes divergences between the price and new highs and new lows in the US stock market. The indicator should be used exclusively on the US stock indices (timeframe >= D).
This is the indicator for the main chart. It should be used together with the subchart indicator of the same name. In order to get the same results between the main and subchart editions, the indicator settings must be manually adjusted equally in both charts.
The approach:
Let's take a bull market as an example. A bull market is characterized by rising highs and rising lows. We can therefore assume that with the rising prices, the number of stocks that form new highs also rises or at least remains constant. This confirms the upward trend and thus expresses that it is supported by the broad stock market. If the market forms new highs and the number of stocks forming new highs decreases at the same moment, these new index highs are no longer supported by the broad stock market but exclusively by a few highly capitalized stocks. This creates a bearish divergence between the index and the NHNL indicator. This means that the uptrend tends to be overheated and a correction becomes more likely. Stops should be drawn closer.
The approach applies conversely, of course, to downtrends as well.
The indicator itself:
The number of new highs and lows (NHNL) are determined using the data sources included in Tradingview, such as "INDEX:HIGN" for NYSE highs. This data is provided on a daily basis. For higher time units (week, month) the daily numbers are shown summed up and not only the Friday value like most other NHNL indicators.
The signal strength is determined on the basis of two factors. The stronger the signal, the clearer (less transparent) the line/arrow. The two factors are on the one hand the strength of the divergence in and of itself, and on the other hand the strength of the overriding trend. The trend strength is determined using a 50 EMA on the NHNL indicator.
To avoid displaying every small divergence and to reduce false signals, the threshold for the signal strength can be set in the indicator settings.
#### GERMAN #####
Dieses script visualisiert Divergenzen zwischen dem Preis und neuer Hochs sowie neuer Tiefs im US Aktienmarkt. Der Indikator sollte ausschließlich auf den US Aktienindizes verwendet werden (Timeframe >= D).
Dies ist der Indikator für den Hauptchart. Er sollte zusammen mit dem gleichnamigen Subchart Indikator verwendet werden. Um gleiche Ergebnisse zwischen Haupt- und Subchart Edition zu erhalten, müssen die Indikatoreistellung manuell in beiden Charts gleichermaßen eigestellt werden.
Der Ansatz:
Nehmen wir uns als Beispiel einen Bullenmarkt. Ein Bullenmarkt zeichnet sich durch steigende Hochs und steigende Tiefs aus. Man kann also annehmen, dass mit den steigenden Preisen auch die Anzahl der Aktien die neuen Hochs ausbilden steigt oder zumindest konstant bleibt. Dies bestätigt den Aufwärtstrend und drückt somit aus, dass dieser vom breiten Aktienmarkt mitgetragen wird. Wenn der Markt neue Hochs bildet und die Anzahl der Aktien, die neue Hochs bilden im selben Moment sinkt, so werden diese neuen Indexhochs vom breiten Aktienmarkt nicht mehr getragen sonder ausschließlich von wenigen hochkapitalisierten Aktien. Es entsteht eine bärische Divergenz zwischen Index und dem NHNL Indikator. Das bedeutet, dass der Aufwärtstrend tendenziell überhitzt ist und ein Korrektur wahrscheinlicher wird. Die Stops sollten näher herangezogen werden.
Der Ansatz gilt umgekehrt natürlich auch bei Abwärtstrends.
Der Indikator an sich:
Die Anzahl der neuen Hochs und Tiefs (NHNL) werden anhand der in Tradingview enthaltenen Datenquellen wie z.B. "INDEX:HIGN" für die NYSE Hochs ermittelt. Diese Daten werden auf Tagesbasis bereitgestellt. Für höher Zeiteinheiten (Woche, Monat) werden die Tageszahlen aufsummiert dargestellt und nicht wie bei den meisten anderen NHNL Indikatoren nur der Freitagswert.
Die Signalstärke wird Anhand zweier Faktoren ermittelt. Je stärker das Signal um so deutlicher (weniger transparent) die Linie/der Pfeil. Die zwei Faktoren sind zum einen die stärke der Divergenz an und für sich, sowie zum anderen die Stärke des übergeordneten Trends. Die Trendstärke wird anhand eines 50er-EMA auf den NHNL-Indikator ermittelt.
Um nicht jede kleine Divergenz anzuzeigen und um Fehlsignale zu reduzieren, kann die Schwelle für die Signalstärke in den Indikatoreinstellungen festgelegt werden.
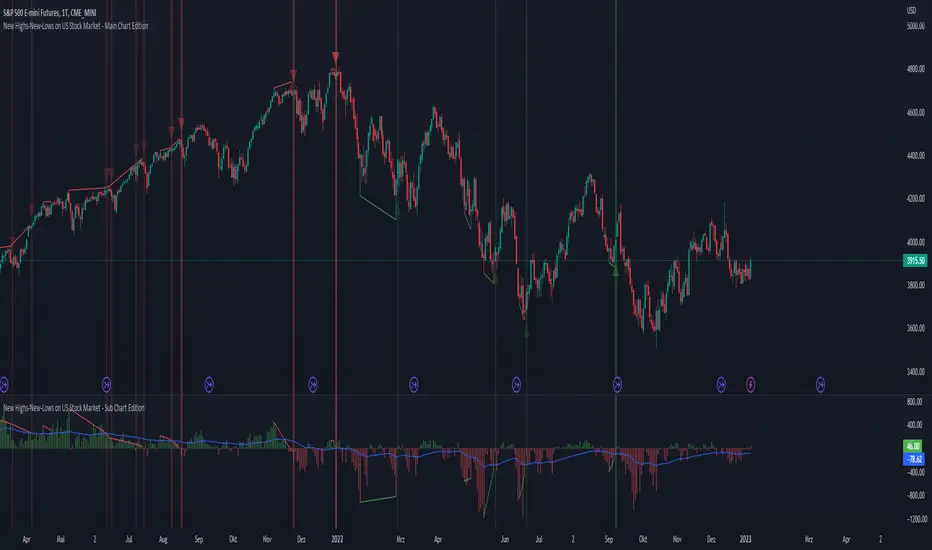
New Highs-New-Lows on US Stock Market - Sub Chart Edition#### ENGLISH ####
This script visualizes divergences between the price and new highs and new lows in the US stock market. The indicator should be used exclusively on the US stock indices (timeframe >= D).
This is the indicator for the sub chart. It should be used together with the main chart indicator of the same name. In order to get the same results between the main and subchart editions, the indicator settings must be manually adjusted equally in both charts.
The approach:
Let's take a bull market as an example. A bull market is characterized by rising highs and rising lows. We can therefore assume that with the rising prices, the number of stocks that form new highs also rises or at least remains constant. This confirms the upward trend and thus expresses that it is supported by the broad stock market. If the market forms new highs and the number of stocks forming new highs decreases at the same moment, these new index highs are no longer supported by the broad stock market but exclusively by a few highly capitalized stocks. This creates a bearish divergence between the index and the NHNL indicator. This means that the uptrend tends to be overheated and a correction becomes more likely. Stops should be drawn closer.
The approach applies conversely, of course, to downtrends as well.
The indicator itself:
The number of new highs and lows (NHNL) are determined using the data sources included in Tradingview, such as "INDEX:HIGN" for NYSE highs. This data is provided on a daily basis. For higher time units (week, month) the daily numbers are shown summed up and not only the Friday value like most other NHNL indicators.
The signal strength is determined on the basis of two factors. The stronger the signal, the clearer (less transparent) the line/arrow. The two factors are on the one hand the strength of the divergence in and of itself, and on the other hand the strength of the overriding trend. The trend strength is determined using a 50 EMA on the NHNL indicator.
To avoid displaying every small divergence and to reduce false signals, the threshold for the signal strength can be set in the indicator settings.
#### GERMAN #####
Dieses script visualisiert Divergenzen zwischen dem Preis und neuer Hochs sowie neuer Tiefs im US Aktienmarkt. Der Indikator sollte ausschließlich auf den US Aktienindizes verwendet werden (Timeframe >= D).
Dies ist der Indikator für den Subchart. Er sollte zusammen mit dem gleichnamigen Hauptchart Indikator verwendet werden. Um gleiche Ergebnisse zwischen Haupt- und Subchart Edition zu erhalten, müssen die Indikatoreistellung manuell in beiden Charts gleichermaßen eigestellt werden.
Der Ansatz:
Nehmen wir uns als Beispiel einen Bullenmarkt. Ein Bullenmarkt zeichnet sich durch steigende Hochs und steigende Tiefs aus. Man kann also annehmen, dass mit den steigenden Preisen auch die Anzahl der Aktien die neuen Hochs ausbilden steigt oder zumindest konstant bleibt. Dies bestätigt den Aufwärtstrend und drückt somit aus, dass dieser vom breiten Aktienmarkt mitgetragen wird. Wenn der Markt neue Hochs bildet und die Anzahl der Aktien, die neue Hochs bilden im selben Moment sinkt, so werden diese neuen Indexhochs vom breiten Aktienmarkt nicht mehr getragen sonder ausschließlich von wenigen hochkapitalisierten Aktien. Es entsteht eine bärische Divergenz zwischen Index und dem NHNL Indikator. Das bedeutet, dass der Aufwärtstrend tendenziell überhitzt ist und ein Korrektur wahrscheinlicher wird. Die Stops sollten näher herangezogen werden.
Der Ansatz gilt umgekehrt natürlich auch bei Abwärtstrends.
Der Indikator an sich:
Die Anzahl der neuen Hochs und Tiefs (NHNL) werden anhand der in Tradingview enthaltenen Datenquellen wie z.B. "INDEX:HIGN" für die NYSE Hochs ermittelt. Diese Daten werden auf Tagesbasis bereitgestellt. Für höher Zeiteinheiten (Woche, Monat) werden die Tageszahlen aufsummiert dargestellt und nicht wie bei den meisten anderen NHNL Indikatoren nur der Freitagswert.
Die Signalstärke wird Anhand zweier Faktoren ermittelt. Je stärker das Signal um so deutlicher (weniger transparent) die Linie/der Pfeil. Die zwei Faktoren sind zum einen die stärke der Divergenz an und für sich, sowie zum anderen die Stärke des übergeordneten Trends. Die Trendstärke wird anhand eines 50er-EMA auf den NHNL-Indikator ermittelt.
Um nicht jede kleine Divergenz anzuzeigen und um Fehlsignale zu reduzieren, kann die Schwelle für die Signalstärke in den Indikatoreinstellungen festgelegt werden.

Multi-Timeframe (MTF) Dashboard by RiTzMulti-Timeframe Dashboard
Shows values of different Indiactors on Multiple-Timeframes for the selected script/symbol
VWAP : if LTP is trading above VWAP then Bullish else if LTP is trading below VWAP then Bearish.
ST(21,1) : if LTP is trading above Supertrend (21,1) then Bullish , else if LTP is trading below Supertrend (21,1) then Bearish.
ST(14,2) : if LTP is trading above Supertrend (14,2) then Bullish , else if LTP is trading below Supertrend (14,2) then Bearish.
ST(10,3) : if LTP is trading above Supertrend (10,3) then Bullish , else if LTP is trading below Supertrend (10,3) then Bearish.
RSI(14) : Shows value of RSI (14) for the current timeframe.
ADX : if ADX is > 75 and DI+ > DI- then "Bullish ++".
if ADX is < 75 but >50 and DI+ > DI- then "Bullish +".
if ADX is < 50 but > 25 and DI+ > DI- then "Bullish".
if ADX is above 75 and DI- > DI+ then "Bearish ++".
if ADX is < 75 but > 50 and DI- > DI+ then "Bearish+".
if ADX is < 50 but > 25 and DI- > DI+ then "Bearish".
if ADX is < 25 then "Neutral".
MACD : if MACD line is above Signal Line then "Bullish", else if MACD line is below Signal Line then "Bearish".
PH-PL : "< PH > PL" means LTP is trading between Previous Timeframes High(PH) & Previous Timeframes Low(PL) which indicates Rangebound-ness.
"> PH" means LTP is trading above Previous Timeframes High(PH) which indicates Bullish-ness.
"< PL" means LTP is trading below Previous Timeframes Low(PL) which indicates Bearish-ness.
Alligator : If Lips > Teeth > Jaw then Bullish.
If Lips < Teeth < Jaw then Bearish.
If Lips > Teeth and Teeth < Jaw then Neutral/Sleeping.
If Lips < Teeth and Teeth > Jaw then Neutral/Sleeping.
Settings :
Style settings :-
Dashboard Location: Location of the dashboard on the chart
Dashboard Size: Size of the dashboard on the chart
Bullish Cell Color: Select the color of cell whose value is showing Bullish-ness.
Bearish Cell Color: Select the color of cell whose value is showing Bearish-ness.
Neutral Cell Color: Select the color of cell whose value is showing Rangebound-ness.
Cell Transparency: Select Transparency of cell.
Column Settings :-
You can select which Indicators values should be displayed/hidden.
Timeframe Settings :-
You can select which timeframes values should be displayed/hidden.
Note :- I'm not a pro Developer/Coder , so if there are any mistakes or any suggestions for improvements in the code then do let me know!
Note :- Use in Live market , might show wrong values for timeframes other than current timeframe in closed market!!

Nifty / Banknifty Dashboard by RiTzNifty / Banknifty Dashboard :
Shows Values of different Indicators on current Timeframe for the selected Index & it's main constituents according to weightage in index.
customized for Nifty & Banknifty (You can customize it according to your needs for the markets/indexes you trade in)
Interpretation :-
VWAP : if LTP is trading above VWAP then Bullish else if LTP is trading below VWAP then Bearish.
ST(21,1) : if LTP is trading above Supertrend (21,1) then Bullish , else if LTP is trading below Supertrend (21,1) then Bearish.
ST(14,2) : if LTP is trading above Supertrend (14,2) then Bullish , else if LTP is trading below Supertrend (14,2) then Bearish.
ST(10,3) : if LTP is trading above Supertrend (10,3) then Bullish , else if LTP is trading below Supertrend (10,3) then Bearish.
RSI(14) : Shows value of RSI (14) for the current timeframe.
ADX : if ADX is > 75 and DI+ > DI- then "Bullish ++".
if ADX is < 75 but >50 and DI+ > DI- then "Bullish +".
if ADX is < 50 but > 25 and DI+ > DI- then "Bullish".
if ADX is above 75 and DI- > DI+ then "Bearish ++".
if ADX is < 75 but > 50 and DI- > DI+ then "Bearish+".
if ADX is < 50 but > 25 and DI- > DI+ then "Bearish".
if ADX is < 25 then "Neutral".
MACD : if MACD line is above Signal Line then "Bullish", else if MACD line is below Signal Line then "Bearish".
PDH-PDL : "< PDH > PDL" means LTP is trading between Previous Days High(PDH) & Previous Days Low(PDL) which indicates Rangebound-ness.
"> PDH" means LTP is trading above Previous Days High(PDH) which indicates Bullish-ness.
"< PDL" means LTP is trading below Previous Days Low(PDL) which indicates Bearish-ness.
Alligator : If Lips > Teeth > Jaw then Bullish.
If Lips < Teeth < Jaw then Bearish.
If Lips > Teeth and Teeth < Jaw then Neutral/Sleeping.
If Lips < Teeth and Teeth > Jaw then Neutral/Sleeping.
Settings :
Style settings :-
Dashboard Location: Location of the dashboard on the chart
Dashboard Size: Size of the dashboard on the chart
Bullish Cell Color: Select the color of cell whose value is showing Bullish-ness.
Bearish Cell Color: Select the color of cell whose value is showing Bearish-ness.
Neutral Cell Color: Select the color of cell whose value is showing Rangebound-ness.
Cell Transparency: Select Transparency of cell.
Columns Settings :-
You can select which Indicators values should be displayed/hidden.
Rows Settings :-
You can select which Stocks/Symbols values should be displayed/hidden.
Symbol Settings :-
Here you can select the Index & Stocks/Symbols
Dashboard for Index : select Nifty/Banknifty
if you select Nifty then Nifty spot, Nifty current Futures and the stocks with most weightage in Nifty index will be displayed on the Dashboard/Table.
if you select Banknifty then Banknifty spot, Banknifty current Futures and the stocks with most weightage in Banknifty index will be displayed on the Dashboard/Table.
You can Customise it according to your needs, you can choose any Symbols you want to use.
Note :- This is inspired from "RankDelta" by AsitPati and "Nifty and Bank Nifty Dashboard v2" by cvsk123 (Both these scripts are closed source!)
I'm not a pro Developer/Coder , so if there are any mistakes or any suggestions for improvements in the code then do let me know!

bytimeLibrary "bytime"
TODO: to do something at the specified time.
////Return =>> ht = hour , mt = minute , st = second ,Dt = Day, Mt = month, Yt = year , dateTime = full time format./////////////
Note : Remember to always add import when you call our library and change Gtime() to Timeset.Gtime() is used to access internal data.
import hapharmonic/bytime/1 as Timeset
=Timeset.Gtime()
/////////////Set a time to trigger an alert./////////////
ck = false
///hour : minute : second
if ht == TH and mt == TM and st == TS
//some action
//...
//.
ck := true
Gtime()