Adaptive Regression Channel [MissouriTim]The Adaptive Regression Channel (ARC) is a technical indicator designed to empower traders with a clear, adaptable, and precise view of market trends and price boundaries. By blending advanced statistical techniques with real-time market data, ARC delivers a comprehensive tool that dynamically adjusts to price action, volatility, volume, and momentum. Whether you’re navigating the fast-paced world of cryptocurrencies, the steady trends of stocks, or the intricate movements of FOREX pairs, ARC provides a robust framework for identifying opportunities and managing risk.
Core Components
1. Color-Coded Regression Line
ARC’s centerpiece is a linear regression line derived from a Weighted Moving Average (WMA) of closing prices. This line adapts its calculation period based on market volatility (via ATR) and is capped between a minimum of 20 bars and a maximum of 1.5 times the user-defined base length (default 100). Visually, it shifts colors to reflect trend direction: green for an upward slope (bullish) and red for a downward slope (bearish), offering an instant snapshot of market sentiment.
2. Dynamic Residual Channels
Surrounding the regression line are upper (red) and lower (green) channels, calculated using the standard deviation of residuals—the difference between actual closing prices and the regression line. This approach ensures the channels precisely track how closely prices follow the trend, rather than relying solely on overall price volatility. The channel width is dynamically adjusted by a multiplier that factors in:
Volatility: Measured through the Average True Range (ATR), widening channels during turbulent markets.
Trend Strength: Based on the regression slope, expanding channels in strong trends and contracting them in consolidation phases.
3. Volume-Weighted Moving Average (VWMA)
Plotted in orange, the VWMA overlays a volume-weighted price trend, emphasizing movements backed by significant trading activity. This complements the regression line, providing additional confirmation of trend validity and potential breakout strength.
4. Scaled RSI Overlay
ARC features a Relative Strength Index (RSI) overlay, plotted in purple and scaled to hover closely around the regression line. This compact display reflects momentum shifts within the trend’s context, keeping RSI visible on the price chart without excessive swings. User-defined overbought (default 70) and oversold (default 30) levels offer reference points for momentum analysis."
Technical Highlights
ARC leverages a volatility-adjusted lookback period, residual-based channel construction, and multi-indicator integration to achieve high accuracy. Its parameters—such as base length, channel width, ATR period, and RSI length—are fully customizable, allowing traders to tailor it to their specific needs.
Why Choose ARC?
ARC stands out for its adaptability and precision. The residual-based channels offer tighter, more relevant support and resistance levels compared to standard volatility measures, while the dynamic adjustments ensure it performs well in both trending and ranging markets. The inclusion of VWMA and scaled RSI adds depth, merging trend, volume, and momentum into a single, cohesive overlay. For traders seeking a versatile, all-in-one indicator, ARC delivers actionable insights with minimal noise.
Best Ways to Use the Adaptive Regression Channel (ARC)
The Adaptive Regression Channel (ARC) is a flexible tool that supports a variety of trading strategies, from trend-following to breakout detection. Below are the most effective ways to use ARC, along with practical tips for maximizing its potential. Adjustments to its settings may be necessary depending on the timeframe (e.g., intraday vs. daily) and the asset being traded (e.g., stocks, FOREX, cryptocurrencies), as each market exhibits unique volatility and behavior.
1. Trend Following
• How to Use: Rely on the regression line’s color to guide your trades. A green line (upward slope) signals a bullish trend—consider entering or holding long positions. A red line (downward slope) indicates a bearish trend—look to short or exit longs.
• Best Practice: Confirm the trend with the VWMA (orange line). Price above the VWMA in a green uptrend strengthens the bullish case; price below in a red downtrend reinforces bearish momentum.
• Adjustment: For short timeframes like 15-minute crypto charts, lower the Base Regression Length (e.g., to 50) for quicker trend detection. For weekly stock charts, increase it (e.g., to 200) to capture broader movements.
2. Channel-Based Trades
• How to Use: Use the upper channel (red) as resistance and the lower channel (green) as support. Buy when the price bounces off the lower channel in an uptrend, and sell or short when it rejects the upper channel in a downtrend.
• Best Practice: Check the scaled RSI (purple line) for momentum cues. A low RSI (e.g., near 30) at the lower channel suggests a stronger buy signal; a high RSI (e.g., near 70) at the upper channel supports a sell.
• Adjustment: In volatile crypto markets, widen the Base Channel Width Coefficient (e.g., to 2.5) to reduce false signals. For stable FOREX pairs (e.g., EUR/USD), a narrower width (e.g., 1.5) may work better.
3. Breakout Detection
• How to Use: Watch for price breaking above the upper channel (bullish breakout) or below the lower channel (bearish breakout). These moves often signal strong momentum shifts.
• Best Practice: Validate breakouts with VWMA position—price above VWMA for bullish breaks, below for bearish—and ensure the regression line’s slope aligns (green for up, red for down).
• Adjustment: For fast-moving assets like crypto on 1-hour charts, shorten ATR Length (e.g., to 7) to make channels more reactive. For stocks on daily charts, keep it at 14 or higher for reliability.
4. Momentum Analysis
• How to Use: The scaled RSI overlay shows momentum relative to the regression line. Rising RSI in a green uptrend confirms bullish strength; falling RSI in a red downtrend supports bearish pressure.
• Best Practice: Look for RSI divergences—e.g., price hitting new highs at the upper channel while RSI flattens or drops could signal an impending reversal.
• Adjustment: Reduce RSI Length (e.g., to 7) for intraday trading in FOREX or crypto to catch short-term momentum shifts. Increase it (e.g., to 21) for longer-term stock trades.
5. Range Trading
• How to Use: When the regression line’s slope is near zero (flat) and channels are tight, ARC indicates a ranging market. Buy near the lower channel and sell near the upper channel, targeting the regression line as the mean price.
• Best Practice: Ensure VWMA hovers close to the regression line to confirm the range-bound state.
• Adjustment: For low-volatility stocks on daily charts, use a moderate Base Regression Length (e.g., 100) and tight Base Channel Width (e.g., 1.5). For choppy crypto markets, test shorter settings.
Optimization Strategies
• Timeframe Customization: Adjust ARC’s parameters to match your trading horizon. Short timeframes (e.g., 1-minute to 1-hour) benefit from lower Base Regression Length (20–50) and ATR Length (7–10) for agility, while longer timeframes (e.g., daily, weekly) favor higher values (100–200 and 14–21) for stability.
• Asset-Specific Tuning:
○ Stocks: Use longer lengths (e.g., 100–200) and moderate widths (e.g., 1.8) for stable equities; tweak ATR Length based on sector volatility (shorter for tech, longer for utilities).
○ FOREX: Set Base Regression Length to 50–100 and Base Channel Width to 1.5–2.0 for smoother trends; adjust RSI Length (e.g., 10–14) based on pair volatility.
○ Crypto: Opt for shorter lengths (e.g., 20–50) and wider widths (e.g., 2.0–3.0) to handle rapid price swings; use a shorter ATR Length (e.g., 7) for quick adaptation.
• Backtesting: Test ARC on historical data for your asset and timeframe to optimize settings. Evaluate how often price respects channels and whether breakouts yield profitable trades.
• Enhancements: Pair ARC with volume surges, key support/resistance levels, or candlestick patterns (e.g., doji at channel edges) for higher-probability setups.
Practical Considerations
ARC’s adaptability makes it suitable for diverse markets, but its performance hinges on proper calibration. Cryptocurrencies, with their high volatility, may require shorter, wider settings to capture rapid moves, while stocks on longer timeframes benefit from broader, smoother configurations. FOREX pairs often fall in between, depending on their inherent volatility. Experiment with the adjustable parameters to align ARC with your trading style and market conditions, ensuring it delivers the precision and reliability you need.
在腳本中搜尋"黄金近50年的走势"

Momentum Volume Divergence (MVD) EnhancedMomentum Volume Divergence (MVD) Enhanced is a powerful indicator that detects price-momentum divergences and momentum suppression for reversal trading. Optimized for XRP on 1D charts, it features dynamic lookbacks, ATR-adjusted thresholds, and SMA confirmation. Signals include strong divergences (triangles) and suppression warnings (crosses). Includes a detailed user guide—try it out and share your feedback!
Setup: Add to XRP 1D chart with defaults (mom_length_base=8, vol_length_base=10). Signals: Red triangle (sell), Green triangle (buy), Orange cross (bear warning), Yellow cross (bull warning). Confirm with 5-day SMA crossovers. See full guide for details!
Disclaimer: This indicator is for educational purposes only, not financial advice. Trading involves risk—use at your discretion.
Momentum Volume Divergence (MVD) Enhanced Indicator User Guide
Version: Pine Script v6
Designed for: TradingView
Recommended Use: XRP on 1-day (1D) chart
Date: March 18, 2025
Author: Herschel with assistance from Grok 3 (xAI)
Overview
The Momentum Volume Divergence (MVD) Enhanced indicator is a powerful tool for identifying price-momentum divergences and momentum suppression patterns on XRP’s 1-day (1D) chart. Plotted below the price chart, it provides clear visual signals to help traders spot potential reversals and trend shifts.
Purpose
Detect divergences between price and momentum for buy/sell opportunities.
Highlight momentum suppression as warnings of fading trends.
Offer actionable trading signals with intuitive markers.
Indicator Components
Main Plot
Volume-Weighted Momentum (vw_mom): Blue line showing momentum adjusted by volume.
Above 0 = bullish momentum.
Below 0 = bearish momentum.
Zero Line: Gray dashed line at 0, separating bullish/bearish zones.
Key Signals
Strong Bearish Divergence:
Marker: Red triangle at the top.
Meaning: Price makes a higher high, but momentum weakens, confirmed by a drop below the 5-day SMA.
Action: Potential sell/short signal.
Strong Bullish Divergence:
Marker: Green triangle at the bottom.
Meaning: Price makes a lower low, but momentum strengthens, confirmed by a rise above the 5-day SMA.
Action: Potential buy/long signal.
Bearish Suppression:
Marker: Orange cross at the top + red background.
Meaning: Strong bullish momentum with low volume in a volume downtrend, suggesting fading strength.
Action: Warning to avoid longs or exit early.
Bullish Suppression:
Marker: Yellow cross at the bottom + green background.
Meaning: Strong bearish momentum with low volume in a volume uptrend, suggesting fading weakness.
Action: Warning to avoid shorts or exit early.
Debug Plots (Optional)
Volume Ratio: Gray line (volume vs. its MA) vs. yellow line (threshold).
Momentum Threshold: Purple lines (positive/negative momentum cutoffs).
Smoothed Momentum: Orange line (raw momentum).
Confirmation SMA: Purple line (price trend confirmation).
Labels
Text labels (e.g., "Bear Div," "Bull Supp") mark detected patterns.
How to Use the Indicator
Step-by-Step Trading Process
1. Monitor the Chart
Load your XRP 1D chart with the indicator applied.
Observe the blue vw_mom line and signal markers.
2. Spot a Signal
Primary Signals: Look for red triangles (strong_bear) or green triangles (strong_bull).
Warnings: Note orange crosses (suppression_bear) or yellow crosses (suppression_bull).
3. Confirm the Signal
For Strong Bullish Divergence (Buy):
Green triangle appears.
Price closes above the 5-day SMA (purple line) and a recent swing high.
Optional: Volume ratio (gray line) exceeds the threshold (yellow line).
For Strong Bearish Divergence (Sell):
Red triangle appears.
Price closes below the 5-day SMA and a recent swing low.
Optional: Volume ratio (gray line) falls below the threshold (yellow line).
4. Enter the Trade
Long:
Buy at the close of the signal bar.
Stop loss: Below the recent swing low or 2 × ATR(14) below entry.
Short:
Sell/short at the close of the signal bar.
Stop loss: Above the recent swing high or 2 × ATR(14) above entry.
5. Manage the Trade
Take Profit:
Aim for a 2:1 or 3:1 risk-reward ratio (e.g., risk $0.05, target $0.10-$0.15).
Or exit when an opposite suppression signal appears (e.g., orange cross for longs).
Trailing Stop:
Move stop to breakeven after a 1:1 RR move.
Trail using the 5-day SMA or 2 × ATR(14).
Early Exit:
Exit if a suppression signal appears against your position (e.g., suppression_bull while short).
6. Filter Out Noise
Avoid trades if a suppression signal precedes a divergence within 2-3 days.
Optional: Add a 50-day SMA on the price chart:
Longs only if price > 50-SMA.
Shorts only if price < 50-SMA.
Example Trades (XRP 1D)
Bullish Trade
Signal: Green triangle (strong_bull) at $0.55.
Confirmation: Price closes above 5-SMA and $0.57 high.
Entry: Buy at $0.58.
Stop Loss: $0.53 (recent low).
Take Profit: $0.63 (2:1 RR) or exit on suppression_bear.
Outcome: Price hits $0.64, exit at $0.63 for profit.
Bearish Trade
Signal: Red triangle (strong_bear) at $0.70.
Confirmation: Price closes below 5-SMA and $0.68 low.
Entry: Short at $0.67.
Stop Loss: $0.71 (recent high).
Take Profit: $0.62 (2:1 RR) or exit on suppression_bull.
Outcome: Price drops to $0.61, exit at $0.62 for profit.
Tips for Success
Combine with Price Levels:
Use support/resistance zones (e.g., weekly pivots) to confirm entries.
Monitor Volume:
Rising volume (gray line above yellow) strengthens signals.
Adjust Sensitivity:
Too many signals? Increase div_strength_threshold to 0.7.
Too few signals? Decrease to 0.3.
Backtest:
Review 20-30 past signals on XRP 1D to assess performance.
Avoid Choppy Markets:
Skip signals during low volatility (tight price ranges).
Troubleshooting
No Signals:
Lower div_strength_threshold to 0.3 or mom_threshold_base to 0.2.
Check if XRP’s volatility is unusually low.
False Signals:
Increase sma_confirm_length to 7 or add a 50-SMA filter.
Indicator Not Loading:
Ensure the script compiles without errors.
Customization (Optional)
Change Colors: Edit color.* values (e.g., color.red to color.purple).
Add Alerts: Use TradingView’s alert menu for "Strong Bearish Divergence Confirmed," etc.
Test Other Assets: Experiment with BTC or ETH, adjusting inputs as needed.
Disclaimer
This indicator is for educational purposes only and not financial advice. Trading involves risk, and past performance does not guarantee future results. Use at your own discretion.
Setup: Use on XRP 1D with defaults (mom_length_base=8, vol_length_base=10). Signals: Red triangle (sell), Green triangle (buy), Orange cross (bear warning), Yellow cross (bull warning). Confirm with 5-day SMA cross. Stop: 2x ATR(14). Profit: 2:1 RR or suppression exit. Full guide available separately!

RSI with Trend LinesThe RSI with Trend Lines indicator is a tool designed to analyze the behavior of the Relative Strength Index (RSI) combined with dynamic trend lines. This indicator not only provides the standard RSI reading but also identifies pivot points on the RSI and draws bullish and bearish trend lines based on these points. It also includes customizable options for adjusting trend lines, displaying the RSI moving average, and highlighting key levels such as overbought, oversold, and the center line.
This indicator is ideal for finding and identifying clear trends in the RSI and taking advantage of market breakout or consolidation signals. It also includes a table with the POC value, which represents the price level at which the most trading activity has occurred, indicating the highest liquidity and highest trading volume.
Key Features:
1. Basic RSI:
• Calculates the RSI using a configurable period length (default 14).
• Colors the RSI based on its direction (green for rising, red for falling) and its position relative to the center line (50).
2. Key Levels:
• Displays overbought (70 and 80), oversold (20 and 30), and the center line (50) levels for easy visual interpretation.
3. RSI Moving Average:
• Enables and configures an RSI moving average (SMA, EMA, WMA, or ALMA) to smooth out fluctuations and detect clearer trends.
4. Dynamic Trend Lines:
• Identifies pivot points on the RSI and draws bullish and bearish trend lines.
• Trend lines can be extended into the future or limited to the visible range.
• Includes options to display broken lines (trends that are no longer valid) and customize the style (solid or dashed).
5. Pivot Points:
• Displays the high and low pivot points on the chart for a better understanding of trend changes.
6. Advanced Customization:
• Adjust the pivot point period.
• Control the number of pivot points to consider for trend lines.
• Customize the line thickness and style.
How to Use the Indicator:
1. RSI Interpretation:
• Overbought Zone (RSI > 70): Indicates that the asset may be overvalued and could correct downward.
• Oversold Zone (RSI < 30): Suggests that the asset may be undervalued and could rebound.
• Centerline Crossover (50): A cross above 50 indicates bullish strength, while a cross below suggests weakness.
2. Trend Lines:
• Bullish Lines: Drawn when the RSI forms ascending low pivot points. These lines represent dynamic support.
• Bearish Lines: These are drawn when the RSI forms descending high pivot points. These lines represent dynamic resistance.
• Broken Lines: When a trend line becomes invalid (the RSI breaks the line), they are displayed in a dotted style to highlight the breakout.
3. Possible Trading Signals:
• Buy: When the RSI breaks an upward downtrend line.
• Sell: When the RSI breaks a downward uptrend line.
• Trend Confirmation: When the RSI stays within a valid trend line, it suggests that the current trend is strong.
4. A chart with the POC value:
• The point of control is a price level at which the highest trading volume occurs in a given time period. It is a key component of the Volume Profile indicator, which displays volume by price.
• Use of the POC in trading:
• The POC is used to identify areas of high interest and liquidity for trading.
• The POC provides information about the equilibrium point where buyers and sellers are most evenly matched.
• Therefore, it can be considered a zone of interest, meaning it can act as support or resistance.

Modified RSIModified RSI (Round Number RSI)
Category: Oscillator / Momentum
Description
The Modified RSI (Round Number RSI) is an enhanced version of the classic Relative Strength Index (RSI), designed to provide clearer and more structured signals by rounding its values to whole numbers. This modification helps traders filter out noise, making trend analysis and overbought/oversold conditions easier to interpret.
Key Features:
✔ Rounded RSI Values – Instead of fluctuating with decimals, this RSI rounds values to whole numbers (e.g., 30, 50, 70) for clearer decision-making.
✔ Easier Signal Interpretation – Helps traders identify key RSI levels without distractions from small fluctuations.
✔ Customizable Lookback Period – Allows adjustment of RSI sensitivity to fit different trading strategies.
✔ Works on All Timeframes & Assets – Can be applied to stocks, forex, crypto, and futures.
How to Use It:
📌 Overbought & Oversold Levels:
RSI ≥ 70 → Market may be overbought (potential reversal or correction).
RSI ≤ 30 → Market may be oversold (potential buying opportunity).
📌 Trend Confirmation:
RSI staying above 50 signals bullish momentum.
RSI staying below 50 signals bearish momentum.
📌 Divergence Trading:
Price makes a new high, but RSI does not → Bearish Divergence (Possible Downtrend).
Price makes a new low, but RSI does not → Bullish Divergence (Possible Uptrend).
Best Used For:
📈 Day Traders & Swing Traders looking for simplified RSI signals.
📉 Trend Confirmation with moving averages or volume analysis.
⚡ Confluence Trading with support/resistance zones.
Why Use This Over Traditional RSI?
🔹 Removes unnecessary noise by rounding RSI values.
🔹 Helps traders focus on key levels (30, 50, 70).
🔹 Reduces decision fatigue for fast-paced trading.

JP225 Influence AnalyzerThis tool provides a way to assess how USDJPY and DJIA influence JP225, using standardization and linear regression for quantitative evaluation. It also detects deviations from the linear model and displays the results in a colored table.
Table Structure
Row 1: Current value of USDJPY and its change from the previous bar
Row 2: Current value of DJIA and its change from the previous bar
Row 3: Theoretical value of Nikkei 225 calculated using the least squares method from USDJPY
and DJIA, and its change from the previous bar
Row 4: Current value of the chart symbol (Nikkei 225) and its change from the previous bar
Background Color Meanings
A. Current Value Column (Column 2)
If USDJPY or DJIA significantly contributes to the change in the theoretical value of Nikkei 225, the cell turns blue (increase) or red (decrease). The threshold is 1.5.
If the current value of Nikkei 225 increases, it turns blue; if it decreases, it turns red.
B. Change Value Column (Column 3)
If there is a discrepancy between the change in the theoretical value and the actual change of Nikkei 225, the cell turns yellow (moderate discrepancy: threshold 20) or red (significant discrepancy: threshold 50).
Judgment Based on Current Value Column (Column 2)
If the color of USDJPY or DJIA matches the color of Nikkei 225, that symbol is the main cause.
If there is no match, the main cause is "other factors."
Judgment Based on Change Column (Column 3)
Yellow: Suggests that other factors may be influencing the price.
Red: Strongly indicates that other factors are the main cause.
Parameter Descriptions Parameter Descriptions
symbol_x: Symbol for USDJPY (default: "SAXO:USDJPY")
symbol_y: Symbol for DJIA (default: "OSE:DJIA1!")
threshold_value1: Threshold for determining the influence of USDJPY and DJIA (blue/red color) (default: 1.5)
threshold_value2: Threshold for detecting specific price movements in Nikkei 225 (yellow color) (default: 20)
threshold_value3: Threshold for detecting significant price movements in Nikkei 225 (red color) (default: 50)
data_count: Number of past data points used for calculations (default: 10)
インジケーターの概要
このインジケーターは、日経225先物やCFDの値動きの主な原因が
以下のどれに起因するのかをリアルタイムで表示します
1. ドル円 (USDJPY)
2. ダウ (DJIA)
3. その他の要因(突発的なニュース、225の節目価格への攻防など)
テーブルの構成
1行目 ドル円の現在値と前足からの増減
2行目 ダウの現在値と前足からの増減
3行目 ドル円とダウから最小二乗法で算出した225の理論値とその増減
4行目 チャート銘柄(225)の現在値と前足からの増減
背景色の意味
1. 現在値列 (2列目):ドル円またはダウが225の理論値増減に大きく寄与した場合、
それぞれ青(増加)または赤(減少)に変化。閾値は1.5
225の現在値が増加すれば青、減少すれば赤。
2. 増減値列 (3列目):225の理論値増減と実際の増減が乖離した場合、
黄(中程度:閾値は20)または赤(大幅:閾値は50)に変化。
現在値列(2列目)での判断:
1. 銘柄(ドル円またはダウ)の色が225の色と一致する場合、その銘柄が主な原因。
2. 一致しない場合、主な原因は「その他」。
増減列(3列目)での判断:
黄色 その他の要因が影響している可能性。
赤色 その他の要因が主な原因と強く示唆。
パラメータの説明
symbol_x ドル円のシンボル(デフォルト: "SAXO:USDJPY")
symbol_y ダウのシンボル(デフォルト: "OSE:DJIA1!")
threshold_value1 ドル円とダウの影響を判定する(青/赤色)閾値(デフォルト: 1.5)
threshold_value2 225固有の値動きを判定する(黄色)閾値(デフォルト: 20)
threshold_value3 225固有の大きな値動きを判定する(赤色)閾値(デフォルト: 50)
data_count 計算に使用する過去データの本数(デフォルト: 10)

RSI+ Crypto Smart Strategy by Ignotus ### **RSI+ Crypto Smart Strategy by Ignotus**
**Description:**
The **RSI+ Crypto Smart Strategy by Ignotus** is an advanced and visually enhanced version of the classic **Relative Strength Index (RSI)**, developed by the **Crypto Smart** community. This indicator is designed to provide traders with a clear and actionable view of market momentum, overbought/oversold conditions, and potential reversal points. With its sleek design, customizable settings, and intuitive visual signals, this tool is perfect for traders who want to align their strategies with the principles of the **Crypto Smart** methodology.
Whether you're a beginner or an experienced trader, this indicator simplifies technical analysis while offering powerful insights into market behavior. It combines traditional RSI calculations with advanced visual enhancements and natural language interpretations, making it easier than ever to interpret market conditions at a glance.
---
### **Key Features:**
1. **Enhanced RSI Visualization:**
- The RSI line dynamically changes color based on its position relative to the 50-level midpoint:
- **Green** for bullish momentum (RSI > 50).
- **Red** for bearish momentum (RSI < 50).
- Overbought (default: 70) and oversold (default: 30) levels are clearly marked with customizable colors and shaded clouds for better visibility.
2. **Customizable Settings:**
- Adjust the RSI period, overbought/oversold thresholds, and background transparency to match your trading style.
- Fine-tune pivot lookback ranges and other parameters to adapt the indicator to different timeframes and assets.
3. **Interactive Information Table:**
- A compact, easy-to-read table provides real-time data on the current RSI value, its direction (▲, ▼, →), and a natural language interpretation of market conditions.
- Choose from three text sizes (small, medium, large) to optimize readability.
4. **Natural Language Interpretations:**
- The indicator includes a detailed explanation of the RSI's current state in plain English:
- Momentum trends (bullish, bearish, or neutral).
- Overbought/oversold warnings with potential reversal alerts.
- Clear guidance on whether the market is trending or ranging.
5. **Visual Buy/Sell Signals:**
- Triangles (▲ for buy, ▼ for sell) highlight potential entry and exit points based on RSI crossovers and divergence patterns.
- Configurable alerts notify you in real-time when key signals are triggered.
6. **Improved Aesthetics:**
- Clean, modern design with customizable colors for lines, clouds, and backgrounds.
- Dynamic shading and transparency options enhance chart clarity without cluttering the workspace.
---
### **How to Use This Indicator:**
- **Overbought/Oversold Zones:** Use the RSI's overbought (above 70) and oversold (below 30) zones to identify potential reversal points. Look for confirmation from price action or other indicators before entering trades.
- **Momentum Analysis:** Monitor the RSI's position relative to the 50-level midpoint to gauge bullish or bearish momentum.
- **Trend Identification:** Combine the RSI's readings with price trends to confirm the strength and direction of the market.
- **Entry/Exit Signals:** Use the visual signals (triangles) to spot potential entry and exit points. These signals are particularly useful for swing traders and scalpers.
---
### **Why Choose RSI+ Crypto Smart Strategy?**
This indicator is more than just an RSI—it's a complete tool designed to streamline your trading process. By focusing on clarity, customization, and actionable insights, the **RSI+ Crypto Smart Strategy** empowers traders to make informed decisions quickly and confidently. Whether you're trading cryptocurrencies, stocks, or forex, this indicator adapts seamlessly to your needs.
---
### **Developed by Crypto Smart:**
The **RSI+ Crypto Smart Strategy by Ignotus** is part of the **Crypto Smart** ecosystem, a community-driven initiative aimed at providing innovative tools and strategies for traders worldwide. Our mission is to simplify technical analysis while maintaining the depth and precision required for successful trading.
If you find this indicator helpful, please leave a review and share it with fellow traders! Your feedback helps us continue developing cutting-edge tools for the trading community.
---
### **Disclaimer:**
This indicator is a technical analysis tool and should not be considered financial advice. Trading involves risk, and past performance is not indicative of future results. Always conduct your own research and consult with a financial advisor before making trading decisions. Use of this indicator is at your own risk.

Relative Strength RatioWhen comparing a stock’s strength against NIFTY 50, the Relative Strength (RS) is calculated to measure how the stock is performing relative to the index. This is different from the RSI but is often used alongside it.
How It Works:
Relative Strength (RS) Calculation:
𝑅
𝑆
=
Stock Price
NIFTY 50 Price
RS=
NIFTY 50 Price
Stock Price
This shows how a stock is performing relative to the NIFTY 50 index.
Relative Strength Ratio Over Time:
If the RS value is increasing, the stock is outperforming NIFTY 50.
If the RS value is decreasing, the stock is underperforming NIFTY 50.

AntoQQE - BarsThis script is a variation on the QQE (Quantitative Qualitative Estimation) concept applied to RSI. It calculates a smoothed RSI line, then determines a “Dynamic Average Range” around that line. By tracking the RSI’s movement relative to these upper (shortBand) and lower (longBand) levels, it determines when price momentum shifts enough to suggest a possible trend flip. The script plots color-coded candles based on these momentum conditions:
• RSI Calculation and Smoothing
An RSI value is obtained over a specified period, then smoothed by an EMA. This smoothed RSI serves as the core measure of momentum.
• Dynamic Average Range (DAR)
The script computes the volatility of the smoothed RSI using two EMAs of its bar-to-bar movements. It multiplies this volatility factor by a QQE multiplier to create upper and lower bands that adapt to changes in RSI volatility.
• Trend Flips
When the smoothed RSI crosses above or below its previous band level (shortBand or longBand), the script interprets this as a shift in momentum and sets a trend state accordingly (long or short).
• Candle Coloring
Finally, the script colors each candle according to how far the smoothed RSI is from a neutral baseline of 50:
Candles turn green when the RSI is sufficiently above 50, suggesting bullish momentum.
Candles turn red when the RSI is sufficiently below 50, indicating bearish momentum.
Candles turn orange when they are near the 50 level, reflecting a more neutral or transitional phase.
Traders can use these colored candles to quickly see when the RSI’s momentum has moved into overbought/oversold zones—or is shifting between bullish and bearish conditions—without needing to consult a separate oscillator window. The adaptive nature of the band calculations can help in spotting significant shifts in market sentiment and volatility.
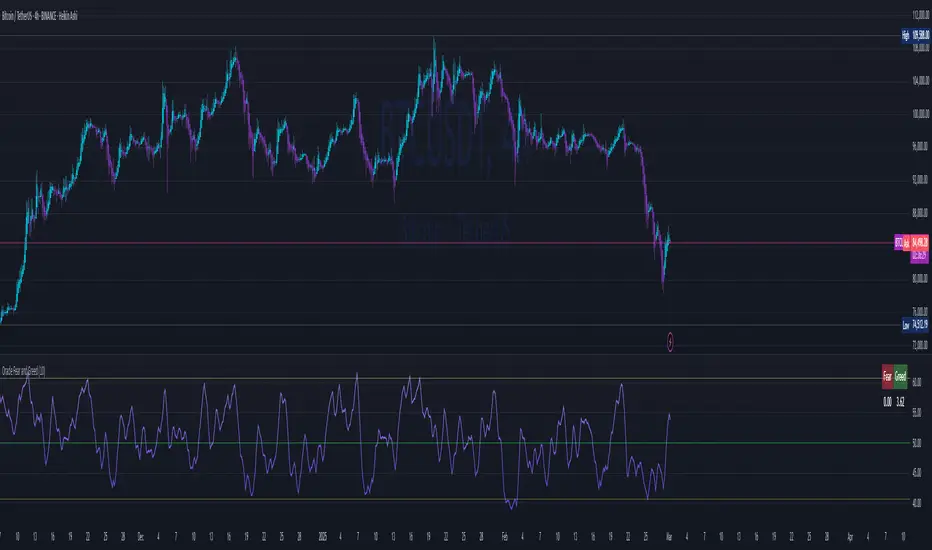
Oracle Fear and GreedCustom Fear and Greed Oscillator with Movement Table
This indicator provides a unique perspective on market sentiment by calculating a custom fear/greed oscillator based on Heikin-Ashi candles. The oscillator is centered at 50, with values above 50 suggesting bullish sentiment ("greed") and below 50 indicating bearish sentiment ("fear"). The calculation incorporates candle body size, range, and a custom "candle strength" measure, providing an innovative approach to understanding market behavior.
Key Features:
Heikin-Ashi Based Oscillator:
Utilizes Heikin-Ashi candles to compute a custom oscillator. The value is centered at 50, with deviations indicating the prevailing market sentiment.
Dynamic Gradient Coloring:
The oscillator line is dynamically colored with a smooth gradient—from blue (representing fear) at lower values to pink (representing greed) at higher values—making it visually intuitive.
Horizontal Levels:
Two additional horizontal lines are drawn at 40.62 ("Bottom") and 60.74 ("Top"), which may serve as potential oversold and overbought boundaries respectively.
Fast Movement Metrics:
Every 5 bars, the indicator calculates the percentage change in the Heikin-Ashi close. This fast movement analysis distinguishes rapid downward moves (fast fear) from rapid upward moves (fast greed), helping to capture sudden market shifts.
Information Table:
A table in the top-right corner displays the most recent fast movement values for both fear and greed, offering quick insights into short-term market dynamics.
Usage Tips:
Adjust the smoothing period to match your preferred trading timeframe.
Use the oscillator alongside other analysis tools for more robust trading decisions.
Ideal for those looking to experiment with new approaches to sentiment analysis and momentum detection.
Disclaimer:
This indicator is intended for educational and experimental purposes. It should not be used as the sole basis for any trading decisions. Always combine with comprehensive market analysis and risk management strategies.
You can add this description when publishing your indicator on TradingView to help other users understand its features and intended use.
[COG]TMS Crossfire 🔍 TMS Crossfire: Guide to Parameters
📊 Core Parameters
🔸 Stochastic Settings (K, D, Period)
- **What it does**: These control how the first stochastic oscillator works. Think of it as measuring momentum speed.
- **K**: Determines how smooth the main stochastic line is. Lower values (1-3) react quickly, higher values (3-9) are smoother.
- **D**: Controls the smoothness of the signal line. Usually kept equal to or slightly higher than K.
- **Period**: How many candles are used to calculate the stochastic. Standard is 14 days, lower for faster signals.
- **For beginners**: Start with the defaults (K:3, D:3, Period:14) until you understand how they work.
🔸 Second Stochastic (K2, D2, Period2)
- **What it does**: Creates a second, independent stochastic for stronger confirmation.
- **How to use**: Can be set identical to the first one, or with slightly different values for dual confirmation.
- **For beginners**: Start with the same values as the first stochastic, then experiment.
🔸 RSI Length
- **What it does**: Controls the period for the RSI calculation, which measures buying/selling pressure.
- **Lower values** (7-9): More sensitive, good for short-term trading
- **Higher values** (14-21): More stable, better for swing trading
- **For beginners**: The default of 11 is a good balance between speed and reliability.
🔸 Cross Level
- **What it does**: The centerline where crosses generate signals (default is 50).
- **Traditional levels**: Stochastics typically use 20/80, but 50 works well for this combined indicator.
- **For beginners**: Keep at 50 to focus on trend following strategies.
🔸 Source
- **What it does**: Determines which price data is used for calculations.
- **Common options**:
- Close: Most common and reliable
- Open: Less common
- High/Low: Used for specialized indicators
- **For beginners**: Stick with "close" as it's most commonly used and reliable.
🎨 Visual Theme Settings
🔸 Bullish/Bearish Main
- **What it does**: Sets the overall color scheme for bullish (up) and bearish (down) movements.
- **For beginners**: Green for bullish and red for bearish is intuitive, but choose any colors that are easy for you to distinguish.
🔸 Bullish/Bearish Entry
- **What it does**: Colors for the entry signals shown directly on the chart.
- **For beginners**: Use bright, attention-grabbing colors that stand out from your chart background.
🌈 Line Colors
🔸 K1, K2, RSI (Bullish/Bearish)
- **What it does**: Controls the colors of each indicator line based on market direction.
- **For beginners**: Use different colors for each line so you can quickly identify which line is which.
⏱️ HTF (Higher Timeframe) Settings
🔸 HTF Timeframe
- **What it does**: Sets which higher timeframe to use for filtering (e.g., 240 = 4 hour chart).
- **How to choose**: Should be at least 4x your current chart timeframe (e.g., if trading on 15min, use 60min or higher).
- **For beginners**: Start with a timeframe 4x higher than your trading chart.
🔸 Use HTF Filter
- **What it does**: Toggles whether the higher timeframe filter is applied or not.
- **For beginners**: Keep enabled to reduce false signals, especially when learning.
🔸 HTF Confirmation Bars
- **What it does**: How many bars must confirm a trend change on higher timeframe.
- **Higher values**: More reliable but slower to react
- **Lower values**: Faster signals but more false positives
- **For beginners**: Start with 2-3 bars for a good balance.
📈 EMA Settings
🔸 Use EMA Filter
- **What it does**: Toggles price filtering with an Exponential Moving Average.
- **For beginners**: Keep enabled for better trend confirmation.
🔸 EMA Period
- **What it does**: Length of the EMA for filtering (shorter = faster reactions).
- **Common values**:
- 5-13: Short-term trends
- 21-50: Medium-term trends
- 100-200: Long-term trends
- **For beginners**: 5-10 is good for short-term trading, 21 for swing trading.
🔸 EMA Offset
- **What it does**: Shifts the EMA forward or backward on the chart.
- **For beginners**: Start with 0 and adjust only if needed for visual clarity.
🔸 Show EMA on Chart
- **What it does**: Toggles whether the EMA appears on your main price chart.
- **For beginners**: Keep enabled to see how price relates to the EMA.
🔸 EMA Color, Style, Width, Transparency
- **What it does**: Customizes how the EMA line looks on your chart.
- **For beginners**: Choose settings that make the EMA visible but not distracting.
🌊 Trend Filter Settings
🔸 Use EMA Trend Filter
- **What it does**: Enables a multi-EMA system that defines the overall market trend.
- **For beginners**: Keep enabled for stronger trend confirmation.
🔸 Show Trend EMAs
- **What it does**: Toggles visibility of the trend EMAs on your chart.
- **For beginners**: Enable to see how price moves relative to multiple EMAs.
🔸 EMA Line Thickness
- **What it does**: Controls how the thickness of EMA lines is determined.
- **Options**:
- Uniform: All EMAs have the same thickness
- Variable: Each EMA has its own custom thickness
- Hierarchical: Automatically sized based on period (longer periods = thicker)
- **For beginners**: "Hierarchical" is most intuitive as longer-term EMAs appear more dominant.
🔸 EMA Line Style
- **What it does**: Sets the line style (solid, dotted, dashed) for all EMAs.
- **For beginners**: "Solid" is usually clearest unless you have many lines overlapping.
🎭 Trend Filter Colors/Width
🔸 EMA Colors (8, 21, 34, 55)
- **What it does**: Sets the color for each individual trend EMA.
- **For beginners**: Use a logical progression (e.g., shorter EMAs brighter, longer EMAs darker).
🔸 EMA Width Settings
- **What it does**: Controls the thickness of each EMA line.
- **For beginners**: Thicker lines for longer EMAs make them easier to distinguish.
🔔 How These Parameters Work Together
The power of this indicator comes from how these components interact:
1. **Base Oscillator**: The stochastic and RSI components create the main oscillator
2. **HTF Filter**: The higher timeframe filter prevents trading against larger trends
3. **EMA Filter**: The EMA filter confirms signals with price action
4. **Trend System**: The multi-EMA system identifies the overall market environment
Think of it as multiple layers of confirmation, each adding more reliability to your trading signals.
💡 Tips for Beginners
1. **Start with defaults**: Use the default settings first and understand what each element does
2. **One change at a time**: When customizing, change only one parameter at a time
3. **Keep notes**: Write down how each change affects your results
4. **Backtest thoroughly**: Test any changes on historical data before trading real money
5. **Less is more**: Sometimes simpler settings work better than complicated ones
Remember, no indicator is perfect - always combine this with proper risk management and other forms of analysis!

Volume Flow Indicator Signals | iSolani
Volume Flow Indicator Signals | iSolani: Decoding Trend Momentum with Volume Precision
In markets where trends are fueled by institutional participation, discerning genuine momentum from false moves is critical. The Volume Flow Indicator Signals | iSolani cuts through this noise by synthesizing price action with volume dynamics, generating high-confidence signals when capital flows align with directional bias. This tool reimagines traditional volume analysis by incorporating volatility-adjusted thresholds and dual-layer smoothing, offering traders a laser-focused approach to trend identification.
Core Methodology
The indicator employs a multi-stage calculation to quantify volume-driven momentum:
Volatility-Adjusted Filter: Measures price changes via log returns, scaling significance using a 30-bar standard deviation multiplied by user-defined sensitivity (default: 2x).
Volume Normalization: Caps extreme volume spikes at 3x the 50-bar moving average, preventing distortion from anomalous trades.
Directional Volume Flow: Assigns positive/negative values to volume based on whether price movement exceeds volatility-derived thresholds.
Dual Smoothing: Applies consecutive SMA (3-bar) and EMA (14-bar) to create the Volume Flow Indicator (VFI) and its signal line, filtering out transient fluctuations.
Breaking New Ground
This implementation introduces three key innovations:
Adaptive Noise Gates: Unlike static volume oscillators, the sensitivity coefficient dynamically adjusts to market volatility, reducing false signals during choppy conditions.
Institutional Volume Capping: The vcoef parameter limits the influence of outlier volume spikes, focusing on sustained institutional activity rather than one-off trades.
Non-Repainting Signals: Generates single-per-trend labels (buy below bars, sell above) to avoid chart clutter while maintaining visual clarity.
Engine Under the Hood
The script executes through five systematic stages:
Data Preparation: Computes HLC3 typical price and its logarithmic rate of change.
Threshold Calculation: Derives dynamic cutoff levels using 30-period volatility scaled by user sensitivity.
Volume Processing: Filters raw volume through a 50-bar SMA, capping extremes at 3x average.
VFI Construction: Sums directional volume flow over 50 bars, smoothed with a 3-bar SMA.
Signal Generation: Triggers alerts when VFI crosses zero, confirmed by a 14-bar EMA crossover.
Standard Configuration
Optimized defaults balance responsiveness and reliability:
Volume MA: 50-bar smoothing window
Sensitivity: 2.0 (doubles volatility threshold)
Signal Smoothing: 14-bar EMA
Volume Cap: 3x average (hidden parameter)
VFI Smoothing: Enabled (3-bar SMA)
By fusing adaptive volume filtering with price confirmation logic, the Volume Flow Indicator Signals | iSolani transforms raw market data into institutional-grade trend signals. Its ability to mute choppy price action while amplifying high-conviction volume moves makes it particularly effective for spotting early trend reversals in equities, forex, and futures markets.

RSI of Accumulation/DistributionHow to Use the RSI of Accumulation/Distribution Indicator:
1. Identify Overbought/Oversold Conditions:
Overbought: When the RSI of the ADL is above 70, it indicates that the asset may be overbought and could be due for a pullback or correction.
Oversold: When the RSI of the ADL is below 30, it suggests that the asset may be oversold and could be poised for a rebound.
2. Look for Divergences:
Bullish Divergence: If the price is making lower lows while the RSI of the ADL is making higher lows, it can signal a potential reversal to the upside.
Bearish Divergence: If the price is making higher highs while the RSI of the ADL is making lower highs, it can indicate a potential reversal to the downside.
3. Confirm Trend Strength:
Use the RSI of the ADL to confirm the strength of a trend. For example, if the RSI is consistently above 50 during an uptrend, it suggests strong buying pressure and the trend is likely to continue.
Conversely, if the RSI is consistently below 50 during a downtrend, it indicates strong selling pressure and the trend is likely to persist.
4. Monitor for Reversals:
When the RSI of the ADL crosses above 50, it can signal a potential bullish reversal.
When the RSI of the ADL crosses below 50, it can signal a potential bearish reversal.
Is It Worth It?
The RSI of the Accumulation/Distribution Line can be a valuable tool for traders looking to gain insights into market momentum and trend strength. Here are a few reasons why it might be worth considering:
1. Volume and Price Combination: By combining price action (RSI) with volume-based analysis (ADL), this indicator provides a more comprehensive view of market dynamics.
2. Divergence Detection: It helps identify divergences between price and volume, which can be early signals of potential reversals.
3. Trend Confirmation: It offers additional confirmation of trend strength and potential reversal points, helping traders make more informed decisions.
However, like any indicator, it's important to use it in conjunction with other analysis methods and not rely on it solely for trading decisions. Backtesting the indicator on historical data and combining it with other technical analysis tools can improve its effectiveness.
Feel free to test the script in TradingView and see how it performs in different market conditions. If you have any specific questions or need further assistance, let me know! 😊

Moneyball EMA-MACD indicator [VinnieTheFish]Summary of the Moneyball EMA-MACD Indicator Script
Author: VinnieTheFish
Purpose:
This indicator helps traders identify trend direction, momentum shifts, and potential trade signals based on EMA and MACD crossovers.
This Pine Script is a custom indicator that combines Exponential Moving Averages (EMAs) and MACD (Moving Average Convergence Divergence) to analyze price trends and momentum. The script uses a custom 9/50 MACD with a 16 smoothing period. The script is written in a way that you can create your own custom MACD settings and create alerts based on those parameters. The chart bars are color coded based on the relative position of the MACD and Signal line primarily for bullish long trade setups.
Bar color coding helps the trader spot potential reversals based on where the price currently resides in relation to the custom 9/50 EMA based MACD and the 16 period smoothing period for the signal line. Indicator also has custom alerts to notify the trader when a potential trade setup exists that correspond with the bar color change.
Question: So why is this called the Moneywell EMA-MACD Indicator?
Answer: In the movie Moneyball the Oakland A's broke down how to win a championship based on data. To make the playoffs you needed so many wins, then broken down by runs and then broken down to base hits. A base hit was good as a walk. With trading often times we look too often for home runs and ignore the importance of getting on base with small wins. This indicator was designed on shorter timeframes to identify those base hits, but can also be adapted to higher timeframes for swing trading.
Key Features:
User Inputs:
Configurable fast and slow lengths for MACD calculation.
Choice between SMA and EMA for oscillator and signal line smoothing.
Customizable signal smoothing length.
EMA Calculation:
Computes 3 EMA, 9 EMA, 20 EMA, and 50 EMA to track short-term and long-term trends.
MACD Calculation:
Computes MACD using either SMA or EMA based on user selection.
Generates the MACD signal line for comparison.
Crossover Conditions:
Detects MACD and Signal line crossovers above and below the zero line.
Identifies price momentum shifts.
Bar Coloring Logic:
Green: MACD is above 0 and above the signal line.
White: MACD is below the signal line.
Orange: MACD is below 0 but above the signal line.
Fuchsia: Bullish EMA 3/9 cross but price is still below the 20/50 EMA.
Alerts for Key Trading Signals:
MACD crossing above/below the zero line.
Signal line crossing above/below the zero line.
MACD reaching new highs/lows.
Alerts for colored bar conditions.

True Strength Index with Zones & AlertsKey Features:
True Strength Index (TSI) Calculation
Uses double-smoothed exponential moving averages (EMA) to calculate TSI.
A signal line (EMA of TSI) helps confirm trends.
Dynamic Color Coding for TSI Line
Green: TSI is above the signal line (Bullish).
Red: TSI is below the signal line (Bearish).
Crossover & Crossunder Signals
Bullish Crossover (TSI crosses above Signal Line) → Green Circle.
Bearish Crossunder (TSI crosses below Signal Line) → Red Circle.
Alerts for Trading Signals
Buy Alert: TSI crosses above the signal line.
Sell Alert: TSI crosses below the signal line.
Overbought & Oversold Zones
Overbought: Between 40 and 50 (Red Zone).
Oversold: Between -40 and -50 (Green Zone).
Highlighted Background when TSI enters these zones.
Neutral Line at 0
Helps determine trend direction and momentum shifts.
How to Use These Values:
• TSI Crosses Above Signal Line → Bullish entry.
• TSI Crosses Below Signal Line → Bearish entry.
• Overbought (+40 to +50) & Oversold (-40 to -50) zones → Watch for trend reversals.
• Divergence Signals → If price makes a new high/low but TSI doesn’t, momentum is weakening.

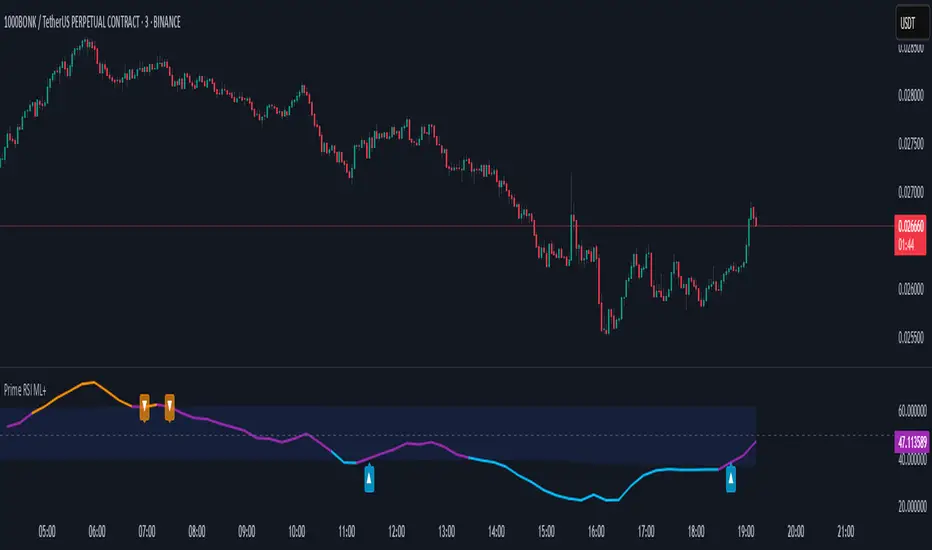
prime rsiThe "PRIME RSI" is a custom variation of the traditional RSI (Relative Strength Index) that offers enhanced flexibility and precision. This indicator provides an adaptable approach for tracking market conditions across different timeframes, making it an ideal tool for both short-term and long-term traders.
Key Features:
Custom Timeframe Selection: Users can select any timeframe to calculate the RSI, providing the ability to analyze data beyond the current chart's timeframe.
Smoothing Methods: Choose between Exponential Moving Average (EMA), Simple Moving Average (SMA), or the Relative Moving Average (RMA) for smoother, more accurate RSI values.
Signal Line: The signal line is smoothed using the selected method and visualized with dynamic coloring to indicate bullish (green) or bearish (red) market conditions.
Overbought/Oversold Levels: Clear levels at 70 (overbought) and 30 (oversold), with fill zones to highlight extreme market conditions, helping traders spot potential reversal points.
Midline at 50: The centerline at 50 serves as a neutral zone, allowing traders to identify shifts in market momentum quickly.
Practical Use:
Trend Confirmation: Use the PRIME RSI to confirm the prevailing market trend, with signals above 50 suggesting bullish momentum and signals below 50 indicating bearish trends.
Overbought/Oversold Conditions: The indicator’s overbought and oversold regions help pinpoint potential market reversals, giving traders valuable entry and exit signals.
Ideal For: All types of traders who want a more flexible and customizable RSI for better trend analysis, especially those working with smaller timeframes or seeking a more responsive momentum indicator.
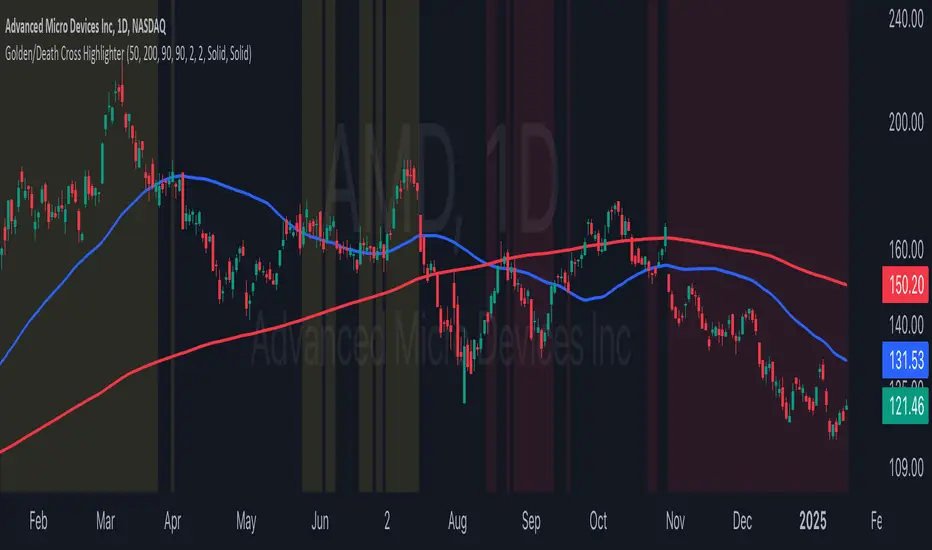
Golden/Death Cross HighlighterThis indicator helps you easily identify and visualize Golden Cross and Death Cross patterns combined with price action confirmation. It highlights chart backgrounds when specific conditions are met, making it easy to spot potential trend changes.
🔑 Key Features:
Highlights Golden Cross conditions (50 SMA crosses above 200 SMA) when price closes above both MAs
Highlights Death Cross conditions (50 SMA crosses below 200 SMA) when price closes below both MAs
Customizable MA lengths (default: 50 and 200)
Adjustable highlight opacity
Built-in alerts for cross events
Clear visualization of both moving averages
📈 Color Guide:
Yellow Background: Golden Cross active + price above both MAs
Red Background: Death Cross active + price below both MAs
⚙️ Settings:
Fast MA Length: Length of faster moving average (default 50)
Slow MA Length: Length of slower moving average (default 200)
Golden Cross Highlight Opacity: Adjust visibility of bullish highlights
Death Cross Highlight Opacity: Adjust visibility of bearish highlights
💡 Usage Tips:
Use in combination with other indicators for confirmation
Set up alerts for potential trend changes
Adjust opacity to match your chart style
Works best on higher timeframes (4H, Daily, Weekly)
Mean Reversion Pro Strategy [tradeviZion]Mean Reversion Pro Strategy : User Guide
A mean reversion trading strategy for daily timeframe trading.
Introduction
Mean Reversion Pro Strategy is a technical trading system that operates on the daily timeframe. The strategy uses a dual Simple Moving Average (SMA) system combined with price range analysis to identify potential trading opportunities. It can be used on major indices and other markets with sufficient liquidity.
The strategy includes:
Trading System
Fast SMA for entry/exit points (5, 10, 15, 20 periods)
Slow SMA for trend reference (100, 200 periods)
Price range analysis (20% threshold)
Position management rules
Visual Elements
Gradient color indicators
Three themes (Dark/Light/Custom)
ATR-based visuals
Signal zones
Status Table
Current position information
Basic performance metrics
Strategy parameters
Optional messages
📊 Strategy Settings
Main Settings
Trading Mode
Options: Long Only, Short Only, Both
Default: Long Only
Position Size: 10% of equity
Starting Capital: $20,000
Moving Averages
Fast SMA: 5, 10, 15, or 20 periods
Slow SMA: 100 or 200 periods
Default: Fast=5, Slow=100
🎯 Entry and Exit Rules
Long Entry Conditions
All conditions must be met:
Price below Fast SMA
Price below 20% of current bar's range
Price above Slow SMA
No existing position
Short Entry Conditions
All conditions must be met:
Price above Fast SMA
Price above 80% of current bar's range
Price below Slow SMA
No existing position
Exit Rules
Long Positions
Exit when price crosses above Fast SMA
No fixed take-profit levels
No stop-loss (mean reversion approach)
Short Positions
Exit when price crosses below Fast SMA
No fixed take-profit levels
No stop-loss (mean reversion approach)
💼 Risk Management
Position Sizing
Default: 10% of equity per trade
Initial capital: $20,000
Commission: 0.01%
Slippage: 2 points
Maximum one position at a time
Risk Control
Use daily timeframe only
Avoid trading during major news events
Consider market conditions
Monitor overall exposure
📊 Performance Dashboard
The strategy includes a comprehensive status table displaying:
Strategy Parameters
Current SMA settings
Trading direction
Fast/Slow SMA ratio
Current Status
Active position (Flat/Long/Short)
Current price with color coding
Position status indicators
Performance Metrics
Net Profit (USD and %)
Win Rate with color grading
Profit Factor with thresholds
Maximum Drawdown percentage
Average Trade value
📱 Alert Settings
Entry Alerts
Long Entry (Buy Signal)
Short Entry (Sell Signal)
Exit Alerts
Long Exit (Take Profit)
Short Exit (Take Profit)
Alert Message Format
Strategy name
Signal type and direction
Current price
Fast SMA value
Slow SMA value
💡 Usage Tips
Consider starting with Long Only mode
Begin with default settings
Keep track of your trades
Review results regularly
Adjust settings as needed
Follow your trading plan
⚠️ Disclaimer
This strategy is for educational and informational purposes only. It is not financial advice. Always:
Conduct your own research
Test thoroughly before live trading
Use proper risk management
Consider your trading goals
Monitor market conditions
Never risk more than you can afford to lose
📋 Release Notes
14 January 2025
Added New Fast & Slow SMA Options:
Fibonacci-based periods: 8, 13, 21, 144, 233, 377
Additional period: 50
Complete Fast SMA options now: 5, 8, 10, 13, 15, 20, 21, 34, 50
Complete Slow SMA options now: 100, 144, 200, 233, 377
Bug Fixes:
Fixed Maximum Drawdown calculation in the performance table
Now using strategy.max_drawdown_percent for accurate DD reporting
Previous version showed incorrect DD values
Performance metrics now accurately reflect trading results
Performance Note:
Strategy tested with Fast/Slow SMA 13/377
Test conducted with 10% equity risk allocation
Daily Timeframe
For Beginners - How to Modify SMA Levels:
Find this line in the code:
fastLength = input.int(title="Fast SMA Length", defval=5, options= )
To add a new Fast SMA period: Add the number to the options list, e.g.,
To remove a Fast SMA period: Remove the number from the options list
For Slow SMA, find:
slowLength = input.int(title="Slow SMA Length", defval=100, options= )
Modify the options list the same way
⚠️ Note: Keep the periods that make sense for your trading timeframe
💡 Tip: Test any new combinations thoroughly before live trading
"Trade with Discipline, Manage Risk, Stay Consistent" - tradeviZion

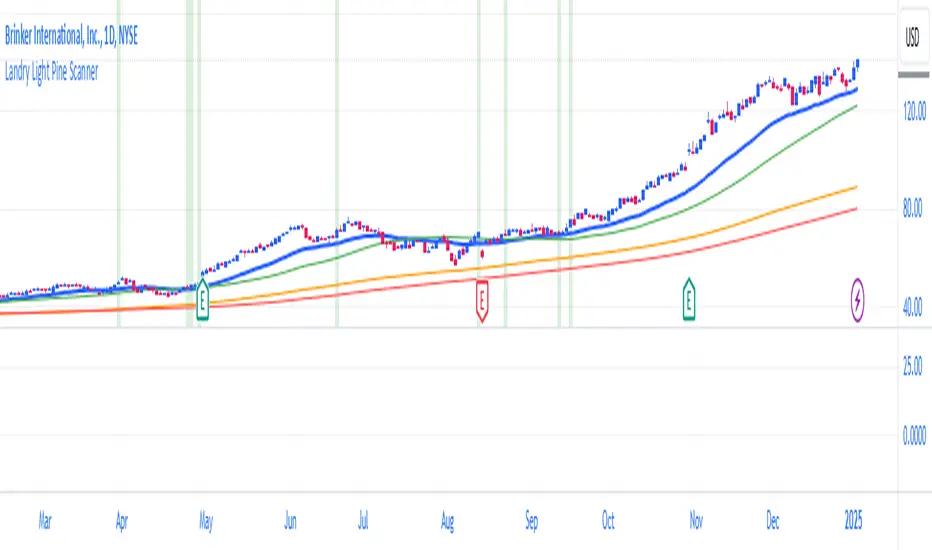
Landry Light Pine ScannerLandry Light Pine Scanner
The Landry Light Pine Scanner is a comprehensive technical analysis tool designed to identify stocks showing strong upward trends based on the Landry Light methodology. It scans for stocks where:
Today's low and yesterday's low are above the 30 EMA.
The low from two days ago is below the 30 EMA.
SMA 50 is above SMA 150, and SMA 150 is above SMA 200 (a strong bullish SMA hierarchy).
Features:
Trend Detection: Automatically highlights stocks with strong bullish trends based on EMA and SMA alignment.
Customizable Inputs: Users can adjust EMA and SMA lengths to fit their trading style.
Visual Clarity: Plots the 30 EMA, SMA 50, SMA 150, and SMA 200 directly on the chart for easy analysis.
Alert Ready: Integrated with TradingView's alert system to notify users when the conditions are met.
Chart Highlights: Automatically highlights bars that meet the conditions with a subtle green background.
Use Case:
This indicator is ideal for swing traders and position traders looking for potential breakout opportunities. By filtering stocks with a bullish structure, traders can focus on high-probability setups.
Conditions Used:
30 EMA Conditions:
Today's low is above the 30 EMA.
Yesterday's low is above the 30 EMA.
The low from two days ago is below the 30 EMA.
SMA Hierarchy:
SMA 50 is above SMA 150.
SMA 150 is above SMA 200.
Customization Options:
30 EMA Length: Adjustable to match user preferences.
SMA Lengths: SMA 50, SMA 150, and SMA 200 lengths are customizable for flexibility.
Alerts:
Users can set alerts for when the defined conditions are met, making it easy to monitor multiple stocks.
How to Use:
Apply the Indicator:
Add the indicator to your TradingView chart.
Set Alerts:
Use the built-in alert condition for automated notifications.
Analyze Trends:
Look for green-highlighted bars indicating stocks meeting the criteria.
Screen Stocks:
Use this tool as part of your screener to filter stocks efficiently.
Note:
This indicator does not provide buy or sell signals. Always combine it with other technical and fundamental analysis for informed trading decisions.
Publishing Tags:
Landry Light, EMA, SMA, Trend Analysis, Swing Trading, Position Trading, Technical Analysis, Breakout Scanner, TradingView, Pine Script
Enhanced SMA Signal Box With TargetsEnhanced SMA Signal Box With Targets
The Enhanced SMA Signal Box With Targets indicator is a versatile tool designed to help traders identify buy and sell signals based on various technical analysis methods, including Simple Moving Averages (SMA), Exponential Moving Averages (EMA), and Average True Range (ATR). This indicator provides clear visual signals and target levels to assist traders in making informed decisions.
Key Features
Simple Moving Averages (SMA):
20 SMA: Represents short-term price trends.
50 SMA: Represents long-term price trends.
Exponential Moving Average (EMA):
50 EMA: Adds additional trend confirmation to the SMA.
Signal Visualization:
Buy Signals: Displayed with a green "🚀" emoji below the candle when the closing price crosses above the 20 SMA.
Sell Signals: Displayed with a red "💣" emoji above the candle when the closing price crosses below the 20 SMA.
Yellow Box: Highlights the signal candle, making it easy to identify the most recent and historical signals.
Target Prices:
First Target: Based on the size of the signal candle.
Second and Third Targets: Calculated using the ATR multiplied by a user-defined factor to help set profit-taking levels.
Customizable Filters:
MACD Filter: Users can enable this filter to use MACD line crossings for signal confirmation.
Higher Timeframe SMA Filter: Users can set a higher timeframe SMA to filter signals based on the long-term trend.
Volume Filter: Users can set a minimum volume threshold for signals.
Alerts:
Users can enable alerts for buy and sell signals, ensuring they never miss a trading opportunity.
Customizable Settings:
Line Colors and Thickness: Users can adjust the colors and thickness of the SMAs, EMA, and signal boxes.
Signal Emojis: Users can choose custom emojis for buy and sell signals.
How It Works
Trend Calculation: The indicator calculates short-term and long-term trends using the 20 SMA, 50 SMA, and 50 EMA.
Signal Generation: Buy and sell signals are generated when the price crosses the 20 SMA, with optional confirmation from MACD and volume filters.
Target Calculation: Profit targets are based on the size of the signal candle and ATR, helping traders set realistic profit-taking levels.
Important Notice
This indicator is designed for educational purposes and should not be considered as financial advice. Past performance does not guarantee future results. Users should conduct their own research and analysis before making any trading decisions. Trading involves substantial risk and is not suitable for every investor. Always consider your financial situation, investment objectives, and risk tolerance before trading. Please ensure you comply with all the relevant regulations and TradingView's house rules while using this indicator.

Volatility Signaling 50SMAOverview of the Script:
The script implements a volatility signaling indicator using a 50-period Simple Moving Average (SMA). It incorporates Bollinger Bands and the Average True Range (ATR) to dynamically adjust the SMA's color based on volatility conditions. Here's a detailed breakdown:
Components of the Script:
1. Inputs:
The script allows the user to customize key parameters for flexibility:
Bollinger Bands Length (length): Determines the period for calculating the Bollinger Bands.
Source (src): The price data to use, defaulting to the closing price.
Standard Deviation Multiplier (mult): Scales the Bollinger Bands' width.
ATR Length (atrLength): Sets the period for calculating the ATR.
The 50-period SMA length (smaLength) is fixed at 50.
2. Bollinger Bands Calculation:
Basis: Calculated as the SMA of the selected price source over the specified length.
Upper and Lower Bands: Determined by adding/subtracting a scaled standard deviation (dev) from the basis.
3. ATR Calculation:
Computes the Average True Range over the user-defined atrLength.
4. Volatility-Based Conditions:
The script establishes thresholds for Bollinger Band width relative to ATR:
Yellow Condition: When the band width (upper - lower) is less than 1.25 times the ATR.
Orange Condition: When the band width is less than 1.5 times the ATR.
Red Condition: When the band width is less than 1.75 times the ATR.
5. Dynamic SMA Coloring:
The 50-period SMA is colored based on the above conditions:
Yellow: Indicates relatively low volatility.
Orange: Indicates moderate volatility.
Red: Indicates higher volatility.
White: Default color when no conditions are met.
6. Plotting the 50-Period SMA:
The script plots the SMA (sma50) with a dynamically assigned color, enabling visual analysis of market conditions.
Use Case:
This script is ideal for traders seeking to assess market volatility and identify changes using Bollinger Bands and ATR. The colored SMA provides an intuitive way to gauge market dynamics directly on the chart.
Example Visualization:
Yellow SMA: The market is in a low-volatility phase.
Orange SMA: Volatility is picking up but remains moderate.
Red SMA: Higher volatility, potentially signaling significant market activity.
White SMA: Neutral/default state.

MACD Aggressive Scalp SimpleComment on the Script
Purpose and Structure:
The script is a scalping strategy based on the MACD indicator combined with EMA (50) as a trend filter.
It uses the MACD histogram's crossover/crossunder of zero to trigger entries and exits, allowing the trader to capitalize on short-term momentum shifts.
The use of strategy.close ensures that positions are closed when specified conditions are met, although adjustments were made to align with Pine Script version 6.
Strengths:
Simplicity and Clarity: The logic is straightforward and focuses on essential scalping principles (momentum-based entries and exits).
Visual Indicators: The plotted MACD line, signal line, and histogram columns provide clear visual feedback for the strategy's operation.
Trend Confirmation: Incorporating the EMA(50) as a trend filter helps avoid trades that go against the prevailing trend, reducing the likelihood of false signals.
Dynamic Exit Conditions: The conditional logic for closing positions based on weakening momentum (via MACD histogram change) is a good way to protect profits or minimize losses.
Potential Improvements:
Parameter Inputs:
Make the MACD (12, 26, 9) and EMA(50) values adjustable by the user through input statements for better customization during backtesting.
Example:
pine
Copy code
macdFast = input(12, title="MACD Fast Length")
macdSlow = input(26, title="MACD Slow Length")
macdSignal = input(9, title="MACD Signal Line Length")
emaLength = input(50, title="EMA Length")
Stop Loss and Take Profit:
The strategy currently lacks explicit stop-loss or take-profit levels, which are critical in a scalping strategy to manage risk and lock in profits.
ATR-based or fixed-percentage exits could be added for better control.
Position Size and Risk Management:
While the script uses 50% of equity per trade, additional options (e.g., fixed position sizes or risk-adjusted sizes) would be beneficial for flexibility.
Avoid Overlapping Signals:
Add logic to prevent overlapping signals (e.g., opening a new position immediately after closing one on the same bar).
Backtesting Optimization:
Consider adding labels or markers (label.new or plotshape) to visualize entry and exit points on the chart for better debugging and analysis.
The inclusion of performance metrics like max drawdown, Sharpe ratio, or profit factor would help assess the strategy's robustness during backtesting.
Compatibility with Live Trading:
The strategy could be further enhanced with alert conditions using alertcondition to notify the trader of buy/sell signals in real-time.

LiquidFusion SignalPro [CHE] LiquidFusion SignalPro – Indicator Overview
The LiquidFusion SignalPro is a powerful and sophisticated TradingView indicator designed to identify high-quality trade entries and exits. By combining seven unique sub-indicators, it provides comprehensive market analysis, ensuring traders can make informed decisions. This tool is suitable for all market conditions and supports customization to fit individual trading strategies.
Key Components (Sub-Indicators):
1. RPM (Relative Price Momentum):
- Measures cumulative price momentum over a specified period.
- Provides insights into price strength and directional bias.
- Input Customization:
- Source: Data for momentum calculation.
- Period: Length for momentum measurement.
- Resolution: Timeframe for data fetching.
2. BBO (Bull-Bear Oscillator):
- Calculates the strength of bullish or bearish momentum based on price movement and RSI conditions.
- Uses a super-smoothing technique for reliable signals.
- Customizable parameters include the oscillator's period and repainting options.
3. MACD (Moving Average Convergence Divergence):
- A classic momentum indicator for trend direction and strength.
- Provides buy/sell signals based on the crossover of the MACD line and signal line.
- Input Customization:
- Fast/Slow EMA Periods.
- Signal Line Period.
- Resolution and Source Data.
4. RSI (Relative Strength Index):
- Tracks overbought and oversold conditions.
- A key tool to validate trend continuation or reversals.
- Customizable period, resolution, and source.
5. CCI (Commodity Channel Index):
- Measures the deviation of price from its average.
- Useful for identifying cyclical trends.
- Input Customization includes period, resolution, and source.
6. Stochastic Oscillator:
- Indicates momentum by comparing closing prices to a range of highs and lows.
- Includes smoothing factors for %K and %D lines.
- Customizable parameters:
- %K Length and Smoothing.
- Resolution and Repainting Options.
7. Supertrend:
- A trailing stop-and-reverse system for trend-following strategies.
- Excellent for identifying strong trends and potential reversals.
- Inputs include the multiplier factor and period for ATR-like calculations.
Inputs Overview:
The indicator supports extensive customization for each sub-indicator, grouped under intuitive categories:
- Color Settings: Define bullish and bearish plot colors.
- RPM, BBO, MACD, RSI, CCI, Stochastic, and Supertrend Settings: Tailor each sub-indicator's behavior with adjustable parameters.
- UI Options: Toggle features such as bar coloring, indicator names, and plotted candles.
Trade Signals:
- Long Signal:
- All indicators align in a bullish state:
- RPM > 0, MACD > 0, RSI > 50, Stochastic > 50, CCI > 0, BBO > 0, Supertrend below price.
- Plot: Green triangle below the candle.
- Alert: Notifies the trader of a potential long entry.
- Short Signal:
- All indicators align in a bearish state:
- RPM < 0, MACD < 0, RSI < 50, Stochastic < 50, CCI < 0, BBO < 0, Supertrend above price.
- Plot: Red triangle above the candle.
- Alert: Notifies the trader of a potential short entry.
Features:
- Enhanced Visuals: Plots sub-indicator statuses using labels and color-coded shapes for clarity.
- Alerts: Integrated alert conditions for both long and short trades.
- Bar Coloring: Provides overall trend bias with green (bullish), red (bearish), or gray (neutral) bars.
- Customizable Table: Displays the indicator's status in the chart’s top-right corner.
Trading Benefits:
The LiquidFusion SignalPro excels in generating high-quality entries and exits by:
- Reducing noise through multiple indicator alignment.
- Supporting multiple timeframes and resolutions for flexibility.
- Offering customizable inputs for personalized trading strategies.
Use this tool to enhance your market analysis and improve your trading performance.
Disclaimer:
The content provided, including all code and materials, is strictly for educational and informational purposes only. It is not intended as, and should not be interpreted as, financial advice, a recommendation to buy or sell any financial instrument, or an offer of any financial product or service. All strategies, tools, and examples discussed are provided for illustrative purposes to demonstrate coding techniques and the functionality of Pine Script within a trading context.
Any results from strategies or tools provided are hypothetical, and past performance is not indicative of future results. Trading and investing involve high risk, including the potential loss of principal, and may not be suitable for all individuals. Before making any trading decisions, please consult with a qualified financial professional to understand the risks involved.
By using this script, you acknowledge and agree that any trading decisions are made solely at your discretion and risk.
This indicator is inspired by the Super 6x Indicators: RSI, MACD, Stochastic, Loxxer, CCI, and Velocity . A special thanks to Loxx for their relentless effort, creativity, and contributions to the TradingView community, which served as a foundation for this work.
Happy trading and best regards
Chervolino

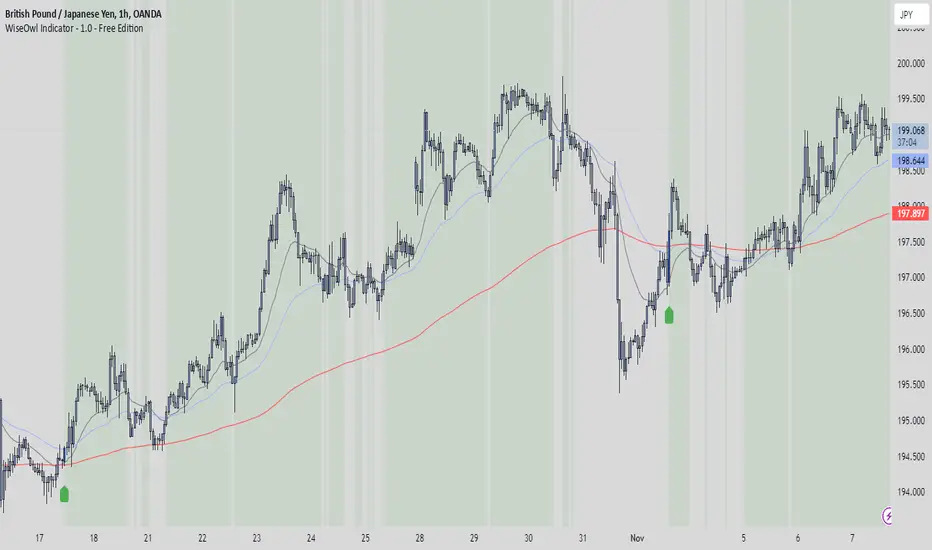
WiseOwl Indicator - 1.0 The WiseOwl Indicator - 1.0 is a technical analysis tool designed to help traders identify potential entry points and market trends based on Exponential Moving Averages (EMAs) across multiple timeframes. It focuses on providing clear visual cues for bullish and bearish market conditions, as well as potential breakout opportunities.
Key Features
Multi-Timeframe EMA Analysis: Calculates EMAs on the current timeframe, Daily timeframe, and 15-minute timeframe to confirm trends.
Bullish and Bearish Market Identification: Determines market conditions based on the 200-period EMA on the Daily timeframe.
Directional Candle Coloring: Highlights candles based on their position relative to EMAs to provide immediate visual feedback.
Entry Signals: Plots buy and sell signals on the chart when specific conditions are met on the 1-hour and 4-hour timeframes.
Breakout Candle Highlighting: Colors candles differently when significant price movements occur, indicating potential breakout opportunities.
How It Works
Market Condition Determination:
Bullish Market: When the close price is above the 200-period EMA on the Daily timeframe.
Bearish Market: When the close price is below the 200-period EMA on the Daily timeframe.
Directional Candle Coloring:
Green Background: Applied when the close is above the 50-period EMA and the market is not bearish.
Red Background: Applied when the close is below the 50-period EMA and the market is not bullish.
Uses the Average True Range (ATR) to define a range threshold.
Suppresses signals when EMAs are within this range, indicating a sideways market.
Plotting Entry Signals:
Plots arrows on the chart for potential long and short entries on the 1-hour and 4-hour timeframes.
Breakout Candle Coloring:
Colors candles blue when a bullish breakout condition is met.
Colors candles orange when a bearish breakout condition is met.
How to Use
Trend Identification: Use the background coloring to quickly identify the overall market trend.
Green Background: Suggests bullish conditions; consider looking for long opportunities.
Red Background: Suggests bearish conditions; consider looking for short opportunities.
Entry Signals: Look for plotted arrows on the chart.
Green Upward Arrow: Indicates a potential long entry signal on the 1-hour or 4-hour timeframe.
Red Downward Arrow: Indicates a potential short entry signal on the 1-hour or 4-hour timeframe.
Breakout Opportunities: Watch for candles colored blue or orange.
Blue Candles: Highlight significant upward price movements.
Orange Candles: Highlight significant downward price movements.
Avoiding Ranging Markets: Be cautious when signals are suppressed due to ranging conditions; the market may not have a clear direction.
Example Usage
Identifying a Bullish Market:
The background turns green.
Price crosses above the 50 EMA.
A green upward arrow appears below a candle on the 1-hour or 4-hour chart.
Identifying a Bearish Market:
The background turns red.
Price crosses below the 50 EMA.
A red downward arrow appears above a candle on the 1-hour or 4-hour chart.
Notes
Open-Source Code: The script is open-source, allowing users to review and understand the logic behind the indicator.
Educational Purpose: This indicator is intended to aid in technical analysis and should not be used as the sole basis for trading decisions.
Disclaimer
This indicator is for educational purposes only and does not constitute financial advice. Trading involves risk, and you should consult with a qualified financial advisor before making any investment decisions.