Seasonal Tendency (fadi)Seasonal tendency refers to the patterns in stock market performance that tend to repeat at certain times of the year. These patterns can be influenced by various factors such as economic cycles, investor behavior, and historical trends. For example, the stock market often performs better during certain months like November to April, a phenomenon known as the “best six months” strategy. Conversely, months like September are historically weaker.
These tendencies can help investors and traders make more informed decisions by anticipating potential market movements based on historical data. However, it’s important to remember that past performance doesn’t guarantee future results.
This indicator calculates the average daily move patterns over the specified number of years and then removes any outliers.
Settings
Number of years : The number of years to use in the calculation. The number needs to be large enough to create a pattern, but not so large that it may distort the price move.
Seasonality line color : The plotted line color.
Border : Show or hide the border and the color to use.
Grid : Show or hide the grid and the color to use.
Outlier Factor : The Outlier Factor is used to identify unusual price moves that are not typical and neutralize them to avoid skewing the predictions. It is the amount of deviation calculated using the total median price move.
Seasonalities

Time Cycles IndicatorThis script is used to analyze the seasonality of any asset (commodities, stocks, indices).
To use the script select a timeframe D or W and select the months you are interested in the script settings. You will see all the candles that are part of those months highlighted in the chart.
You can use this script to understand if assets have a cyclical behavior in certain months of the year.

Seasonality Chart [LuxAlgo]The Seasonality Chart script displays seasonal variations of price changes that are best used on the daily timeframe. Users have the option to select the calculation lookback (in years) as well as show the cumulative sum of the seasonal indexes.
🔶 SETTINGS
Lookback (Years): Number of years to use for the calculation of the seasonality chart.
Cumulative Sum: Displays the cumulative sum of seasonal indexes.
Use Percent Change: Uses relative price changes (as a percentage) instead of absolute changes.
Linear Regression: Fits a line on the seasonality chart results using the method of least squares.
🔶 USAGE
Seasonality refers to the recurrent tendencies in a time series to increase or decrease at specific times of the year. The proposed tool can highlight the seasonal variation of price changes.
It is common for certain analysts to use a cumulative sum of these indexes to display the results, highlighting months with the most significant bullish/bearish progressions.
The above chart allows us to highlight which months prices tended to have their worst performances over the selected number of years.
🔹 Note
Daily price changes are required for the construction of the seasonal chart. Thus, charts using a low timeframe might lack data compared to higher ones. We recommend using the daily timeframe for the best user experience.
🔶 DETAILS
To construct our seasonal chart, we obtain the average price changes for specific days on a specific month over a user-set number of years from January to December. These individual averages form "seasonal indexes."
This is a common method in classical time series decomposition.
Example:
To obtain the seasonal index of price changes on January first we record every price change occuring on January first over the years of interest, we then average the result.
This operation is done for all days in each month to construct our seasonal chart.
Seasonal variations are often highlighted if the underlying time series is affected by seasonal factors. For market prices, it is difficult to assess if there are stable seasonal variations on all securities.
The consideration of seasonality by market practitioners has often been highlighted through strategies or observations. One of the most common is expressed by the adage "Sell in May and Go Away" for the US market. We can also mention:
January Effect
Santa Claus Rally
Mark Twain Effect
...etc.
These are commonly known as calendar effects and appear from the study of seasonal variations over certain years.

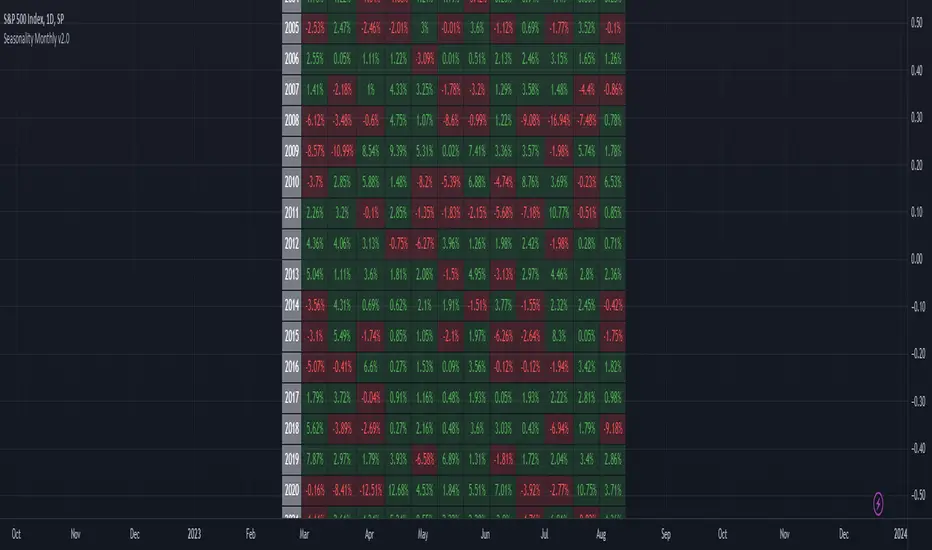
Seasonality Table - Tabular FormThis indicator displays the seasonality data for any instrument (index/stock/futures/currency) in a tabular data.
User can change the start of the year for analysis from the inputs.
Year is represented in rows and Month is represented in cols.
This indicator uses Monthly Data feed to calculate the % change
Summary data for the month is displayed as the last row