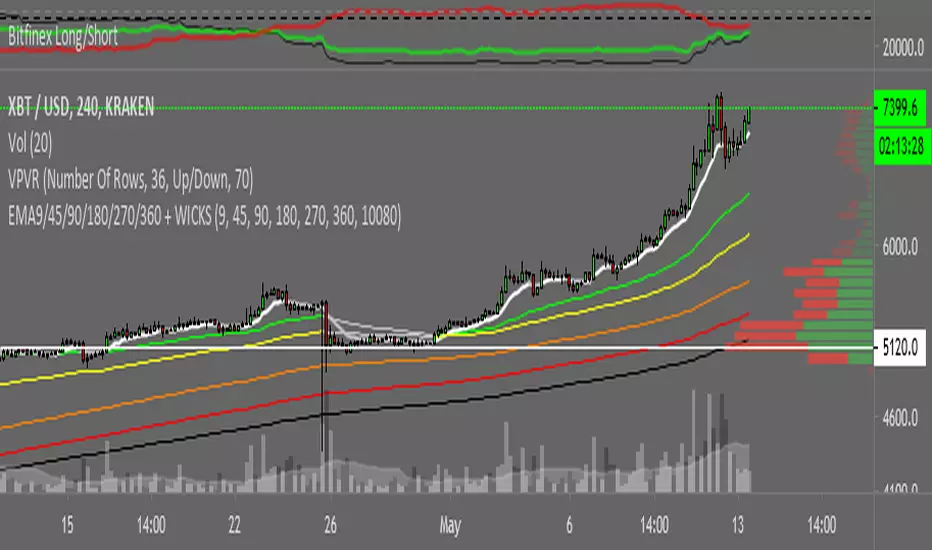
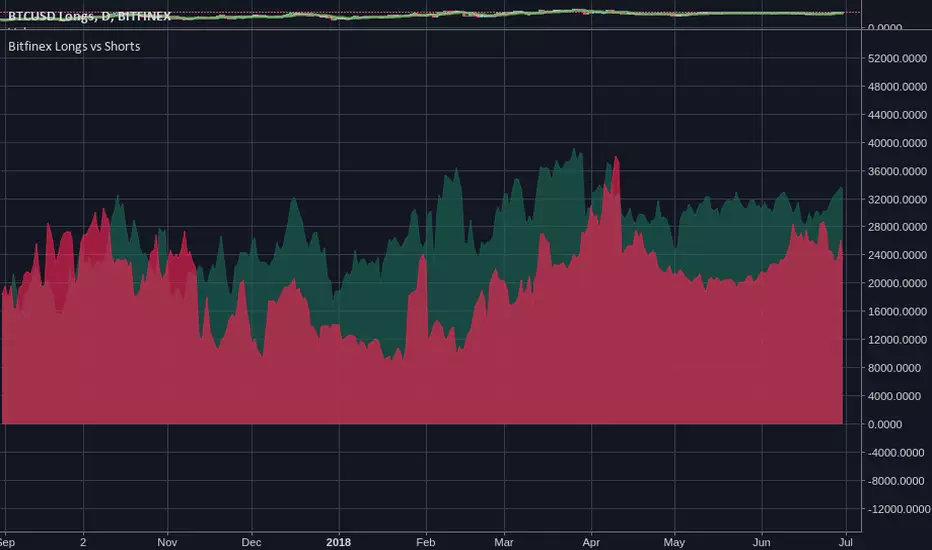
BTC longs n' shortsA indicator that neatly shows you BitFinex margin longs and shorts that can be put on any chart!
Short!!!!

MasterScripts - Mambo5The sophisticated algorithm was designed to detect Ideal Long and Short entries across multiple time frame (5/15/30/45 Minutes charts).
It uses different indicators all-in-one granting the user a quick and clean signal on when to buy or sell an asset an to maximize profits.
It also come with Alerts so you can set up signals it to your email/mobile device or tradingbot.
I offer a 24hs trial period so you can feel the power of this script.
Life-Time Access costs 0.01BTC.
BTC Address: 3LmGD4tBn8Y7KzfejJU4RRyxTa3EdUtyuV (Shoot DM after payment for access)
If you have any question, please leave your comment below.
Best trading scripts by MasterScripts

Dumb Indicator 9 - Bitfinex Shorts X LongsThis is a way to study how the crypto market is going on Bitfinex, you can see the diference between the Long and Short terms on most popular pairs.

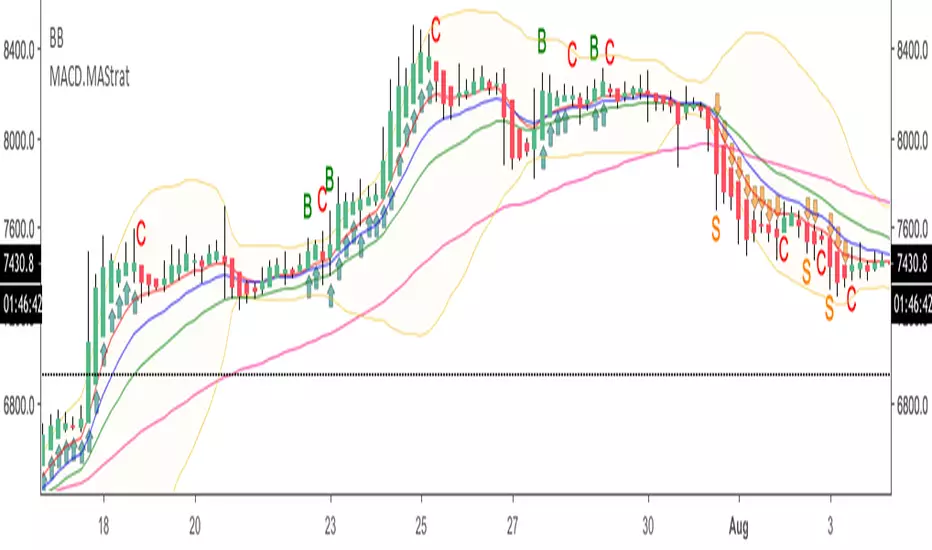
HA.MACD.MA.TradeSetupsHi probably trade setups indicator intended to be used with Heikin Ashi candles. It uses fibo EMAs and MACD to signal longs/shorts. Intended for scalping high cap coin with high volume on lower time frames.
Market Sniper V1 [Alerts]Market Sniper is a trend-based script born and created with leverage trading in mind. I created this to trade automatically with leverage using AutoView Chrome Extension on BitMex XBTUSD -0.04% .
Features:
• Trend-Based: use higher timeframe to check the trend of the coin, and a threshold to evaluate the trend strength.
• Dual-Behavior: different settings are used when the trend is strong and when it is weak. With a strong trend it can catch big trades, with a stable trend it can act like a scalper with smaller and faster trades.
• Smart Profit: you can set a percentage gain and a trail setting. The script will try to trail the price if the trend is strong, otherwise it will exit at the specified gain.
• Loss Control: you can set a percentage stop-loss to cover bad entries. The market is unpredictable, no script is perfect, sooner or later it will take a bad choice.
The chart shows the result for the full month of August using leverage 10.
If you want to try it just contact me.


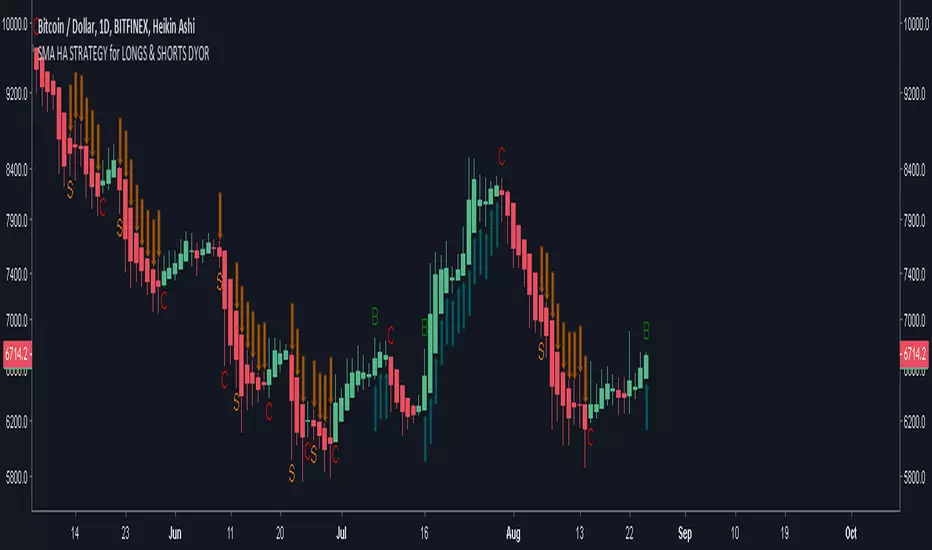
SMA HA STRATEGY for LONGS & SHORTS DYOR (10D v 20D)Script around SMA crossing.
10Dv20D
Usefull for Longs and Shorts signals.
Trunico3 -- @TrueCrypto28New version of Trunico.
Looking really nice for calling Shorts and longs.
We will releasing this scripts soon through @TrueCrypto28 Twitter.
Regards.

Bitfinex BTC longs vs Short & RatioSince the last BTC Short Squeeze on Bitmex maintenance I decided to made a Indicator plotting Long:Short ratio, and their respective graphs.
Green = Longs
Red = Shorts
Black = Ratio (Longs:Shorts)*Close <= Close price just for chart normalization!
I hope you find it useful.
NOTE: It isn't a prospective indicator, but try to find out who's bitching the market and when ;p
EMA Cross for Long and Short with Stoch/MACD/RSI + IchimokuPrimary and Secondary EMA Cross analysis for Long and Short with Stoch/MACD/RSI Analysis + Ichimoku Cloud
The script will let you choose to show (or not):
*Primary EMA Trend
*Secondary EMA Trend
*Stochastic Alerts
*MACD Alerts
*RSI Alerts
*LONG or SHORT Alerts
It will also let you configure the EMA periods. ichimoku, MACD and RSI seetings
The cost to the tool is 0.005BTC.
For custom scripts send me a PM.

Market Sniper Signal MTF [ALERTS]Script with alert condition to use with Market Sniper Strategy.
Can be used to trade manually or automatically using API/AutoView Extension.
Market Sniper is a multi-timeframe strategy based on trend analysis created to operate on leverage market.
Code is still in beta-testing, please leave a comment if you want a free trial when final release will be available.

BTC/USD Margin Shorts and Long on BitfinexThis script denotes the condition of margin traders on Btifinex exchange.
- Yellow Crosses mean both shorts and longs are increasing market is getting volatile
- Gray Crosses means margin traders undecided on that candle
- Green Crosses mean longs are increasing and shorts are being pulled out
- Red Crosses mean Longs are being pulled out and shorts being put in
This is the script for BTC/USD margin longs and shorts
I hope you find this small script useful.
Have a great day!

ETH/USD Margin Shorts and Long on BitfinexThis script denotes the condition of margin traders on Btifinex exchange
- Yellow Crosses mean both shorts and longs are increasing market is getting volatile
- Gray Crosses means margin traders undecided on that candle
- Green Crosses mean longs are increasing and shorts are being pulled out
- Red Crosses mean Longs are being pulled out and shorts being put in
This is the script for ETH/USD margin longs and shorts
I hope you find this small script useful.
Have a great day!


EdgeAnalysisGroup Volume Cloud V1.1EdgeAnalysisGroup Volume Cloud V1.1
Brief Intro
I will keep this sweet and simple so I can write about it elsewhere in greater deal later down the line.
I had the idea for this script when I saw the EMA ribbons indicator, and noticed something that was happening on the line crosses. I then tried to find a way to optimise the strategy for the fast moving volatile crypto-currency market~ this is where I came up with this indicator which was based of moving averages and volume, but was tradable like a cloud with an area. Another factor I decided to take from the ichimoku cloud was the offset it provides- this allows a clean image for the user to trade with and pre-plan.
This guaranteed a clear cut trading strategy which I could easily backtest and tweak for optimisation.
I can say this indicator seems to work well for the 1day chart.
There is lots I have to learn about the line crosses, and the direction of the cloud etc., so we can create new trading strategies.
This script will work better on some charts than others, but hopefully it is still a hit for most and all time frames.. I have alot of backtesting to do with this indicator on all markets- and potentially some heavy quality of life updates and technical tweaks too.
Trading strategy
Taking a position
There are 3 lines on the topside and the bottom side of the cloud.
Open : Price crossing and closing the middle line of the 3.
Stop-loss: Outer line of the 3 it has already crossed.
Target: Inside line of the opposite 3 it hasn't crossed. Any STRONG supports/resistances need to also be taken into account and price assessed as usual as the move is completing- manual closes are a big part of management.
VolumeCloud Twists
If there is a twist- (the 6 lines crossing across each other) this can either be bullish or bearish depending on the direction of the cloud, this is an early sign of a trend forming.
When it is above the cloud we can expect retests of the upper/lower lines on pullbacks. I am developing a trading strategy currently for breaks above the cloud with twists so stay tuned for that.
ETH/BTC Backtest
A small backtest on ETH/BTC gave an 80%+ win rate, this is a small sample size of about 25 positions or so, but with such a strong win rate I can only imagine it could be a strong tool to a clever trader.
Did you enjoy this brief little guide, why not join me and the other members of the EdgeAnalysisGroup ?
Message me on tradingview and I'll shoot you a link to our discord. Here you can get access to more indicators, a fantastic community and even high quality signals made by me and a few other top traders.
Xander
All information found here, including any ideas, opinions, views, predictions, forecasts, commentaries, suggestions, indicators, or stock/cryptocurrency picks, expressed or implied herein, are for informational, entertainment or educational purposes only and should not be construed as personal investment advice. These are not facts but my personal views and opinions.
I will not and cannot be held liable for any actions you take as a result of anything you read or use here,

Xypher Long/Short Finder (PSAR)Looks for longs and shorts on downtrends and uptrends, using EMAs to define the trend and PSAR to look for entries.
You can deactivate up/down trend longs/shorts on the settings according to your needs. My favorite setup is to find bottoms/tops with it:
Use uptrend shorts if you are looking to short at the top.
Use downtrend longs if you are looking to go long on the bottom reversal.
Basic setup: ride the waves by looking for longs on uptrends and shorts on downtrends.
Scalping setup: find an asset uptrending on a big timeframe (daily, weekly), and look for longs on both up/downtrends on smaller timeframes.
Ichimoku cloud was added to help further with the search of supports and resistance, along with 50,100 and 200 EMA.
Candles are colored according to the trend, to view it, hover the mouse over the indicator or bring it to the front (Right Click -> Visual Order -> Bring to Front). Description is on the chart

Short vs. LongSimple Short vs. Long domination indicator. White line indicates absolute value of diffrence between Shorts and Longs.

Bimex Long Short PRO [PlungerMen]Hello!
This free community edition is very good for all time frame , for all the crypto
This Script recognized overbought area and over-selling area extremely accurate
This Script is very well used as it works by itself and very well used in conjunction with the "Bitmex scalping " script, both compliment for each other. the "Bitmex Scalping" script is Free, you can find it
If you want to be more accurate and more efficient, more comfortable when you do not want to see too many other indicators, you can register for our Professional edition.
- The Professional Edition supports Level 1 and Level 2 commands, which are very effective in allocating funds and optimizing your profits
Besides that,You will be supported by personal preferences, profit maximization
- Register for a Professional version will be used 2 Script,Bimex Scalping Pro and Bitmex Long Short Pro
- We will invite you to the signal channel with the announcement of the bottom and the peak of the BTC ,the big variable variable has exists
We hope you enjoy this script. Your support will help us develop more good quality scripts in the future to serve the community
**Remember, Like this script and posivite feedback if you are satisfied**
if you have any questions Plz post a comment ... below here
******
Thanks

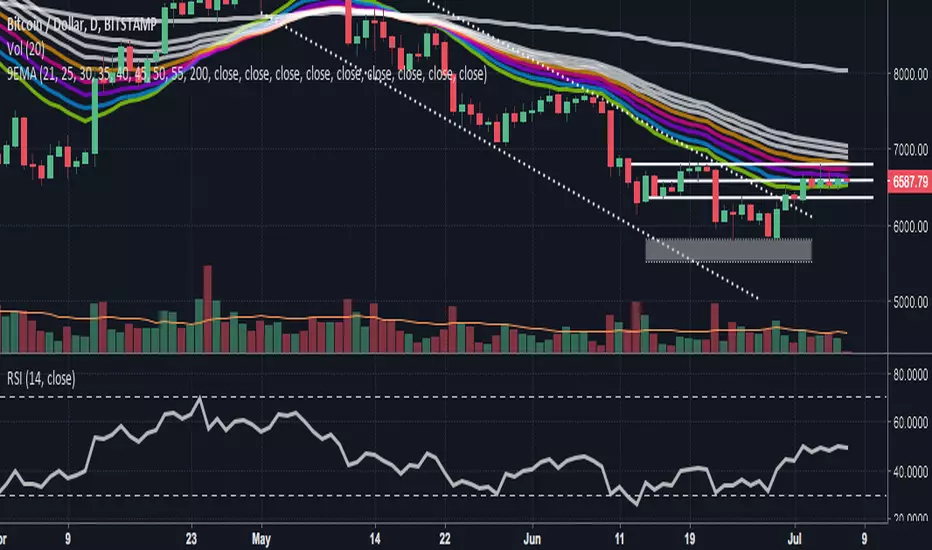
2EMA + 2SMAUsing EMAs allows to see whether the market is forming a trend, the 13-EMA & 48-EMA have the ability to determine a trend direction. SMAs help to identify if a trend is forming a continuation pattern, using the 100-SMA & 200-SMA, this can be seen.

2EMA + 2SMAUsing EMAs allows the ability to work out trends in the short-term, the 13-EMA & 48-EMA determine whether the market is forming specific trend. SMAs are used to identify whether a trend is in a continuation pattern, and with the help of the 100-SMA & 200-SMA, this can be seen.
Bitfinex Longs vs Shortssexy view of the current long/short positions on Bitfinex. I saw some pay-for, hidden-source-code version of this and thought: "oh man."
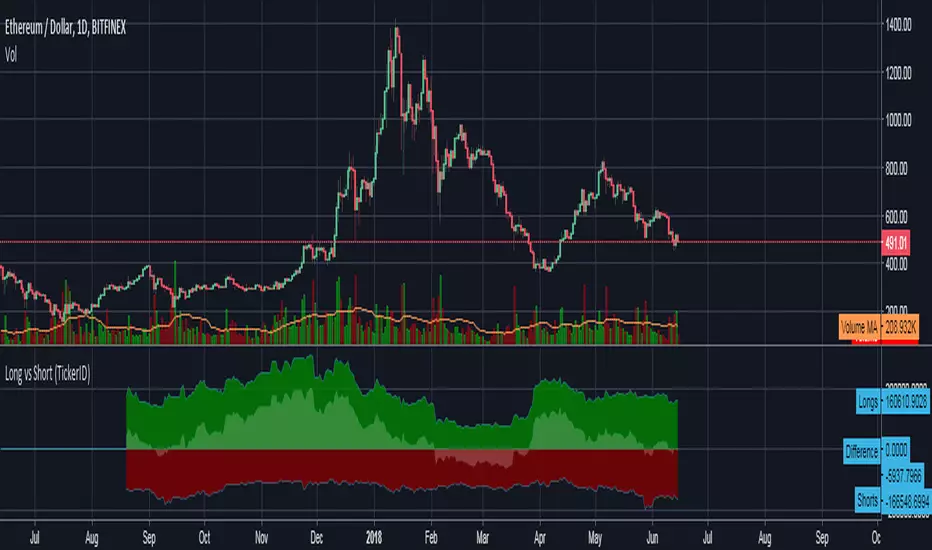
Bitfinex Long vs Short (TickerID)Uses the active ticker to show long/short values on all Bitfinex pairs that have that data available on Tradingview.
Closing Leverage and Rate of ChangeShows BTCUSDLONGS vs BTCUSDSHORTS along with their rate of change on a scale that's friendly for a combined indicator. ROC is increased proportionally so you can see it in relationship to Open Shorts and Open Longs on the same graph without zooming. I had been using an offset as well, but using an offset to adjust position causes the highs to look lower and it makes the lows look less low. It was significant enough to seem like a bad idea to include.
