Smart Inside Bar Zones by Dinkan🔹 How It Works
An Inside Bar is formed when a candle’s high and low are completely within the previous candle’s range.
The indicator detects this structure in real time, creates a visual box around it, and extends the zone until the pattern is broken.
Inside Bar candles can be optionally highlighted with a custom color to make them stand out clearly on the chart.
🔹 Features
✅ Automatic Inside Bar detection
✅ Dynamic Inside Bar zone boxes with custom fill & border color
✅ Inside candle body highlighting with user-defined color
✅ Adjustable transparency and border style
✅ Option to display only the latest Inside Bar zone for cleaner charts
🔹 Usage
Traders can use Inside Bar zones to:
Study price compression and breakout regions
Observe range behavior and trend continuation setups
Combine with other tools like volume or support/resistance analysis
🔹 Customization
Change box fill and border color
Adjust Inside Candle color for better visibility
Set transparency and choose whether to show all or only the latest box
⚠️ Disclaimer
This script is intended for market structure visualization and educational purposes only.
It does not generate trading signals or financial advice.
Always perform your own analysis and risk management before making trading decisions.
Sideways

Atlantean Sideways / Range Regime DetectorPurpose
When using trend based indicators, you can skip the false signals when there is a sideways action, protecting you from the false signals.
Flags likely sideways/range phases using three checks:
Weak trend (ADX from DMI)
Price compression (Bollinger Band Width, normalized)
Low volatility (NATR = ATR/Price%)
Logic
isSideways = (ADX < adxThresh) AND (bbNorm < 0.25) AND (NATR < natrMax)
When true: bars + background turn teal and a provisional Range High/Low (rolling rangeWin) is drawn.
Key Inputs
DMI: diLen(22)
Optimized for 15 mins Bitcoin, could change it to 14 for more general approach
ADX: adxSmooth(14), adxThresh(18)
Volatility: lenATR(14), natrMax(1.8)
Visuals: rangeWin(20), bar/range toggles
Quick Tuning
More signals: raise adxThresh to 20–25, raise natrMax to 2.5–4.0, increase BB cutoff by editing bbNorm < 0.25 --> 0.35–0.50.
Smoother range lines: increase rangeWin to 30–40.
Use Cases
Mean reversion inside teal ranges.
Breakout prep when price closes outside the drawn range after teal ends. Could be used as a signal although not suggested.
Filter trend systems: skip trades when sidewaysCond is true. This is the main purpose, for it to be combined with trend based indicators, like Supertrend.
Alert
“Sideways Detected” triggers when isSideways is true.
Script could be expanded upon your requests.

SmartPlusSmartPlus
Overview
The SmartPlus indicator is a complete framework for intraday traders. It combines key market reference points (VWAP, moving averages, and the first 15-minute high/low range) with predictive levels based on historical daily moves. Together, these elements allow traders to build directional bias, spot breakouts, and manage risk throughout the session.
Key Features
1. VWAP (Volume-Weighted Average Price)
- Plots the intraday VWAP in real time.
- VWAP acts as a central “fair value” reference point for institutional order flow.
- Price trading above VWAP generally suggests bullish bias, while below VWAP leans bearish.
2. Exponential Moving Averages (EMAs)
- Two configurable EMAs are included:
- Fast EMA (default: 21 periods)
- Slow EMA (default: 34 periods)
- Each EMA is plotted with a single, user-selectable color for clarity.
- Crossovers or alignment between price, VWAP, and EMAs help define market structure.
3. Smart Bar Coloring
- Candles automatically change color when conditions align:
- Bull Zone: Price above VWAP, Fast EMA, and Slow EMA.
- Bear Zone: Price below VWAP, Fast EMA, and Slow EMA.
- Fluorescent bar coloring helps highlight momentum zones visually without additional analysis.
4. First 15-Minute High/Low/Mid (Automatic)
- Automatically detects the first 15 minutes of each new trading day (no manual input required).
- Plots horizontal lines for:
- First 15-Minute High (green)
- First 15-Minute Low (red)
- Midpoint of that range (gray)
- Once the initial 15-minute window ends, these levels remain projected throughout the session as breakout or support/resistance zones.
- Alerts trigger when price breaks above the high or below the low after the window.
5. Daily Support/Resistance Forecast
- Uses a rolling lookback of recent daily ranges (default: 126 days).
- Tracks average up moves and down moves from the daily open.
- Optionally incorporates standard deviation for wider confidence bands.
- Plots forecast levels above/below the current day’s open for reference.
Trading Logic (How to Use)
- Bullish Bias:
- Price is above VWAP, above both EMAs, and ideally above the first 15-minute high.
- This setup suggests trend continuation or breakout opportunities on the long side.
- Bearish Bias:
- Price is below VWAP, below both EMAs, and ideally below the first 15-minute low.
- This setup suggests downward pressure or breakout opportunities on the short side.
- Neutral / Caution Zone:
- Price caught between VWAP, EMAs, or inside the 15-minute range often signals indecision.
- Best to wait for confirmation or breakout before committing to trades.
Expectations After Using It
- The script provides context and structure, not trading signals.
- It highlights where price is relative to meaningful market levels so traders can act with greater confidence.
- Combining VWAP, EMAs, and the 15-minute breakout framework helps traders stay aligned with the market’s natural rhythm.
Disclaimer
This script is a tool for market analysis and educational purposes only.
It does not constitute financial advice, trading recommendations, or guaranteed profitability.
Markets are inherently risky, and past patterns do not ensure future results.
Always combine this tool with sound risk management, personal research, and professional guidance before making any trading decisions.

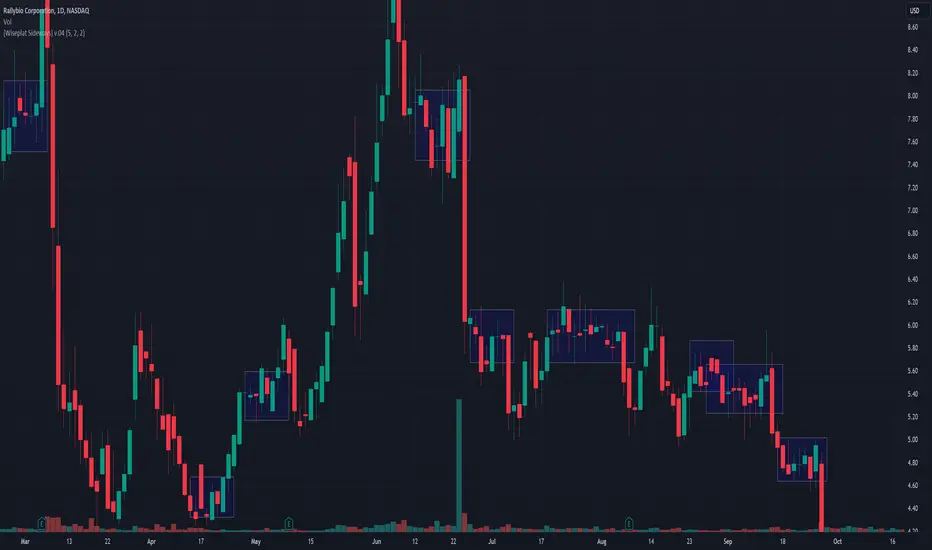
Trend Range Detector (Zeiierman)█ Overview
Trend Range Detector (Zeiierman) is a market structure tool that identifies and tracks periods of price compression by forming adaptive range boxes based on volatility and price movement. When prices remain stable within a defined band, the script dynamically draws a range box; when prices break out of that structure, the box highlights the breakout in real-time.
By combining a volatility-based envelope with a custom weighted centerline, this tool filters out noise and isolates truly stable zones — providing a clean framework for traders who focus on accumulation, distribution, breakout anticipation, and reversion opportunities.
Whether you're range trading, spotting trend consolidations, or looking for volatility contractions before major moves, the Trend Range Detector gives you a mathematically adaptive, visually intuitive structure that maps the heartbeat of the market.
█ How It Works
⚪ Range Formation Engine
The core of this indicator revolves around two conditions:
Distance Filter: The maximum distance between all recent closes and a dynamic centerline must remain within a volatility envelope.
Volatility Envelope: Based on an ATR(2000) multiplied by a user-defined factor to account for broader market volatility trends.
If both conditions are satisfied over the most recent length bars, a range box is drawn to visually anchor the zone.
⚪ Dynamic Breakout Coloring
When price breaks out of the top or bottom of the active range box, the box color shifts in real-time:
Blue Boxes represent areas where price has remained within a defined volatility envelope over a sustained number of bars. These zones reflect stable, low-volatility periods, often associated with consolidation, equilibrium, or market indecision.
Green Boxes for bullish breakouts.
Red Boxes for bearish breakdowns.
This allows traders to visually spot transitions from consolidation to expansion phases without relying on lagging signals.
█ Why Use a Weighted Close Instead of SMA?
A standard Simple Moving Average (SMA) treats all past closes equally, which works well in theory, but not in dynamic, fast-shifting markets. In this script, we replace the traditional SMA with a speed-weighted average that reflects how aggressively the market has moved bar-to-bar.
⚪ Here's why it matters:
Bars with higher momentum (larger price differences between closes) are given more weight.
Slow, sideways candles (typical in noise or low volume) contribute less to the calculated centerline.
This method creates a more accurate snapshot of market behavior, especially during volatile phases. As a result, the indicator adapts to market conditions more effectively, helping traders identify real consolidation zones, not just average lines distorted by flat bars or noise.
█ How to Use
⚪ Range Detection
Boxes form only when price remains consistently close to the speed-weighted mean.
Helps identify sideways zones, consolidations, and low-volatility structures where price is “charging up.”
⚪ Breakout Confirmation
Once price exits the top or bottom boundary, the box immediately highlights the direction of the break.
Use this signal in conjunction with your own momentum, volume, or trend filters for higher-confidence trades.
█ Settings
Minimum Range Length: Number of candles required for a valid range to form.
Range Width Multiplier: Adjusts the envelope around the weighted average using ATR(2000).
Highlight Box Breaks: Enables real-time coloring of breakouts and breakdowns for immediate visual feedback.
-----------------
Disclaimer
The content provided in my scripts, indicators, ideas, algorithms, and systems is for educational and informational purposes only. It does not constitute financial advice, investment recommendations, or a solicitation to buy or sell any financial instruments. I will not accept liability for any loss or damage, including without limitation any loss of profit, which may arise directly or indirectly from the use of or reliance on such information.
All investments involve risk, and the past performance of a security, industry, sector, market, financial product, trading strategy, backtest, or individual's trading does not guarantee future results or returns. Investors are fully responsible for any investment decisions they make. Such decisions should be based solely on an evaluation of their financial circumstances, investment objectives, risk tolerance, and liquidity needs.

SSL Channel MTFSSL Channel with MTF support, This eliminates the noise of a basic SSL Channel script which is based on ErwinBeckers SSL Channel. So i have used a Multi Time Frame approach to have a clear confirmation of trend and reduce Noise and False signals unlike basic SSL Channel.
This script can be used to determine.
Support/Resistance
High/Low Breakout
Trend Direction
MA candles for Entry
The high and low sma are plotted as SSL CHANNEL when ever the high and low sma cross each other a direction change is observed.
The direction of SSL channel determines the trend of the price. The length of the channel can be changed as required a low value has a high noise and direction can be determined with low accuracy. Increasing the length of SSL channel has high accuracy trend confirmation.
The MTF SSL Channel uses plot from higher timeframe this helps in using SSL Channel as a Price Action Tool. Price when ever crosses over or below the channel determines a breakout. Price tries to move between the High SMA line and Low SMA Line of the SSL Channel rejection, breakouts can be easily observed on a lower timeframe using SSL Channel Plot from a higher timeframe.
I have used 5min/15min chart with MTF SSL from a 1Hr/4Hr and a length of 5 instead of 10. This helps quick direction changes over a period of 1hr to 4hr. Price is trapped within the High SMA and Low SMA lines of SSL Channel. In addition to SSL High Low and average mid line is plotted to additional reference.
Buy Sell Signals are plotted based on crossover of SMA High and Low.
Candle are Plotted Using a SMA with length of 5. This Candle Plot can be used to make an entry based on direction confirmation of SSL. keep in mind the direction of SSL Plot and the candle must be same. Preferably Entry can made above or below the midline of SSL Channel. The Candle Plot eliminates the Noise of traditional Japanese Candlesticks.
Additionally MACD Crossover and MACD Trend line confirmations can be used to confirm a Buy Sell and Entry signals
Alerts are also plotted accordingly.

[Wiseplat Sideways] v.04The Sideway indicator for TradingView is a powerful tool designed to identify periods of sideways or ranging price action in the market. With its intuitive interface and customizable parameters, traders can easily spot when an asset is consolidating, providing valuable insights for both trend-following and range-bound strategies.
This indicator utilizes really simple algorithm to analyze price movement and volatility, effectively filtering out noise and false signals. By plotting clear visual cues on the chart.
Traders can adjust the sensitivity parameters to tailor the indicator to their specific trading style and preferences. Whether used in isolation or in conjunction with other technical analysis tools, the Sideway indicator empowers traders to make informed decisions in dynamic market conditions.
Its user-friendly design and simple settings of parameters makes it accessible to traders of all levels, from beginners seeking clarity in choppy markets to seasoned professionals looking for confirmation of their analysis. With the Sideway indicator, traders can confidently navigate sideways price action and stay ahead of the curve in their trading endeavors.
Developer: Oleg Shpagin
Hulk Grid Algorithm V2 - The Quant ScienceIt's the latest proprietary grid algorithm developed by our team. This software represents a clearer and more comprehensive modernization of the deprecated Hulk Grid Algorithm. In this new release, we have optimized the source code architecture and investment logic, which we will describe in detail below.
Overview
Hulk Grid Algorithm V2 is designed to optimize returns in sideways market conditions. In this scenario, the algorithm divides purchases with long orders at each level of the grid. Unlike a typical grid algorithm, this version applies an anti-martingale model to mitigate volatility and optimize the average entry price. Starting from the lower level, the purchase quantity is increased at each new subsequent level until reaching the upper level. The initial quantity of the first order is fixed at 0.50% of the initial capital. With each new order, the initial quantity is multiplied by a value equal to the current grid level (where 1 is the lower level and 10 is the upper level).
Example: Let's say we have an initial capital of $10,000. The initial capital for the first order would be $50 * 1 = $50, for the second order $50 * 2 = $100, for the third order $50 * 3 = $150, and so on until reaching the upper level.
All previously opened orders are closed using a percentage-based stop-loss and take-profit, calculated based on the extremes of the grid.
Set Up
As mentioned earlier, the user's goal is to analyze this strategy in markets with a lack of trend, also known as sideways markets. After identifying a price range within which the asset tends to move, the user can choose to create the grid by placing the starting price at the center of the range. This way, they can consider trading the asset, if the backtesting generates a return greater than the Buy & Hold return.
Grid Configuration
To create the grid, it's sufficient to choose the starting price during the launch phase. This level will be the center of the grid from which the upper and lower levels will be calculated. The grid levels are computed using an arithmetic method, adding and subtracting a configurable fixed amount from the user interface (Grid Step $).
Example: Let's imagine choosing 1000 as the starting price and 50 as the Grid Step ($). The upper levels will be 1000, 1050, 1100, 1150, 1200. The lower levels will be 950, 900, 850, 800, and 750.
Markets
This software can be used in all markets: stocks, indices, commodities, cryptocurrencies, ETFs, Forex, etc.
Application
With this backtesting software, is possible to analyze the strategy and search for markets where it can generate better performance than Buy & Hold returns. There are no alerts or automatic investment mechanisms, and currently, the strategy can only be executed manually.
Design
Is possible to modify the grid style and customize colors by accessing the Properties section of the user interface.

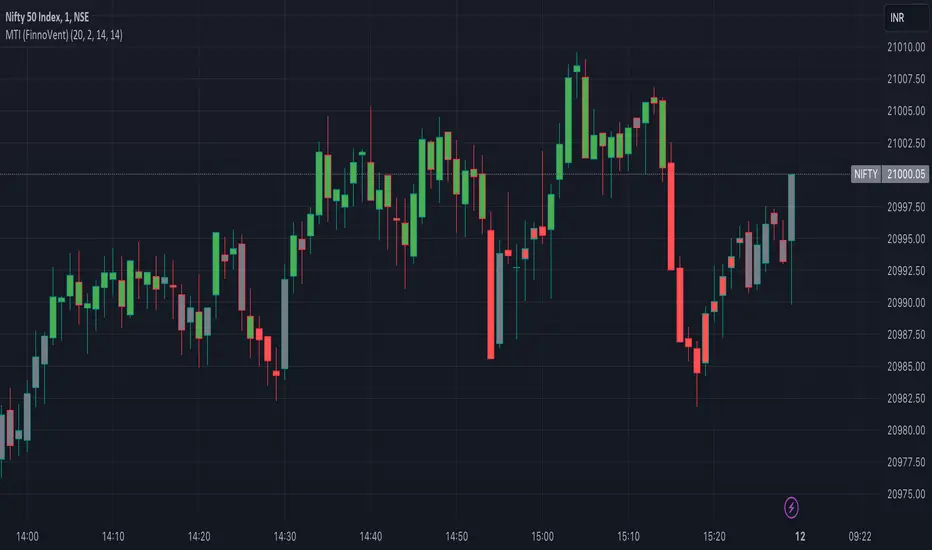
Market Trend Indicator (FinnoVent)The Market Trend Indicator (FinnoVent) is a comprehensive trading tool designed to provide clear visual cues for market trends on TradingView charts. This indicator combines the principles of Exponential Moving Averages (EMAs), Bollinger Bands, the Average Directional Index (ADX), and the Relative Strength Index (RSI) to offer a nuanced view of market movements.
How It Works:
Trend Identification with EMAs: The indicator uses two EMAs (3-period and 30-period) to identify the primary trend. An upward trend is signaled when the 3-period EMA crosses above the 30-period EMA, while a downward trend is indicated when the 3-period EMA crosses below the 30-period EMA.
Sideways Market Detection: To identify sideways trends, the indicator employs Bollinger Bands, ADX, and RSI. A sideways (or consolidating) market condition is identified when:
The price is between the middle 60% of the Bollinger Bands (avoiding the top and bottom 20%).
The ADX is below 30, indicating a lack of a strong trend.
The RSI is between 40 and 60, suggesting a neutral market momentum.
Visual Representation:
Bar Colors: The indicator colors the price bars on the chart based on the identified trend:
Green Bars: Indicate an upward trend.
Red Bars: Indicate a downward trend.
Grey Bars: Indicate a sideways or consolidating market.
How to Use:
Trend Following: Use the colored bars as a guide for trend following. Green bars suggest a potential entry for a long position, while red bars may indicate opportunities for short positions.
Sideways Market Caution: Grey bars signal a sideways market. In such conditions, traders might exercise caution and avoid trend-following strategies, as the market lacks a clear direction.
Complementary Analysis: While the Market Trend Indicator (FinnoVent) provides valuable insights, it's recommended to use it in conjunction with other forms of analysis (like fundamental analysis, other technical indicators, or price action) for comprehensive decision-making.
Suitable for: This indicator is versatile and can be applied to various timeframes and trading instruments, including stocks, forex, commodities, and indices.
Important Notes:
The indicator is designed to minimize repainting but always consider the latest data for the most accurate analysis.
Like all indicators, it is not foolproof. It works best when combined with a solid trading plan and risk management strategies.
RSI Trend Detector PSAR BasedRSI Trend Detector is based on the Direction of PSAR. This indicator helps the easy detection of Trend Direction and Sideways Movement of Price. It was difficult to determine the RSI Trend Direction in a basic RSI indicator. one cannot decide the exact entry point where to enter.
RSI Trend Detector helps with the direction of trend using PSAR direction which is almost instant direction changing indicator with Zero Lag. The color of the RSI changes immediately based on PSAR direction. One can determine the trend whether its in UP / Down or Sideways.
One can easily detect Pullback and entry points using this indicator.
The basic working can be interpreted with a normal default RSI, The only additional feature is the direction of trend using a SAR signal.
Oversold Zone is below 30
Overbought Zone is above 70
how ever RSI above 50 is treated a UP trend and Below 50 as Down Trend.
when RSI is between 40 and 60 price must be considered as Sideways. One can easily interpret the TREND.
Yellow Line = RSI Moving Average
RED and Green Line= RSI
Grey Zone = Sideways
Horizontal line = RSI level 50
Settings can be changed as required.
RSI Line:
RSI Above 50 up trend and Entry when color is green
RSI Below 50 down trend and Entry when color is Red
RSI in Grey Zone is sideways, wait for a breakout
RSI above 50 and color is red then its a pullback in uptrend
RSI below 50 and color is green then its a pullback in downtrend
ALERTS:
Up signal and Down Signal are provided when ever RSI crosses RSIMA
Up Signal: RSI crosses RSI Moving Average upwards
Down Signal: RSI crosses RSI Moving Average Downwards
Hope the Tradingview community likes this.

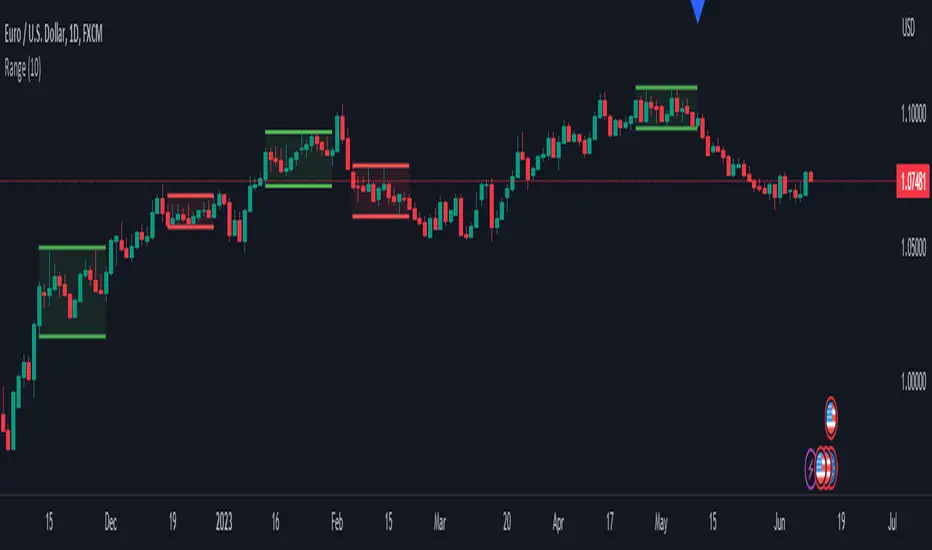
IND-Range Box [Salar Kamjoo]Hello to all dear traders,
One of the trading methods in financial markets is Range Box Trading. Ranges are specific price levels where the market reaches equilibrium, meaning the buying force is roughly equal to the selling force. Consequently, the market neither moves significantly upwards nor downwards; it oscillates within a particular range. The indicator I have designed for you is based on this concept. It utilizes the number of candles and their oscillations to identify specific ranges on the chart. These ranges are drawn based on the maximum and minimum of the box.
The optimal time for trading and using this indicator is when the market is less volatile, specifically outside of the overlapping London and New York sessions. Additionally, be cautious during news releases as they might lead to stop-hunting scenarios. Therefore, the best time to employ this indicator is when the market is relatively calm.
This indicator has 4 settings:
Setting Number 1: Number of Candles
This setting determines the number of candles involved in calculating the range boxes. A higher value indicates longer range boxes will be identified for you, while a lower value results in quicker recognition of range boxes. However, a smaller value may reduce the reliability of the identified range boxes. The recommended value for this setting may vary for each currency pair and time frame.
s3.tradingview.com
Setting Number 2: Range Percentage
This setting determines the maximum percentage difference between the high and low of the identified range box. (These settings are interconnected with Setting Number 3, as your choice in Setting Number 3—whether to base the range box calculation on the high or low, or on the candle close—will impact how this range percentage is applied.)
s3.tradingview.com
Setting Number 3: Calculation Basis
This setting determines whether the maximum width of the range box is based on the highest or lowest points, or if it is calculated based on the closing prices of the candles.
s3.tradingview.com
s3.tradingview.com
Setting Number 4: Number of Extended Candles
This visual setting determines the extension of your range box forward by a specified number of candles.
Another valuable feature of this indicator is the ability to configure alerts. By setting up alerts, you can promptly receive notifications whenever a range box is identified on the chart. This ensures that you are promptly informed about potential trading opportunities.
If you have any questions feel free to ask in the comments section.
be profitable :)

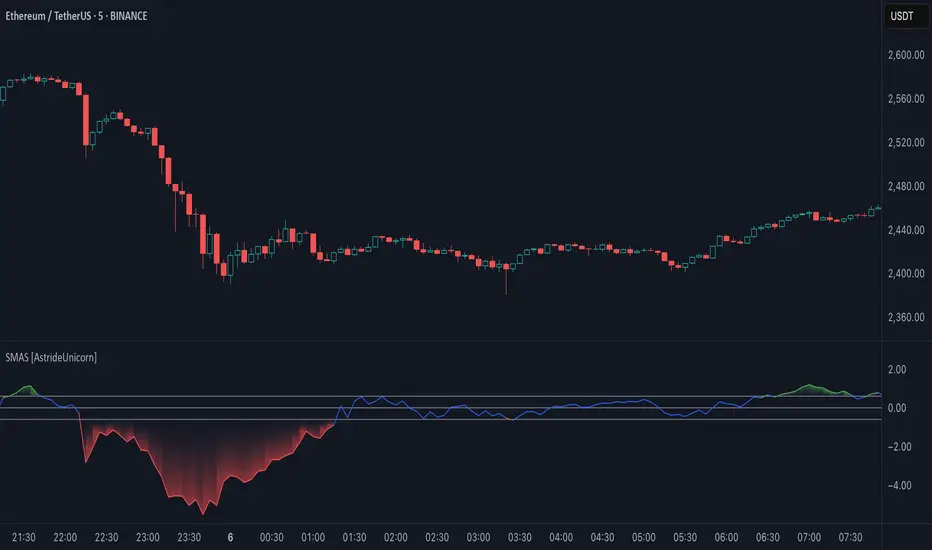
Simple Moving Average Slope [AstrideUnicorn]The Simple Moving Average Slope indicator (SMAS) is a technical analysis tool designed to help traders detect the direction and strength of the current trend in the price of an asset. It is also a great tool for identifying sideways markets. The indicator plots the slope of a simple moving average (SMA) of the closing prices over a specified time period. The slope is normalized by dividing it by the standard deviation of the slope over a longer time period.
HOW TO USE
Traders can use the Simple Moving Average Slope indicator in various ways. One common way is to look for bullish or bearish signals. A bullish signal occurs when the normalized slope rises above a predetermined threshold, resulting in the indicator turning green, indicating an upward trend in the market. Conversely, a bearish signal is generated when the normalized slope falls below the negative value of the threshold, causing the indicator to turn red, signaling a downtrend in the market. When the normalized slope falls between the positive and negative threshold values, a neutral signal is generated, indicating that the market is moving sideways. This can help traders avoid false trend signals from other indicators and strategies that may occur when the market is in a sideways regime. Additionally, traders can use the Simple Moving Average Slope indicator in conjunction with other technical indicators to confirm the trend direction.
SETTINGS
Window - specifies the number of bars used to calculate the SMA slope. The default value is 20.
Threshold - specifies the threshold value used to generate the bullish and bearish signals. The default value is 0.6. Traders can adjust these settings based on their trading strategy and the asset being analyzed.
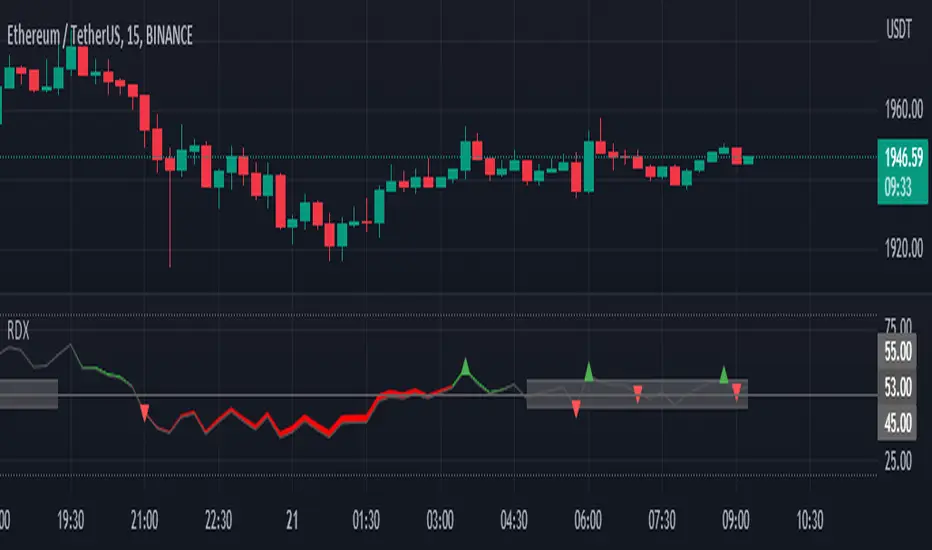
RDX Relative Directional IndexRDX Relative Directional Index, Strength + Direction + Trend. This indicator is the combination of RSI and DMI or ADX. RDX aims at providing Relative direction of the price along with strength of the trend. This acts as both RSI and Average Directional Index. as the strength grows the RSI line becomes wider and when there is high volatility and market fluctuation the line becomes thinner. Color decides the Direction. This indicator provides sideways detection of RSI signal.
RDX Width: This determines the strength of RSI and Strength of ADX, The strength grows RDX band grows wider, as strength decreases band shrinks and merge into the RSI line. for exact working simply disable RSI plot on the indicator. when there is no strength the RSI vanishes..
Technical:
RSI : with default 14 period
ADX : Default 14 period
RDX=RSI+(ADX-20)/5
Color Code:
Red: Down Direction
Green: Up Direction
Sideways:
A rectangular channel is plotted on RSI 50 Level
Oversold Overbought:
Oversold and Overbought Levels are plotted for normal RSI Oversold and Overbought detection.
Buy/Sell:
Buy sell signals from ADX crossover are plotted and its easy to determine
Strength + Direction + Trend in one go
Hope the community likes this...
Contibute for more ideas and indicators..
SuperCloudSupercloud is a MA based Trend Representation. Its different from a normal MA Cloud. Cloud starts from '0' level and rise or fall based on price.
Supercloud is plotted based on the difference of the price movement between various MA's of different length. All MA's are plotted with reference to EMA 200. So when the MA's converge or Diverge or Bounce back we can still be in the Trend unless the Cloud goes below or above Zero Line.
works in all Timeframes.
Up Trend:
-> All MA's are Above Zero and Cloud color is complete green
-> A decrease in Cloud Volume indicates a weaker Momentum
Down Trend:
-> All MA's are Below Zero and Cloud color is complete red
-> A decrease in Cloud Volume indicates a weaker Momentum
Sideways:
-> A Mixed color indicates a Sideways moment.
Cloud Outlines:
1) The outer edge of Cloud shows the actual trend.
2) its based on MA-5, when price is above MA 5 or Below MA 5 a bright green and bright red outlines are plotted.
Buy Signals Confirmation:
upper Outer Cloud must be Bright Green
Cloud under must be fully Shaded Green
Alternatively EMA crossover can be used and confirmed.
Sell Signals Confirmation:
lower Outer Cloud must be Bright Red
Cloud under must be fully Shaded Red
Alternatively EMA cross under can be used and confirmed.
MACD
MACD is also plotted within the cloud.
Color ribbon is used to plot MACD
Histogram is not present. Instead use the width of the MACD Ribbon
Correspondingly Outer Cloud represents the Histogram.
Zero Line:
Zero line is actually EMA5 which is to be treated as EMA200 for our visual representation.
A sideway channel is plotted around Zero line.
When price reaches this sideways Zone price usually get rejections and starts moving side ways.
Trend is established only after price crosses the sideway band.
Sideway is calculated based on mintick of the Asset which varies. a min value equivalent to 10EMA or value 10 must be used for better usage.

ADX Trend FilterADX Trend Filter Indicator is a traditional ADX indicator with a different presentation. its consist of two indicators EMA TREND and ADX / DMI
About Indicator:
1. BAND / EMA band to represent EMA Trend of EMA-12 and EMA-50
(Band is plotted at level-20 which is the Threshold level of DMI / ADX indicator)
2. Histogram showing the direction of ADX / DMI trend
3. Area behind the histogram showing ADX/DMI strength
How to use?
1. Histogram represents current Trend Red for Bearish / Green for Bullish
2. Area behind the histogram represents Strength of ADX / DMI Threshold level is 0-20(represented as band). (Area below the Band is Sideways)
3. Band represents the current MA Trend.
4. Buy Sell signals are plotted as triangles in red/green obtained from ADX / DMI Crossovers
Buy Signal (Green Triangle on band- ADX Crossover)
1.Band below Histogram must be Green
2.Histogram must be green
3.Area behind histogram must be above the lower trend band (20level) and visible
Sell Signal (Red Triangle on band- ADX Crossover)
1.Band below Histogram must be Red
2.Histogram must be Red
3.Area behind histogram must be above the lower trend band (20level) and visible
Alerts provided for ADX crossovers.

Range DetectionThis is a simple indicator to find the sideways market or ranging market.
It is mainly focused on BTCUSD as BTCUSD doesn’t make big moves each and every candle. It makes big breakouts with one candle and then goes sideways for a longer period of time.
So, this indicator identifies those big candles and plots high and lows of those big candles using lines. New range is created only when new candles close above or below previous major candles high or low.
PSAR-Support ResistanceParabolic Support Resistance -PSAR SR is based on the Dynamic Reversal Points of Price. This indicator eliminates the false signals of regular Parabolic SAR (Stop and Reverse). The Price of previous SAR Reversal point is plotted as Support and Resistance. The idea is to trade only after the previous reversal point is crossed and a new candle formation above / below the support resistance lines.
Price moves sideways in between the S/R Lines mostly.
Buy and Sell Signals are based on normal P-SAR settings however this S/R must be considered. Please be aware that the indicator cannot be used as a stand alone. Please make required confirmations before going into action.
Disclaimer: Please use it at your own Risk.

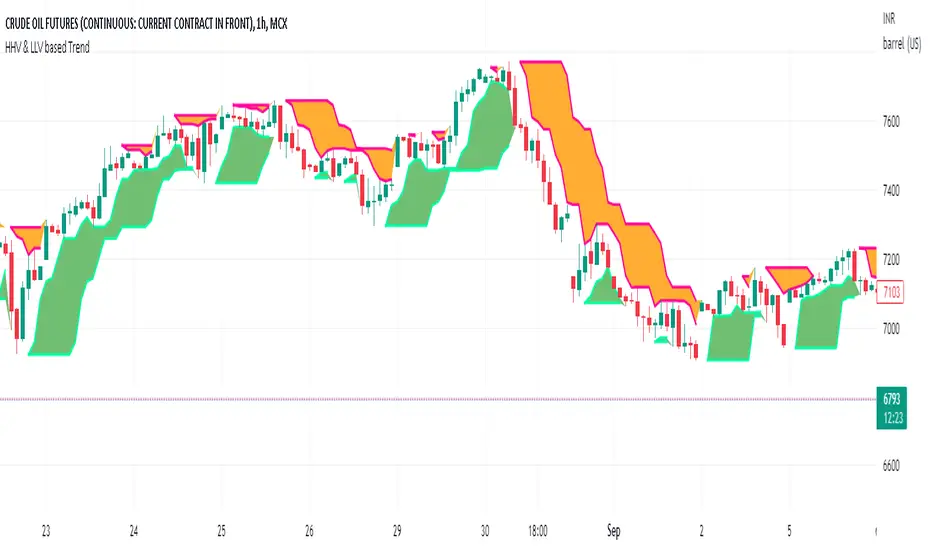
HHV & LLV based TrendHHV and LLV gives good information about the trend.
A trend will be visible when its seen with fast and slow line cross
UP trend: HHV_fastline = HHV Slowline and LLVfastline crossover LLVSlowline
DOWN trend: HHV_fastline crossunder HHV Slowline and LLVfastline !=LLVSlowline
Attempted to plot the same with multiple options to choose fastline length, slowline length, Multi time frame.
Waddah Attar Explosion V3 [NHK] -Bollinger - MACDWaddah Attar Explosion Version3 indicator to work in Forex and Crypto, This indicator oscillates above and below zero and the Bollinger band is plotted over the MACD Histogram to take quick decisions, Colors are changed for enhanced look. dead zone is plotted in a background area and option is provided to hide dead zone. One can easily detect sideways market movement using Bollinger band and volume. when volume is in between Bollinger band no trades are to be taken as volume is low and market moving in sideways
credits to: @shayankm and @LazyBear
Read the main description below...
- - - - - - - - - - - - - - - - - - - - - - - - - - - - - - - - - - - - - - -
This is a port of a famous MT4 indicator. This indicator uses MACD /BB to track trend direction and strength. Author suggests using this indicator on 30mins.
Explanation from the indicator developer:
"Various components of the indicator are:
Dead Zone Line: Works as a filter for weak signals. Do not trade when the up or down histogram is in between Dead Zone.
Histograms:
- Pink histogram shows the current down trend.
- Blue histogram shows the current up trend.
- Sienna line / Bollinger Band shows the explosion in price up or down.
Signal for ENTER_BUY: All the following conditions must be met.
- Blue histogram is raising.
- Blue histogram above Explosion line.
- Explosion line raising.
- Both Blue histogram and Explosion line above DeadZone line.
Signal for EXIT_BUY: Exit when Blue histogram crosses below Explosion line / Bollinger Band.
Signal for ENTER_SELL: All the following conditions must be met.
- Pink histogram is raising.
- Pink histogram above Explosion line.
- Explosion line raising.
- Both Pink histogram and Explosion line above DeadZone line.
Signal for EXIT_SELL: Exit when Pink histogram crosses below Explosion line.
All of the parameters are configurable via options page. You may have to tune it for your instrument.

RSI Rising Crypto Trending AlertAlert version of the strategy with the same name
This is crypto and stock market trending strategy designed for long timeframes such as 4h+
From my tests it looks like it works better to trade crypto against crypto than trading against fiat.
Indicators used:
RSI for rising/falling of the trend
BB sidemarket
ROC sidemarket
Rules for entry
For long: RSI values are rising, and bb and roc tells us we are not in a sidemarket
For long: RSI values are falling, and bb and roc tells us we are not in a sidemarket
Rules for exit
We exit when we receive an opposite direction.
Cuation: Because this strategy uses no risk management, I recommend you takje care with it.
If you have any questions, let me know !

Sideways Strategy DMI + Bollinger Bands (by Coinrule)Markets don’t always trade in a clear direction. At a closer look, most of the time, they move sideways. Relying on trend-following strategies all the time can thus lead to repeated false signals in such conditions.
However, before you can safely trade sideways, you have to identify the most suitable market conditions.
The main features of such strategies are:
Short-term trades, with quick entries and quick exits
Slightly contrarian and mean-reversionary
Require some indicator that tells you it’s a sideways market
This Sideways DMI + Bollinger Bands strategy incorporates such features to bring you a profitable alternative when the regular trend-following systems stop working.
ENTRY
1. The trading system requires confirmation for a sideways market from the Directional Movement Index (DMI) before you can start opening any trades. For this purpose, the strategy uses the absolute difference between positive and negative DMI, which must be lower than 20.
2. To pick the right moment to buy, the strategy looks at the Bollinger Bands (BB). It enters the trade when the price crosses over the lower BB.
EXIT
The strategy then exits when the move has been exhausted. Generally, in sideways markets, the price should revert lower. The position is closed when the price crosses back down below the upper BB.
The best time frame for this strategy based on our backtest is the 1-hr. Shorter timeframes can also work well on certain coins that are more volatile and trade sideways more often. However, as expected, these exhibit larger volatility in their returns. In general, this approach suits medium timeframes. A trading fee of 0.1% is taken into account. The fee is aligned to the base fee applied on Binance, which is the largest cryptocurrency exchange.
You can execute this strategy on your favourite exchange at coinrule.com.

Sideways detection bollinger bandsSideways detection indicator using Bollinger bands .
In this case we take the original ratio between lower and upper and we smooth it even harder in order to get a better idea about the accuracy of the trend.
If the initial ratio is not between 0 and 1 and the smooth ratio is higher than our selected value, we get an idea if we are a in trending market or not.
Of course using it as a standalone has no usage, and it has to be combined with other tools like moving average, oscillators and so on.
IF you have any questions let me know

Trend Type Indicator by BobRivera990Usage:
The purpose of this indicator is to programmatically determine the type of price trend using technical analysis tools.
You can do a quick check on the asset’s higher and lower time frames. For example, if you are trading on an H1 chart, you can check the m5 chart to ensure that the trend is in the same direction and similarly check the H4 chart to ensure that the higher time frame price is also moving in the same direction.
If multiple time frame charts confirm a similar trend, then it is considered a very strong trend and ideal for Trend trading.
Remarks:
By default, the last status is related to 8 periods before the latest closing price.
Related definitions:
The three basic types of trends are up, down, and sideways.
1. Uptrend
An uptrend describes the price movement of a financial asset when the overall direction is upward. The uptrend is composed of higher swing lows and higher swing highs.
Some market participants ("long" trend traders) only choose to trade during uptrends.
2. Downtrend
A downtrend refers to the price action of a security that moves lower in price as it fluctuates over time.
The downtrend is composed of lower swing lows and lower swing highs.
3. Sideways
A sideways trend is the horizontal price movement that occurs when the forces of supply and demand are nearly equal. This typically occurs during a period of consolidation before the price continues a prior trend or reverses into a new trend.
How it works:
Step 1: Sideways Trend Detection
In this step we want to distinguish the sideways trend from uptrend and downtrend. For this purpose, we use two common technical analysis tools: ATR and ADX
1. Average True Range (ATR)
The average true range (ATR) is a technical analysis indicator that measures market volatility.
We also use a 20-period moving average of the ATR.
When the ATR is below the average of its last 20-periods, it means that the rate of price volatility has decreased and we conclude that the current trend is sideways
2. Average Directional Index (ADX)
The average directional index (ADX) is a technical analysis indicator used by some traders to determine the strength of a trend.
The trend has strength when ADX is above 25.
So when the ADX is less than or equal to 25, there is no strong trend, and we conclude that the current type of trend is sideways.
Step 2: Detect uptrend from downtrend
If it turns out that the current price trend is not sideways, then it is either uptrend or downtrend.
For this purpose, we use plus and minus directional Indicators (+ DI & -DI).
A general interpretation would be that during a strong trend, when +DI is higher than -DI, it is an uptrend. When -DI is higher than +DI, it is a downtrend.
Parameters:
"Use ATR …" ________________________// Use Average True Range (ATR) to detect Sideways Movements
"ATR Length"_______________________ // length of the Average True Range (ATR) used to detect Sideways Movements
"ATR Moving Average Type" ___________// Type of the moving average of the ATR used to detect Sideways Movements
"ATR MA Length" ____________________// length of the moving average of the ATR used to detect Sideways Movements
"Use ADX ..."_______________________ // Use Average Directional Index (ADX) to detect Sideways Movements
"ADX Smoothing”____________________// length of the Average Directional Index (ADX) used to detect Sideways Movements
"DI Length"_________________________// length of the Plus and Minus Directional Indicators (+DI & -DI) used to determine the direction of the trend
"ADX Limit" ________________________// A level of ADX used as the boundary between Trend Market and Sideways Market
"Smoothing Factor"__________________// Factor used for smoothing the oscillator
"Lag"______________________________// lag used to match indicator and chart
Resources:
www.investopedia.com

(IK) Grid ScriptThis is my take on a grid trading strategy. From Investopedia:
"Grid trading is most commonly associated with the foreign exchange market. Overall the technique seeks to capitalize on normal price volatility in an asset by placing buy and sell orders at certain regular intervals above and below a predefined base price."
This strategy is best used on sideways markets, without a definitive up or down major trend. Because it doesn't rely on huge vertical movement, this strategy is great for small timeframes. It only goes long. I've set initial_capital to 100 USD. default_qty_value should be your initial capital divided by your amount of grid lines. I'm also assuming a 0.1% commission per trade.
Here's the basic algorithm:
- Create a grid based on an upper-bound (strong resistance) and a lower-bound (strong support)
- Grid lines are spaced evenly between these two bounds. (I recommend anywhere between 5-10 grid lines, but this script lets you use up to 15. More gridlines = more/smaller trades)
- Identify nearest gridline above and below current price (ignoring the very closest grid line)
- If price crosses under a near gridline, buy and recalculate near gridlines
- If price crosses over a near gridline, sell and recalculate near gridlines
- Trades are entered and exited based on a FIFO system. So if price falls 3 grid lines (buy-1, buy-2, buy-3), and subsequently crosses above one grid line, only the first trade will exit (sell-1). If it falls again, it will enter a new trade (buy-4), and if it crosses above again it will sell the original second trade (sell-2). The amount of trades you can be in at once are based on the amount of grid lines you have.
This strategy has no built-in stop loss! This is not a 'set-it-and-forget-it" script. Make sure that price remains within the bounds of your grid. If prices exits above the grid, you're in the money, but you won't be making any more trades. If price exits below the grid, you're 100% staked in whatever you happen to be trading.
This script is more complicated than my last one, but should be more user friendly. Make sure to correctly set your lower-bound and upper-bound based on strong support and resistance (the default values for these are probably going to be meaningless). If you change your "Grid Quantity" (amount of grid lines) make sure to also change your 'Order Size' property under settings for proper test results (or default_qty_value in the strategy() declaration).
