ML Compressor Enhanced Trading Indicator# 🤖 ML Enhanced Trading Indicator - Advanced Market Analysis
## 📊 Overview
This is a comprehensive Machine Learning Enhanced Trading Indicator that combines multiple advanced analytical techniques to provide high-probability trading signals. The indicator uses artificial intelligence, pattern recognition, anomaly detection, and traditional technical analysis to identify optimal entry and exit points in the market.
## 🚀 Key Features
### 🧠 **Machine Learning Core**
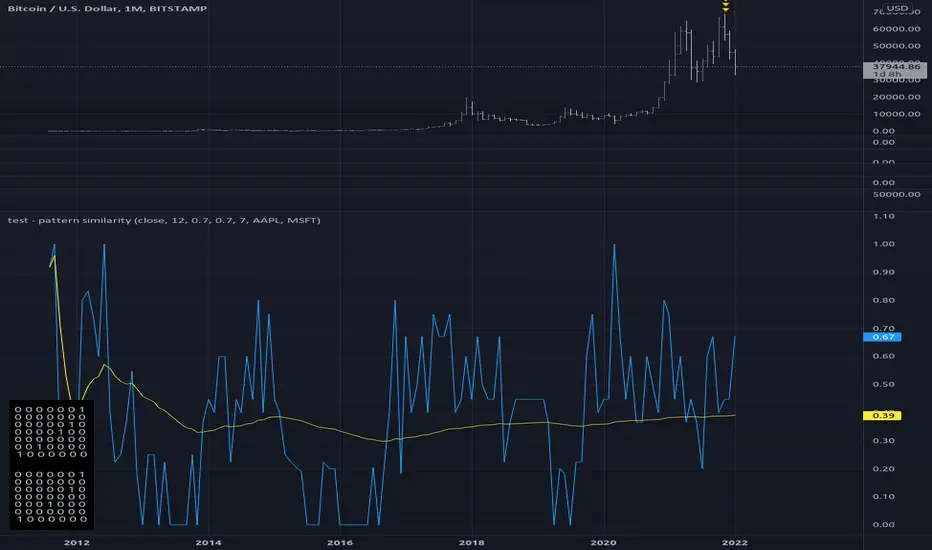
- **Advanced Pattern Recognition**: Uses cosine similarity, Pearson correlation, and Spearman rank correlation to identify historical patterns
- **AI-Powered Predictions**: Implements multiple correlation methods to forecast price movements
- **Anomaly Detection**: Z-score based detection system for unusual market activities
- **Signal Confidence Scoring**: Reliability assessment for each trading signal
### 📈 **Technical Analysis Integration**
- **Multi-Timeframe RSI Analysis**: 14 and 21-period RSI with oversold/overbought detection
- **MACD Momentum**: Enhanced MACD histogram analysis for trend confirmation
- **Bollinger Bands Position**: Dynamic position tracking within BB channels
- **Volume Analysis**: Spike and dry volume detection with ratio calculations
- **Trend Strength Measurement**: EMA-based trend power analysis
### 🎯 **Perfect Zone Detection**
- **Ideal Buy Zone**: Identifies perfect buying opportunities when 7 conditions align:
- ML Score ≥ 0.60
- Bottom proximity detection
- RSI in 20-35 range
- Volume spike confirmation
- Positive price anomaly
- Bullish pattern match
- Positive MACD momentum
### 📊 **Comprehensive Display Table**
- **Real-time ML Analysis**: Complete breakdown of all indicators
- **Perfect Buy Conditions Tracker**: Visual checklist with completion percentage
- **Performance Metrics**: Win rate tracking and P&L analysis
- **Signal Strength Indicators**: Confidence levels for each signal
## 🔧 **Customizable Parameters**
### **ML Settings**
- **ML Lookback Period**: 20-500 bars (default: 100)
- **Anomaly Threshold**: 1.0-5.0 sensitivity (default: 2.0)
- **Pattern Similarity**: 0.5-0.99 matching threshold (default: 0.80)
- **AI Lookback Period**: 20-200 bars (default: 50)
### **AI Prediction Models**
- **Correlation Methods**: Spearman, Pearson, Cosine Similarity
- **Forecast Length**: 15-250 bars (default: 50)
- **Similarity Type**: Price or %Change analysis
### **Visual Options**
- **Table Position**: Top/Bottom Left/Right positioning
- **Table Size**: Small, Normal, Large options
- **Signal Display**: Toggle buy/sell signals on/off
- **AI Visualization**: Optional prediction paths and ZigZag
## 📋 **How to Use**
### **For Beginners**
1. Add the indicator to your chart
2. Look for "PERFECT BUY" signals in the table
3. Wait for completion percentage ≥ 85% for highest probability trades
4. Use the background color changes as visual confirmation
### **For Advanced Traders**
1. Analyze individual ML components in the detailed table
2. Monitor anomaly detection for unusual market conditions
3. Use pattern confidence levels for trade timing
4. Combine with your existing strategy for confirmation
### **Signal Interpretation**
- **🟢 PERFECT BUY**: All 7 conditions met - highest probability reversal
- **🟡 NEAR BOTTOM**: Close to ideal conditions - monitor closely
- **🔴 NOT READY**: Wait for better setup
- **Strong Buy/Sell Signals**: ML score-based entries with high confidence
## ⚠️ **Important Notes**
### **Risk Management**
- This indicator provides analysis and signals, not guaranteed outcomes
- Always use proper risk management and position sizing
- Consider market conditions and fundamental factors
- Backtest the strategy on your preferred timeframes and assets
### **Best Practices**
- Use multiple timeframe analysis for confirmation
- Combine with support/resistance levels
- Monitor volume confirmation for all signals
- Set appropriate stop-losses and profit targets
### **Performance Tracking**
- The indicator tracks its own performance with win rate calculations
- Monitor the "AI Prediction" accuracy percentage
- Use the P&L tracking to assess signal quality over time
## 🔄 **Updates and Improvements**
This indicator is continuously evolving with:
- Enhanced machine learning algorithms
- Improved pattern recognition capabilities
- Additional correlation methods for better accuracy
- Performance optimization for faster calculations
- New visualization features based on user feedback
## 📚 **Technical Details**
### **Machine Learning Implementation**
- **Pattern Matching**: 20-bar normalized price patterns with historical comparison
- **Correlation Analysis**: Mathematical similarity scoring between current and historical patterns
- **Anomaly Detection**: Statistical Z-score analysis across price, volume, and RSI
- **Signal Weighting**: Multi-factor scoring system with optimized weights
### **Algorithm Components**
1. **Feature Extraction**: Price, volume, momentum, volatility, and trend features
2. **Pattern Recognition**: Historical pattern database with similarity matching
3. **Anomaly Detection**: Multi-dimensional Z-score threshold analysis
4. **Signal Generation**: Weighted scoring system with confidence intervals
5. **Performance Tracking**: Real-time win rate and accuracy monitoring
### **Calculation Methods**
- **Trend Strength**: (EMA8 - EMA21) / EMA21 * 100
- **Volume Ratio**: Current Volume / 20-period SMA Volume
- **BB Position**: (Close - BB_Lower) / (BB_Upper - BB_Lower)
- **Anomaly Score**: Average of normalized Z-scores for price, volume, and RSI
## 🎨 **Visual Elements**
### **Background Colors**
- **Light Green**: Perfect buy zone detected
- **Light Red**: Perfect sell zone detected
- **Light Blue**: Near bottom proximity
- **Green/Red Transparency**: Price anomaly detection
### **Signal Shapes**
- **Green Triangle Up**: Strong buy signal
- **Red Triangle Down**: Strong sell signal
- **Aqua Diamond**: Perfect buy zone entry
- **Purple Diamond**: Perfect sell zone entry
### **Table Information**
- **ML Complete Analysis**: 16 comprehensive metrics
- **Perfect Buy Conditions**: 7-point checklist with status indicators
- **Real-time Values**: Live updating of all calculations
- **Color-coded Status**: Green (good), Yellow (moderate), Red (caution)
## 🔍 **Troubleshooting**
### **Common Issues**
- **Table Not Showing**: Enable "Show ML Table" in settings
- **No Signals Appearing**: Check "Show Buy/Sell Signals" option
- **Performance Issues**: Reduce ML Lookback Period for faster calculation
- **Too Many/Few Signals**: Adjust Anomaly Threshold sensitivity
### **Optimization Tips**
- **For Day Trading**: Use lower timeframes (1m, 5m, 15m) with reduced lookback periods
- **For Swing Trading**: Use higher timeframes (1h, 4h, 1D) with standard settings
- **For Scalping**: Enable only strong signals and reduce pattern similarity threshold
- **For Long-term**: Increase all lookback periods and use daily/weekly timeframes
## 📖 **Disclaimer**
This indicator is for educational and informational purposes only. It should not be considered as financial advice. Trading involves substantial risk of loss and is not suitable for all investors. Past performance does not guarantee future results.
### **Risk Warning**
- All trading involves risk of substantial losses
- Never risk more than you can afford to lose
- This indicator does not guarantee profitable trades
- Always use proper risk management techniques
- Consider consulting with a financial advisor
### **Liability**
The creator of this indicator is not responsible for any losses incurred from its use. Users should thoroughly test and understand the indicator before using it with real money.
### **Feature Requests**
- Suggest improvements through TradingView comments
- Report bugs with detailed descriptions
- Share successful strategies using the indicator
- Contribute to community discussions
## 🏆 **Credits and Acknowledgments**
This indicator builds upon various open-source libraries and mathematical concepts:
- TradingView ZigZag library for visualization
- Statistical correlation methods from academic research
- Machine learning concepts adapted for financial markets
- Community feedback and testing contributions
## 📈 **Performance Metrics**
The indicator includes built-in performance tracking:
- **Win Rate Calculation**: Percentage of profitable signals
- **Signal Accuracy**: ML prediction vs actual price movement
- **Drawdown Tracking**: Current unrealized P&L from last signal
- **Completion Percentage**: How many perfect conditions are met
## 🔬 **Mathematical Foundation**
### **Correlation Calculations**
- **Pearson**: Measures linear correlation between patterns
- **Spearman**: Rank-based correlation for non-linear relationships
- **Cosine Similarity**: Vector-based similarity for pattern matching
### **Statistical Methods**
- **Z-Score**: (Value - Mean) / Standard Deviation
- **Pattern Normalization**: Price / Price
- **Volatility Percentile**: Historical ranking of current volatility
- **Momentum Calculation**: Price change over multiple periods
## 🎯 **Trading Strategies**
### **Conservative Approach**
- Wait for Perfect Buy Zone (85%+ completion)
- Use higher timeframes for confirmation
- Set stop-loss at recent swing low
- Take profits at resistance levels
### **Aggressive Approach**
- Trade on Strong Buy/Sell signals
- Use lower completion thresholds (70%+)
- Tighter stop-losses with faster exits
- Higher position sizes with confirmed trends
### **Hybrid Strategy**
- Combine with other indicators for confirmation
- Use different settings for different market conditions
- Scale in/out based on signal strength
- Adjust parameters based on market volatility
Similarity

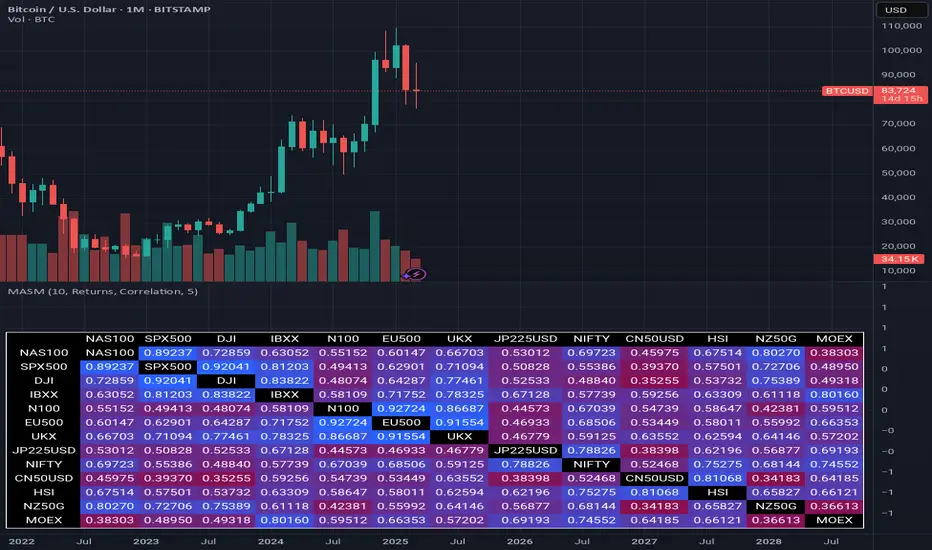
Multi Asset Similarity MatrixProvides a unique and visually stunning way to analyze the similarity between various stock market indices. This script uses a range of mathematical measures to calculate the correlation between different assets, such as indices, forex, crypto, etc..
Key Features:
Similarity Measures: The script offers a range of similarity measures to choose from, including SSD (Sum of Squared Differences), Euclidean Distance, Manhattan Distance, Minkowski Distance, Chebyshev Distance, Correlation Coefficient, Cosine Similarity, Camberra Index, Mean Absolute Error (MAE), Mean Squared Error (MSE), Lorentzian Function, Intersection, and Penrose Shape.
Asset Selection: Users can select the assets they want to analyze by entering a comma-separated list of tickers in the "Asset List" input field.
Color Gradient: The script uses a color gradient to represent the similarity values between each pair of indices, with red indicating low similarity and blue indicating high similarity.
How it Works:
The script calculates the source method (Returns or Volume Modified Returns) for each index using the sec function.
It then creates a matrix to hold the current values of each index over a specified window size (default is 10).
For each pair of indices, it applies the selected similarity measure using the select function and stores the result in a separate matrix.
The script calculates the maximum and minimum values of the similarity matrix to normalize the color gradient.
Finally, it creates a table with the index names as rows and columns, displaying the similarity values for each pair of indices using the calculated colors.
Visual Insights:
The indicator provides an intuitive way to visualize the relationships between different assets. By analyzing the color-coded tables, traders can gain insights into:
Which assets are highly correlated (blue) or uncorrelated (red)
The strength and direction of these correlations
Potential trading opportunities based on similarities and differences between assets
Overall, MASM is a powerful tool for market analysis and visualization, offering a unique perspective on the relationships between various assets.
~llama3
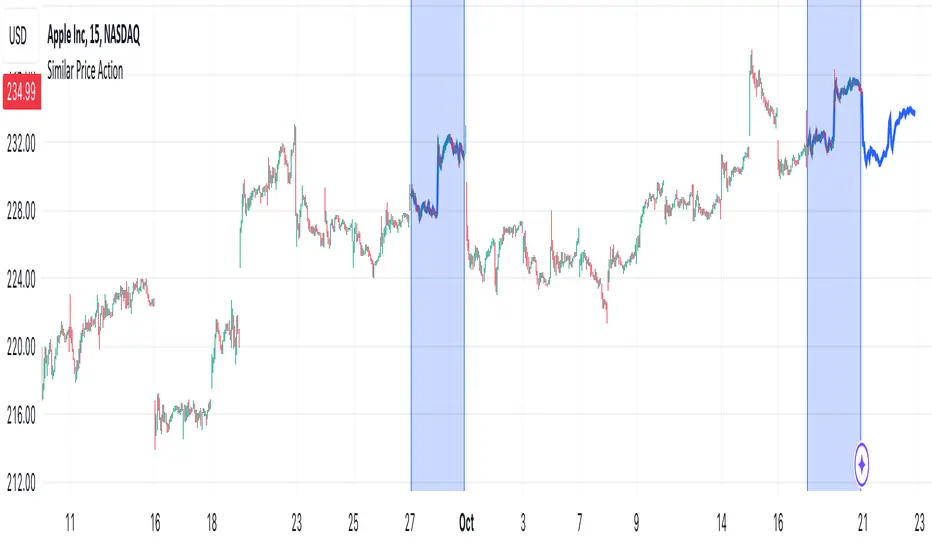
Similar Price ActionDescription:
The indicator tries to find an area of N candles in history that has the most similar price action to the latest N candles. The maximum search distance is limited to 5000 candles. It works by calculating a coefficient for each candle and comparing it with the coefficient of the latest candle, thus searching for two closest values. The indicator highlights the latest N candles, as well as the most similar area found in the past, and also tries to predict future price based on the latest price and price directly after the most similar area that was found in the past.
Inputs:
- Length -> the area we are searching for is comprised of this many candles
- Lookback -> maximum distance in which a similar area can be found
- Function -> the function used to compare latest and past prices
Notes:
- The indicator is intended to work on smaller timeframes where the overall price difference is not very high, but can be used on any
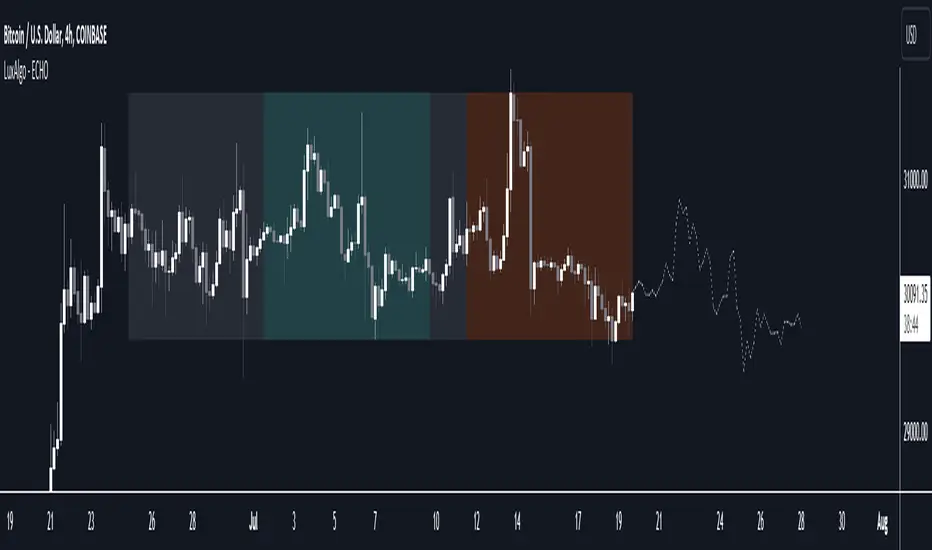
The Echo Forecast [LuxAlgo]This indicator uses a simple time series forecasting method derived from the similarity between recent prices and similar/dissimilar historical prices. We named this method "ECHO".
This method originally assumes that future prices can be estimated from a historical series of observations that are most similar to the most recent price variations. This similarity is quantified using the correlation coefficient. Such an assumption can prove to be relatively effective with the forecasting of a periodic time series. We later introduced the ability to select dissimilar series of observations for further experimentation.
This forecasting technique is closely inspired by the analogue method introduced by Lorenz for the prediction of atmospheric data.
1. Settings
Evaluation Window: Window size used for finding historical observations similar/dissimilar to recent observations. The total evaluation window is equal to "Forecast Window" + "Evaluation Window"
Forecast Window: Determines the forecasting horizon.
Forecast Mode: Determines whether to choose historical series similar or dissimilar to the recent price observations.
Forecast Construction: Determines how the forecast is constructed. See "Usage" below.
Src: Source input of the forecast
Other style settings are self-explanatory.
2. Usage
This tool can be used to forecast future trends but also to indicate which historical variations have the highest degree of similarity/dissimilarity between the observations in the orange zone.
The forecasting window determines the prices segment (in orange) to be used as a reference for the search of the most similar/dissimilar historical price segment (in green) within the gray area.
Most forecasting techniques highly benefit from a detrended series. Due to the nature of this method, we highly recommend applying it to a detrended and periodic series.
You can see above the method is applied on a smooth periodic oscillator and a momentum oscillator.
The construction of the forecast is made from the price changes obtained in the green area, denoted as w(t) . Using the "Cumulative" options we construct the forecast from the cumulative sum of w(t) . Finally, we add the most recent price value to this cumulated series.
Using the "Mean" options will add the series w(t) with the mean of the prices within the orange segment.
Finally the "Linreg" will add the series w(t) to an extrapolated linear regression fit to the prices within the orange segment.