ATR Value Number Display Only (No line chart)OVERVIEW:
The ATR (Average True Range) Value Display provides a clean, always-visible ATR reading on your chart. This essential volatility indicator helps traders set appropriate stop losses, position sizes, and profit targets based on current market volatility.
KEY FEATURES:
• Real-Time ATR Display: Shows current ATR value in a clean table format
• Customizable Appearance: Fully customizable text and background colors
• Adjustable Period: Standard 14-period default with full customization
• Bottom-Right Positioning: Non-intrusive placement that doesn't obstruct price action
• Tick Precision: Displays ATR value with accurate tick formatting
• Lightweight: Minimal resource usage with maximum clarity
HOW TO USE:
1. Add the indicator to any timeframe chart
2. Adjust ATR Length based on your trading style (14 is standard)
3. Customize colors to match your chart theme
4. Use ATR value to:
- Set stop loss distances (e.g., 1.5x ATR)
- Calculate position sizes based on risk tolerance
- Identify increasing/decreasing volatility trends
- Set realistic profit targets
SETTINGS:
• ATR Length: Calculation period (default: 14)
• Text Color: Customize the ATR text color (default: white)
• Box Color: Customize the background box color (default: semi-transparent blue)
PERFECT FOR:
✓ Position sizing based on volatility
✓ Setting dynamic stop losses that adapt to market conditions
✓ Identifying high/low volatility periods
✓ Comparing volatility across different instruments
✓ Risk management and trade planning
WHAT IS ATR?
Average True Range (ATR) measures market volatility by calculating the average range between high and low prices over a specified period. Higher ATR values indicate higher volatility, while lower values suggest calmer markets.
TIP: Use ATR on multiple timeframes to understand volatility across different trading horizons.
Simple

Rotating Messages (Rules or Motivational)This lightweight utility indicator allows you to display rotating custom text messages directly on your TradingView chart — perfect for reminders, trading rules, motivational quotes, or session notes.
You can define multiple messages separated by semicolons (;) or new lines, and the indicator will automatically cycle through them based on time or bar count. Ideal for traders who want visual cues without cluttering the chart.
⚙️ Main Features
⏱ Time-based or bar-based rotation — switch messages every X seconds (real-time) or X bars (historical/backtest mode).
📍 Flexible positioning — choose between Top Right, Bottom Right, or Bottom Center.
📏 Vertical offset — move text up or down for perfect placement on your chart.
🎨 Custom styling — set text color, background color, border visibility, and text size.
✍️ Simple message input — enter your rules or quotes in a text box with support for multi-line messages.

Name of tickerDescription:
This indicator displays the instrument’s ticker symbol and the current chart timeframe at the top center of the chart.
Features:
• Shows the ticker (e.g., BTCUSDT, AAPL, etc.).
• Displays the current timeframe (1m, 5m, 1H, 1D, etc.).
• Positioned at the top center of the chart for easy reference.
• Transparent background for minimal interference with price action.
• Lightweight and simple, no extra settings required.
Usage:
• Works with any instrument: stocks, crypto, futures.
• Useful for traders who want to always see the ticker and timeframe while analyzing the chart.
Settings:
• Text size can be adjusted in the script (text_size).
• Text and background colors can be customized (text_color, bgcolor).

Customizable Dashboard (SIMPLE)This is a custom table where you can track any ticker and it's daily change. color coded to make things easy.

Multi Averages - CustomizableThis script adds up to 5 moving averages to your plot!
Both type and length are customizable.

Uptrick: Fusion Trend Reversion SystemOverview
The Uptrick: Fusion Trend Reversion System is a multi-layered indicator designed to identify potential price reversals during intraday movement while keeping traders informed of the dominant short-term trend. It blends a composite fair value model with deviation logic and a refined momentum filter using the Relative Strength Index (RSI). This tool was created with scalpers and short-term traders in mind and is especially effective on lower timeframes such as 1-minute, 5-minute, and 15-minute charts where price dislocations and quick momentum shifts are frequent.
Introduction
This indicator is built around the fusion of two classic concepts in technical trading: identifying trend direction and spotting potential reversion points. These are often handled separately, but this system merges them into one process. It starts by computing a fair value price using five moving averages, each with its own mathematical structure and strengths. These include the exponential moving average (EMA), which gives more weight to recent data; the simple moving average (SMA), which gives equal weight to all periods; the weighted moving average (WMA), which progressively increases weight with recency; the Arnaud Legoux moving average (ALMA), known for smoothing without lag; and the volume-weighted average price (VWAP), which factors in volume at each price level.
All five are averaged into a single value — the raw fusion line. This fusion acts as a dynamically balanced centerline that adapts to price conditions with both smoothing and responsiveness. Two additional exponential moving averages are applied to the raw fusion line. One is slower, giving a stable trend reference, and the other is faster, used to define momentum and cloud behavior. These two lines — the fusion slow and fusion fast — form the backbone of trend and signal logic.
Purpose
This system is meant for traders who want to trade reversals without losing sight of the underlying directional bias. Many reversal indicators fail because they act too early or signal too frequently in choppy markets. This script filters out noise through two conditions: price deviation and RSI confirmation. Reversion trades are considered only when the price moves a significant distance from fair value and RSI suggests a legitimate shift in momentum. That filtering process gives the trader a cleaner, higher-quality signal and reduces false entries.
The indicator also visually supports the trader through colored bars, up/down labels, and a filled cloud between the fast and slow fusion lines. These features make the market context immediately visible: whether the trend is up or down, whether a reversal just occurred, and whether price is currently in a high-risk reversion zone.
Originality and Uniqueness
What makes this script different from most reversal systems is the way it combines layers of logic — not just to detect signals, but to qualify and structure them. Rather than relying on a single MA or a raw RSI level, it uses a five-MA fusion to create a baseline fair value that incorporates speed, stability, and volume-awareness.
On top of that, the system introduces a dual-smoothing mechanism. It doesn’t just smooth price once — it creates two layers: one to follow the general trend and another to track faster deviations. This structure lets the script distinguish between continuation moves and possible turning points more effectively than a single-line or single-metric system.
It also uses RSI in a more refined way. Instead of just checking if RSI is overbought or oversold, the script smooths RSI and requires directional confirmation. Beyond that, it includes signal memory. Once a signal is generated, a new one will not appear unless the RSI becomes even more extreme and curls back again. This memory-based gating reduces signal clutter and prevents repetition, a rare feature in similar scripts.
Why these indicators were merged
Each moving average in the fusion serves a specific role. EMA reacts quickly to recent price changes and is often favored in fast-trading strategies. SMA acts as a long-term filter and smooths erratic behavior. WMA blends responsiveness with smoothing in a more balanced way. ALMA focuses on minimizing lag without losing detail, which is helpful in fast markets. VWAP anchors price to real trade volume, giving a sense of where actual positioning is happening.
By combining all five, the script creates a fair value model that doesn’t lean too heavily on one logic type. This fusion is then smoothed into two separate EMAs: one slower (trend layer), one faster (signal layer). The difference between these forms the basis of the trend cloud, which can be toggled on or off visually.
RSI is then used to confirm whether price is reversing with enough force to warrant a trade. The RSI is calculated over a 14-period window and smoothed with a 7-period EMA. The reason for smoothing RSI is to cut down on noise and avoid reacting to short, insignificant spikes. A signal is only considered if price is stretched away from the trend line and the smoothed RSI is in a reversal state — below 30 and rising for bullish setups, above 70 and falling for bearish ones.
Calculations
The script follows this structure:
Calculate EMA, SMA, WMA, ALMA, and VWAP using the same base length
Average the five values to form the raw fusion line
Smooth the raw fusion line with an EMA using sens1 to create the fusion slow line
Smooth the raw fusion line with another EMA using sens2 to create the fusion fast line
If fusion slow is rising and price is above it, trend is bullish
If fusion slow is falling and price is below it, trend is bearish
Calculate RSI over 14 periods
Smooth RSI using a 7-period EMA
Determine deviation as the absolute difference between current price and fusion slow
A raw signal is flagged if deviation exceeds the threshold
A raw signal is flagged if RSI EMA is under 30 and rising (bullish setup)
A raw signal is flagged if RSI EMA is over 70 and falling (bearish setup)
A final signal is confirmed for a bullish setup if RSI EMA is lower than the last bullish signal’s RSI
A final signal is confirmed for a bearish setup if RSI EMA is higher than the last bearish signal’s RSI
Reset the bullish RSI memory if RSI EMA rises above 30
Reset the bearish RSI memory if RSI EMA falls below 70
Store last signal direction and use it for optional bar coloring
Draw the trend cloud between fusion fast and fusion slow using fill()
Show signal labels only if showSignals is enabled
Bar and candle colors reflect either trend slope or last signal direction depending on mode selected
How it works
Once the script is loaded, it builds a fusion line by averaging five different types of moving averages. That line is smoothed twice into a fast and slow version. These two fusion lines form the structure for identifying trend direction and signal areas.
Trend bias is defined by the slope of the slow line. If the slow line is rising and price is above it, the market is considered bullish. If the slow line is falling and price is below it, it’s considered bearish.
Meanwhile, the script monitors how far price has moved from that slow line. If price is stretched beyond a certain distance (set by the threshold), and RSI confirms that momentum is reversing, a raw reversion signal is created. But the script only allows that signal to show if RSI has moved further into oversold or overbought territory than it did at the last signal. This blocks repetitive, weak entries. The memory is cleared only if RSI exits the zone — above 30 for bullish, below 70 for bearish.
Once a signal is accepted, a label is drawn. If the signal toggle is off, no label will be shown regardless of conditions. Bar colors are controlled separately — you can color them based on trend slope or last signal, depending on your selected mode.
Inputs
You can adjust the following settings:
MA Length: Sets the period for all moving averages used in the fusion.
Show Reversion Signals: Turns on the plotting of “Up” and “Down” labels when a reversal is confirmed.
Bar Coloring: Enables or disables colored bars based on trend or signal direction.
Show Trend Cloud: Fills the space between the fusion fast and slow lines to reflect trend bias.
Bar Color Mode: Lets you choose whether bars follow trend logic or last signal direction.
Sens 1: Smoothing speed for the slow fusion line — higher values = slower trend.
Sens 2: Smoothing speed for the fast line — lower values = faster signal response.
Deviation Threshold: Minimum distance price must move from fair value to trigger a signal check.
Features
This indicator offers:
A composite fair value model using five moving average types.
Dual smoothing system with user-defined sensitivity.
Slope-based trend definition tied to price position.
Deviation-triggered signal logic filtered by RSI reversal.
RSI memory system that blocks repetitive signals and resets only when RSI exits overbought or oversold zones.
Real-time tracking of the last signal’s direction for optional bar coloring.
Up/Down labels at signal points, visible only when enabled.
Optional trend cloud between fusion layers, visualizing current market bias.
Full user control over smoothing, threshold, color modes, and visibility.
Conclusion
The Fusion Trend-Reversion System is a tool for short-term traders looking to fade price extremes without ignoring trend bias. It calculates fair value using five diverse moving averages, smooths this into two dynamic layers, and applies strict reversal logic based on RSI deviation and momentum strength. Signals are triggered only when price is stretched and momentum confirms it with increasingly strong behavior. This combination makes the tool suitable for scalping, intraday entries, and fast market environments where precision matters.
Disclaimer
This indicator is for informational and educational purposes only. It does not constitute financial advice. All trading involves risk, and no tool can predict market behavior with certainty. Use proper risk management and do your own research before making trading decisions.

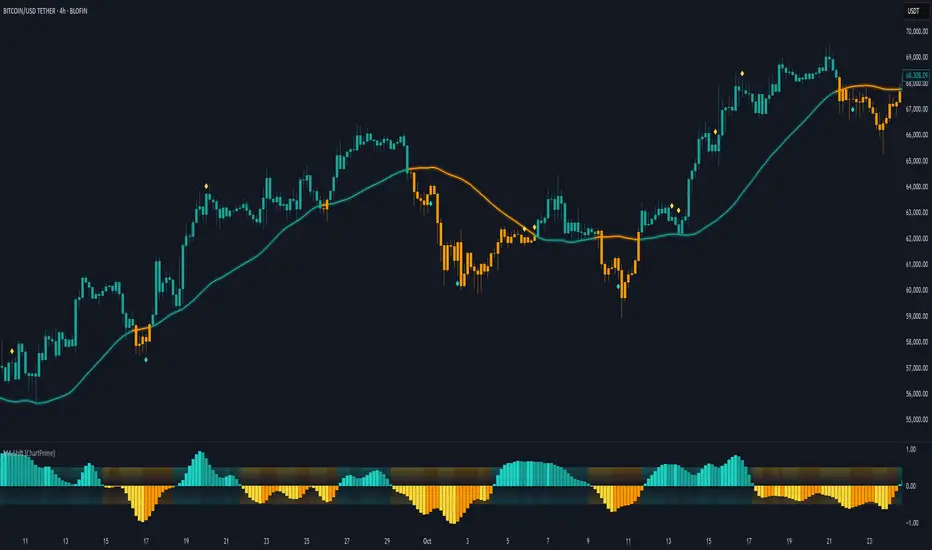
Moving Average Shift [ChartPrime]Moving Average Shift indicator combines multiple moving average (MA) types with a unique MA Shift Oscillator to help traders visualize trend direction, price deviations, and mean reversion states.
⯁ KEY FEATURES
Customizable Moving Averages: Choose from SMA, EMA, SMMA (RMA), WMA, or VWMA.
Trend-Based Coloring: Candles are dynamically colored based on price position relative to the MA.
MA Shift Oscillator: Identifies price deviations and potential mean reversion zones.
Threshold Filtering: Helps filter mean reversion signals using a user-defined threshold.
Diamond Signals for Mean Reversion: Plots diamonds on the chart when the oscillator crosses back above or below the threshold level.
Oscillator Color Coding: The oscillator has four color states:
Color 1: Above 0 and increasing.
Color 2: Above 0 and decreasing.
Color 3: Below 0 and increasing.
Color 4: Below 0 and decreasing.
⯁ HOW TO USE
Use the indicator to follow the trend based on MA direction and price relation to it.
The MA Shift Oscillator helps identify potential mean reversion points where price may revert toward the MA.
The threshold setting allows traders to filter out weak mean reversion signals and focus on significant shifts.
The four-color oscillator visually indicates trend momentum and potential trend shifts.
⯁ CONCLUSION
The Moving Average Shift indicator is a powerful tool that merges trend-following and mean reversion strategies into one comprehensive system. By allowing traders to select different types of moving averages, it provides flexibility in trend analysis while visually enhancing price action with dynamic candle coloring. The MA Shift Oscillator further strengthens decision-making by detecting deviations and highlighting potential mean reversion points.
Hybrid Triple Exponential Smoothing🙏🏻 TV, I present you HTES aka Hybrid Triple Exponential Smoothing, designed by Holt & Winters in the US, assembled by me in Saint P. I apply exponential smoothing individually to the data itself, then to residuals from the fitted values, and lastly to one-point forecast (OPF) errors, hence 'hybrid'. At the same time, the method is a closed-form solution and purely online, no need to make any recalculations & optimize anything, so the method is O(1).
^^ historical OPFs and one-point forecasting interval plotted instead of fitted values and prediction interval
Before the How-to, first let me tell you some non-obvious things about Triple Exponential smoothing (and about Exponential Smoothing in general) that not many catch. Expo smoothing seems very straightforward and obvious, but if you look deeper...
1) The whole point of exponential smoothing is its incremental/online nature, and its O(1) algorithm complexity, making it dope for high-frequency streaming data that is also univariate and has no weights. Consequently:
- Any hybrid models that involve expo smoothing and any type of ML models like gradient boosting applied to residuals rarely make much sense business-wise: if you have resources to boost the residuals, you prolly have resources to use something instead of expo smoothing;
- It also concerns the fashion of using optimizers to pick smoothing parameters; honestly, if you use this approach, you have to retrain on each datapoint, which is crazy in a streaming context. If you're not in a streaming context, why expo smoothing? What makes more sense is either picking smoothing parameters once, guided by exogenous info, or using dynamic ones calculated in a minimalistic and elegant way (more on that in further drops).
2) No matter how 'right' you choose the smoothing parameters, all the resulting components (level, trend, seasonal) are not pure; each of them contains a bit of info from the other components, this is just how non-sequential expo smoothing works. You gotta know this if you wanna use expo smoothing to decompose your time series into separate components. The only pure component there, lol, is the residuals;
3) Given what I've just said, treating the level (that does contain trend and seasonal components partially) as the resulting fit is a mistake. The resulting fit is level (l) + trend (b) + seasonal (s). And from this fit, you calculate residuals;
4) The residuals component is not some kind of bad thing; it is simply the component that contains info you consciously decide not to include in your model for whatever reason;
5) Forecasting Errors and Residuals from fitted values are 2 different things. The former are deltas between the forecasts you've made and actual values you've observed, the latter are simply differences between actual datapoints and in-sample fitted values;
6) Residuals are used for in-sample prediction intervals, errors for out-of-sample forecasting intervals;
7) Choosing between single, double, or triple expo smoothing should not be based exclusively on the nature of your data, but on what you need to do as well. For example:
- If you have trending seasonal data and you wanna do forecasting exclusively within the expo smoothing framework, then yes, you need Triple Exponential Smoothing;
- If you wanna use prediction intervals for generating trend-trading signals and you disregard seasonality, then you need single (simple) expo smoothing, even on trending data. Otherwise, the trend component will be included in your model's fitted values → prediction intervals.
8) Kind of not non-obvious, but when you put one smoothing parameter to zero, you basically disregard this component. E.g., in triple expo smoothing, when you put gamma and beta to zero, you basically end up with single exponential smoothing.
^^ data smoothing, beta and gamma zeroed out, forecasting steps = 0
About the implementation
* I use a simple power transform that results in a log transform with lambda = 0 instead of the mainstream-used transformers (if you put lambda on 2 in Box-Cox, you won't get a power of 2 transform)
* Separate set of smoothing parameters for data, residuals, and errors smoothing
* Separate band multipliers for residuals and errors
* Both typical error and typical residuals get multiplied by math.sqrt(math.pi / 2) in order to approach standard deviation so you can ~use Z values and get more or less corresponding probabilities
* In script settings → style, you can switch on/off plotting of many things that get calculated internally:
- You can visualize separate components (just remember they are not pure);
- You can switch off fit and switch on OPF plotting;
- You can plot residuals and their exponentially smoothed typical value to pick the smoothing parameters for both data and residuals;
- Or you might plot errors and play with data smoothing parameters to minimize them (consult SAE aka Sum of Absolute Errors plot);
^^ nuff said
More ideas on how to use the thing
1) Use Double Exponential Smoothing (data gamma = 0) to detrend your time series for further processing (Fourier likes at least weakly stationary data);
2) Put single expo smoothing on your strategy/subaccount equity chart (data alpha = data beta = 0), set prediction interval deviation multiplier to 1, run your strat live on simulator, start executing on real market when equity on simulator hits upper deviation (prediction interval), stop trading if equity hits lower deviation on simulator. Basically, let the strat always run on simulator, but send real orders to a real market when the strat is successful on your simulator;
3) Set up the model to minimize one-point forecasting errors, put error forecasting steps to 1, now you're doing nowcasting;
4) Forecast noisy trending sine waves for fun.
^^ nuff said 2
All Good TV ∞

Optimized Heikin Ashi Strategy with Buy/Sell OptionsStrategy Name:
Optimized Heikin Ashi Strategy with Buy/Sell Options
Description:
The Optimized Heikin Ashi Strategy is a trend-following strategy designed to capitalize on market trends by utilizing the smoothness of Heikin Ashi candles. This strategy provides flexible options for trading, allowing users to choose between Buy Only (long-only), Sell Only (short-only), or using both in alternating conditions based on the Heikin Ashi candle signals. The strategy works on any market, but it performs especially well in markets where trends are prevalent, such as cryptocurrency or Forex.
This script offers customizable parameters for the backtest period, Heikin Ashi timeframe, stop loss, and take profit levels, allowing traders to optimize the strategy for their preferred markets or assets.
Key Features:
Trade Type Options:
Buy Only: Enter a long position when a green Heikin Ashi candle appears and exit when a red candle appears.
Sell Only: Enter a short position when a red Heikin Ashi candle appears and exit when a green candle appears.
Stop Loss and Take Profit:
Customizable stop loss and take profit percentages allow for flexible risk management.
The default stop loss is set to 2%, and the default take profit is set to 4%, maintaining a favorable risk/reward ratio.
Heikin Ashi Timeframe:
Traders can select the desired timeframe for Heikin Ashi candle calculation (e.g., 4-hour Heikin Ashi candles for a 1-hour chart).
The strategy smooths out price action and reduces noise, providing clearer signals for entry and exit.
Inputs:
Backtest Start Date / End Date: Specify the period for testing the strategy’s performance.
Heikin Ashi Timeframe: Select the timeframe for Heikin Ashi candle generation. A higher timeframe helps smooth the trend, which is beneficial for trading lower timeframes.
Stop Loss (in %) and Take Profit (in %): Enable or disable stop loss and take profit, and adjust the levels based on market conditions.
Trade Type: Choose between Buy Only or Sell Only based on your market outlook and strategy preference.
Strategy Performance:
In testing with BTC/USD, this strategy performed well in a 4-hour Heikin Ashi timeframe applied on a 1-hour chart over a period from January 1, 2024, to September 12, 2024. The results were as follows:
Initial Capital: 1 USD
Order Size: 100% of equity
Net Profit: +30.74 USD (3,073.52% return)
Percent Profitable: 78.28% of trades were winners.
Profit Factor: 15.825, indicating that the strategy's profitable trades far outweighed its losses.
Max Drawdown: 4.21%, showing low risk exposure relative to the large profit potential.
This strategy is ideal for both beginner and advanced traders who are looking to follow trends and avoid market noise by using Heikin Ashi candles. It is also well-suited for traders who prefer automated risk management through the use of stop loss and take profit levels.
Recommended Use:
Best Markets: This strategy works well on trending markets like cryptocurrency, Forex, or indices.
Timeframes: Works best when applied to lower timeframes (e.g., 1-hour chart) with a higher Heikin Ashi timeframe (e.g., 4-hour candles) to smooth out price action.
Leverage: The strategy performs well with leverage, but users should consider using 2x to 3x leverage to avoid excessive risk and potential liquidation. The strategy's low drawdown allows for moderate leverage use while maintaining risk control.
Customization: Traders can adjust the stop loss and take profit percentages based on their risk appetite and market conditions. A default setting of a 2% stop loss and 4% take profit provides a balanced risk/reward ratio.
Notes:
Risk Management: Traders should enable stop loss and take profit settings to maintain effective risk management and prevent large drawdowns during volatile market conditions.
Optimization: This strategy can be further optimized by adjusting the Heikin Ashi timeframe and risk parameters based on specific market conditions and assets.
Backtesting: The built-in backtesting functionality allows traders to test the strategy across different market conditions and historical data to ensure robustness before applying it to live trading.
How to Apply:
Select your preferred market and chart.
Choose the appropriate Heikin Ashi timeframe based on the chart's timeframe. (e.g., use 4-hour Heikin Ashi candles for 1-hour chart trends).
Adjust stop loss and take profit based on your risk management preference.
Run backtesting to evaluate its performance before applying it in live trading.
This strategy can be further modified and optimized based on personal trading style and market conditions. It’s important to monitor performance regularly and adjust settings as needed to align with market behavior.

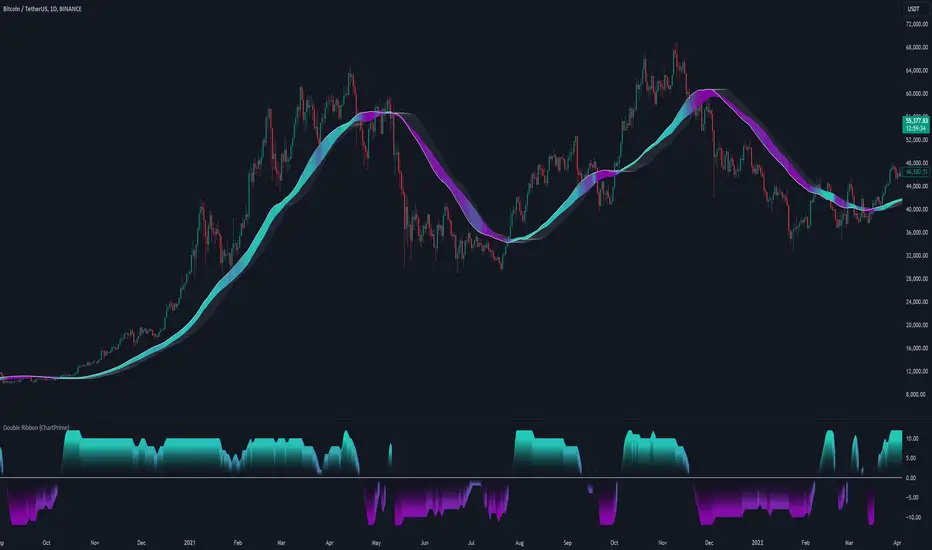
Double Ribbon [ChartPrime]The Double Ribbon - ChartPrime indicator is a powerful tool that combines two sets of Simple Moving Averages (SMAs) into a visually intuitive ribbon, which helps traders assess market trends and momentum. This indicator features two distinct ribbons: one with a fixed length but changing offset (displayed in gray) and another with varying lengths (displayed in colors). The relationship between these ribbons forms the basis of a trend score, which is visualized as an oscillator. This comprehensive approach provides traders with a clear view of market direction and strength.
◆ KEY FEATURES
Dual Ribbon Visualization : Displays two sets of 11 SMAs—one in a neutral gray color with a fixed length but varying offset, and another in vibrant colors with lengths that increase incrementally.
Trend Score Calculation : The trend score is derived from comparing each SMA in the colored ribbon with its corresponding SMA in the gray ribbon. If a colored SMA is above its gray counterpart, a positive score is added; if below, a negative score is assigned.
// Loop to calculate SMAs and update the score based on their relationships
for i = 0 to length
// Calculate SMA with increasing lengths
sma = ta.sma(src, len + 1 + i)
// Update score based on comparison of primary SMA with current SMA
if sma1 < sma
score += 1
else
score -= 1
// Store calculated SMAs in the arrays
sma_array.push(sma)
sma_array1.push(sma1 )
Dynamic Trend Analysis : The score oscillator provides a dynamic analysis of the trend, allowing traders to quickly gauge market conditions and potential reversals.
Customizable Ribbon Display : Users can toggle the display of the ribbon for a cleaner chart view, focusing solely on the trend score if desired.
◆ USAGE
Trend Confirmation : Use the position and color of the ribbon to confirm the current market trend. When the colored ribbon consistently stays above the gray ribbon, it indicates a strong uptrend, and vice versa for a downtrend.
Momentum Assessment : The score oscillator provides insight into the strength of the current trend. Higher scores suggest stronger trends, while lower scores may indicate weakening momentum or a potential reversal.
Strategic Entry/Exit Points : Consider using crossovers between the ribbons and changes in the score oscillator to identify potential entry or exit points in trades.
⯁ USER INPUTS
Length : Sets the base length for the primary SMAs in the ribbons.
Source : Determines the price data used for calculating the SMAs (e.g., close, open).
Ribbon Display Toggle : Allows users to show or hide the ribbon on the chart, focusing on either the ribbon, the trend score, or both.
⯁ CONCLUSION
The Double Ribbon indicator offers traders a comprehensive tool for analyzing market trends and momentum. By combining two ribbons with varying SMA lengths and offsets, it provides a clear visual representation of market conditions. The trend score oscillator enhances this analysis by quantifying trend strength, making it easier for traders to identify potential trading opportunities and manage risk effectively.
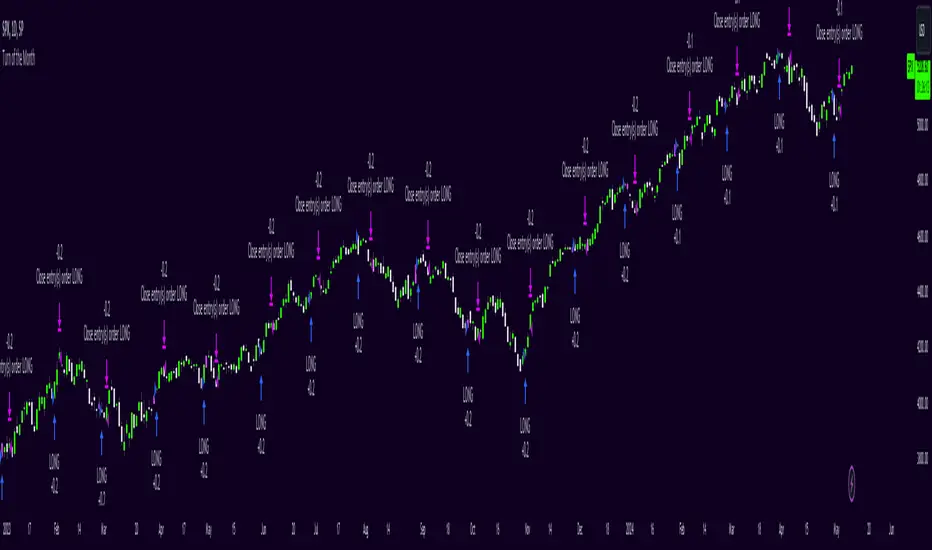
Turn of the Month Strategy [Honestcowboy]The end of month effect is a well known trading strategy in the stock market. Quite simply, most stocks go up at the end of the month. What's even better is that this effect spills over to the next phew days of the next month.
In this script we backtest this theory which should work especially well on SP500 pair.
By default the strategy buys 2 days before the end of each month and exits the position 3 days into the next month.
The strategy is a long only strategy and is extremely simple. The SP500 is one of the #1 assets people use for long term investing due to it's "9.8%" annualised return. However as a trader you want the best deal possible. This strategy is only inside the market for about 25% of the time while delivering a similar return per exposure with a lower drawdown.
Here are some hypothesis why turn of the month effect happens in the stock markets:
Increased inflow from savings accounts to stocks at end of month
Rebalancing of portfolios by fund managers at end of month
The timing of monthly cash flows received by pension funds, which are reinvested in the stock market.
The script also has some inputs to define how many days before end of the month you want to buy the asset and how long you want to hold it into the next month.
It is not possible to buy the asset exactly on this day every month as the market closes on the weekend. I've added some logic where it will check if that day is a friday, saturdady or sunday. If that is the case it will send the buy signal on the end of thursday, this way we enter on the friday and don't lose that months trading opportunity.
The backtest below uses 4% exposure per trade as to show the equity curve more clearly and because of publishing rules. However, most fund managers and investors use 100% exposure. This way you actually risk money to earn money. Feel free to adjust the settings to your risk profile to get a clearer picture of risks and rewards before implementing in your portfolio.
Bitcoin Momentum StrategyThis is a very simple long-only strategy I've used since December 2022 to manage my Bitcoin position.
I'm sharing it as an open-source script for other traders to learn from the code and adapt it to their liking if they find the system concept interesting.
General Overview
Always do your own research and backtesting - this script is not intended to be traded blindly (no script should be) and I've done limited testing on other markets beyond Ethereum and BTC, it's just a template to tweak and play with and make into one's own.
The results shown in the strategy tester are from Bitcoin's inception so as to get a large sample size of trades, and potential returns have diminished significantly as BTC has grown to become a mega cap asset, but the script includes a date filter for backtesting and it has still performed solidly in recent years (speaking from personal experience using it myself - DYOR with the date filter).
The main advantage of this system in my opinion is in limiting the max drawdown significantly versus buy & hodl. Theoretically much better returns can be made by just holding, but that's also a good way to lose 70%+ of your capital in the inevitable bear markets (also speaking from experience).
In saying all of that, the future is fundamentally unknowable and past results in no way guarantee future performance.
System Concept:
Capture as much Bitcoin upside volatility as possible while side-stepping downside volatility as quickly as possible.
The system uses a simple but clever momentum-style trailing stop technique I learned from one of my trading mentors who uses this approach on momentum/trend-following stock market systems.
Basically, the system "ratchets" up the stop-loss to be much tighter during high bearish volatility to protect open profits from downside moves, but loosens the stop loss during sustained bullish momentum to let the position ride.
It is invested most of the time, unless BTC is trading below its 20-week EMA in which case it stays in cash/USDT to avoid holding through bear markets. It only trades one position (no pyramiding) and does not trade short, but can easily be tweaked to do whatever you like if you know what you're doing in Pine.
Default parameters:
HTF: Weekly Chart
EMA: 20-Period
ATR: 5-period
Bar Lookback: 7
Entry Rule #1:
Bitcoin's current price must be trading above its higher-timeframe EMA (Weekly 20 EMA).
Entry Rule #2:
Bitcoin must not be in 'caution' condition (no large bearish volatility swings recently).
Enter at next bar's open if conditions are met and we are not already involved in a trade.
"Caution" Condition:
Defined as true if BTC's recent 7-bar swing high minus current bar's low is > 1.5x ATR, or Daily close < Daily 20-EMA.
Trailing Stop:
Stop is trailed 1 ATR from recent swing high, or 20% of ATR if in caution condition (ie. 0.2 ATR).
Exit on next bar open upon a close below stop loss.
I typically use a limit order to open & exit trades as close to the open price as possible to reduce slippage, but the strategy script uses market orders.
I've never had any issues getting filled on limit orders close to the market price with BTC on the Daily timeframe, but if the exchange has relatively low slippage I've found market orders work fine too without much impact on the results particularly since BTC has consistently remained above $20k and highly liquid.
Cost of Trading:
The script uses no leverage and a default total round-trip commission of 0.3% which is what I pay on my exchange based on their tier structure, but this can vary widely from exchange to exchange and higher commission fees will have a significantly negative impact on realized gains so make sure to always input the correct theoretical commission cost when backtesting any script.
Static slippage is difficult to estimate in the strategy tester given the wide range of prices & liquidity BTC has experienced over the years and it largely depends on position size, I set it to 150 points per buy or sell as BTC is currently very liquid on the exchange I trade and I use limit orders where possible to enter/exit positions as close as possible to the market's open price as it significantly limits my slippage.
But again, this can vary a lot from exchange to exchange (for better or worse) and if BTC volatility is high at the time of execution this can have a negative impact on slippage and therefore real performance, so make sure to adjust it according to your exchange's tendencies.
Tax considerations should also be made based on short-term trade frequency if crypto profits are treated as a CGT event in your region.
Summary:
A simple, but effective and fairly robust system that achieves the goals I set for it.
From my preliminary testing it appears it may also work on altcoins but it might need a bit of tweaking/loosening with the trailing stop distance as the default parameters are designed to work with Bitcoin which obviously behaves very differently to smaller cap assets.
Good luck out there!

ATR Percentage ValuesThis indicator is created to give you the daily ATR 2% and 10% values for any product that you are looking at. The way the indicator is designed is to only show the most recent 2 and 10 percent values on any chart and will not show you any other number. If you are hovering over price that occurred in the past it will show zeros on the values. To get the right values, take your mouse off of the chart and it will show you the values.
The way this indicator is coded will give you the daily ATR numbers no matter what chart timeframe you are currently looking at. The idea is to save time and make sure you do not make a mistake getting the wrong value.
*** To make this show up on the status line, click on the settings, click on the style box and check the box "VALUES IN STATUS LINE" ****

Average Range LinesThis Average Range Lines indicator identifies high and low price levels based on a chosen time period (day, week, month, etc.) and then uses a simple moving average over the length of the lookback period chosen to project support and resistance levels, otherwise referred to as average range. The calculation of these levels are slightly different than Average True Range and I have found this to be more accurate for intraday price bounces.
Lines are plotted and labeled on the chart based on the following methodology:
+3.0: 3x the average high over the chosen timeframe and lookback period.
+2.5: 2.5x the average high over the chosen timeframe and lookback period.
+2.0: 2x the average high over the chosen timeframe and lookback period.
+1.5: 1.5x the average high over the chosen timeframe and lookback period.
+1.0: The average high over the chosen timeframe and lookback period.
+0.5: One-half the average high over the chosen timeframe and lookback period.
Open: Opening price for the chosen time period.
-0.5: One-half the average low over the chosen timeframe and lookback period.
-1.0: The average low over the chosen timeframe and lookback period.
-1.5: 1.5x the average low over the chosen timeframe and lookback period.
-2.0: 2x the average low over the chosen timeframe and lookback period.
-2.5: 2.5x the average low over the chosen timeframe and lookback period.
-3.0: 3x the average low over the chosen timeframe and lookback period.
Look for price to find support or resistance at these levels for either entries or to take profit. When price crosses the +/- 2.0 or beyond, the likelihood of a reversal is very high, especially if set to weekly and monthly levels.
This indicator can be used/viewed on any timeframe. For intraday trading and viewing on a 15 minute or less timeframe, I recommend using the 4 hour, 1 day, and/or 1 week levels. For swing trading and viewing on a 30 minute or higher timeframe, I recommend using the 1 week, 1 month, or longer timeframes. I don’t believe this would be useful on a 1 hour or less timeframe, but let me know if the comments if you find otherwise.
Based on my testing, recommended lookback periods by timeframe include:
Timeframe: 4 hour; Lookback period: 60 (recommend viewing on a 5 minute or less timeframe)
Timeframe: 1 day; Lookback period: 10 (also check out 25 if your chart doesn’t show good support/resistance at 10 days lookback – I have found 25 to be useful on charts like SPX)
Timeframe: 1 week; Lookback period: 14
Timeframe: 1 month; Lookback period: 10
The line style and colors are all editable. You can apply a global coloring scheme in the event you want to add this indicator to your chart multiple times with different time frames like I do for the weekly and monthly.
I appreciate your comments/feedback on this indicator to improve. Also let me know if you find this useful, and what settings/ticker you find it works best with!
Also check out my profile for more indicators!

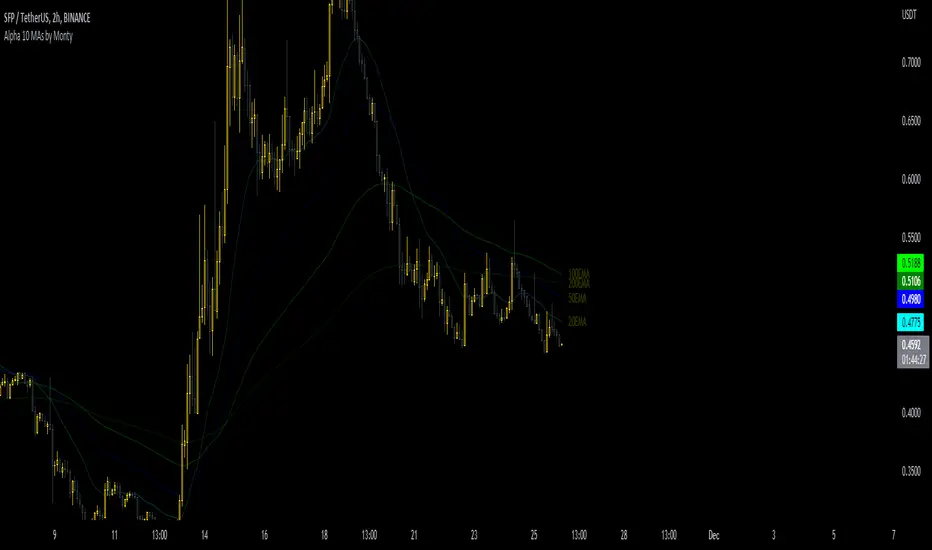
10 MAs Alpha Indicator by MontyThis indicator is a part of the script I coded earlier this month.
The name is to surprise one of our discord member.
I will publish that indicator in a few days as well, but publishing this as a gesture of giving back to the community.
Indicator has:
10 Moving Averages
Adjustable Color, Opacity and Size etc
Shows Labels for each of the MA.
Can be shifted between EMA or SMA
Can be fixed to show a specific TF MA on current Timeframe.
Opening Range with Infinite Price TargetsOpening Range with Infinite Price Targets is an ORB indicator that automatically generates price targets into infinity based on a user-defined % of range.
This indicator includes many nice-to-have features missing from other indicators. Such as:
Price Target Labels with Price tooltip, want to know exactly what price pt3 is at? Hover over it and see.
Custom Defined Range time, Set your Range Start and end time to whatever you need, Doesn't have to be pinned to opening range!. Note: Time is in chart time.
Historical View (Default off), Tired of your chart looking messy with a ton of lines from historical data? No problem! You can choose to view or not view historical data.
Alerts for Range Breaks, First Range Breaks, and Discovery Price Target hits. As well as Exported Values for Range High, Low, and Mean to set your own alerts from custom sources.
Custom Price Targets, set your price targets to a % of the range based on your own strategy.
Last but not Least, Infinitely Generating Price Targets. They just keep building. New Targets will be generated when the price closes above/below the current farthest target.
Enjoy!

MACD strategy + Trailstop indicatorWelcome traveler !
Here is my first indicator I made after 3 days of hardlearning pine code (beginner in coding).
I hope it will please you, if you have any suggestion to enhance this indicator, do not hesitate to give me your thoughts in the comments section or by Private message on trading View !
How does it works ?
It's a simple MACD strategy as describe here :
Uses of EMA 200 as a trend confirmer,
For sells :
When above Zero line (MACD) and under EMA200, we go on sell (background color is red)
For buys:
When under Zero line (MACD) and above EMA 200, we go on Buy (back ground color is green)
FILTERS !
I haded one filter to reduce noise on the indicator :
Signals aren't taken if one of the 14 last candles closed on the other side of the EMA 14.
What are the green and red lines ?
The green line is equivalent of a potential stop loss as a buyer side, same for the red one on seller side !
To make the space with the price bigger, please use "ATR multiplier" in the input options of the indicator while on your chart !
Is it timeframe specific ?
Hell no it is not timeframe specific ! You can try to use it on every timeframe !
As usual, I like to remind you that the best way to test an indicator is to go backtest it or to paper trade before using it on real market conditions !
If you find an idea of filter for a specific timeframe, do not hesitate to contact me ! I'll try to do my best to enhance this indicator as the time goes !
Is there repainting ?
There is no repainting on confirmation !
There's only a movement that I don't know how to ignore on the current open candle for the trail stop indicator I built, it should not be a problem if you place alerts to automatise your trading on the close of the candle, and not the high or low !
If you know how to resolve this problem with my code, I would be glad to get your tips to enhance the script ! :)
Example of the indicator in market (backtest, as said, no repaint on confirmation) :

Simple LevelsSimple Level provides a (you guessed it) simple user to user level sharing experience, with less boxes, less formatting, and less hassle.
Simply insert your levels into the input box, separated by commas. That's it.
Example: 1,2,3,4,5
The Simple Levels indicator will automatically color your lines based on their position to the current close price.
If the level is crossed, the level line will change color.
This indicator is intended for those who just want to skip filling out boxes or typing in a tricky format, and cut to the chase.
There are additional, nice-to-have settings as well for the "more" technically inclined; however, nothing too complicated.
Enjoy!

Buy and hold strategyA simple buy and hold strategy. A short or a long position can be chosen. The start date will determine the date where your position will start and end date is the date it will end. This works well as a baseline to your other existing strategies since buy and hold is just the simplest strategy available.

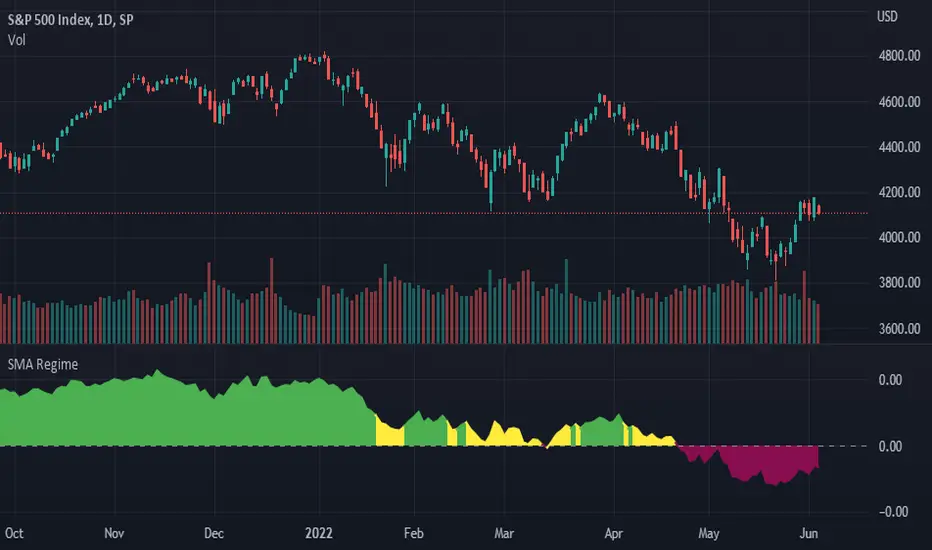
SMA RegimeProvides a color coded indicator based upon both the slope of a moving average of choice, and the asset's position in relation to that moving average. If the specified moving average is downward sloping and the asset closes below the moving average the indicator will be red. If the specified moving average is upward sloping and the asset closes above the moving average the indicator will be green. Any other combination of these two factors will color the indicator yellow indicating indecision.
Aggregated Moving AveragesUsers can display moving averages from higher time frame charts and display them on their current chart. This script supports up to 4 moving averages aggregated from a selected time frame. Each plot can be toggled if the user does not wish to have all 4 plots displayed.
Inputs allow user to edit:
Moving average length
Average type
Color
Timeframe input allows user to select which timeframe the moving averages are calculated from.
If you wish to have multiple timeframes across different moving averages, it is recommended you add a separate copies of the indicator for each timeframe you wish to display. Toggle visibility of which plots which you don't need.
consoleLibrary "console"
Simple debug console to print messages from your strategy code.
USAGE :
Make sure your strategy overlay is false
Import the library :
import keio/console/1 as console
init(lines, panes)
Initialise function.
USAGE :
var log = console.init()
Parameters:
lines : Optional. Number of lines to display
panes : Optional. Number of panes to display
Returns: initialised log
print(log)
Prints a message to the console.
USAGE :
log := console.print(log, "message")
Parameters:
log : Mandatory. The log returned from the init() function
Returns: The log