All indicators in one!All indicators in one!
Hull MA (2 colors) + Bollinger Bands + 6 EMA + 50 SMA + 200 SMA + Parabolic SAR + SUPER TREND (2 colors) + Doji signals (yellow)
Sma
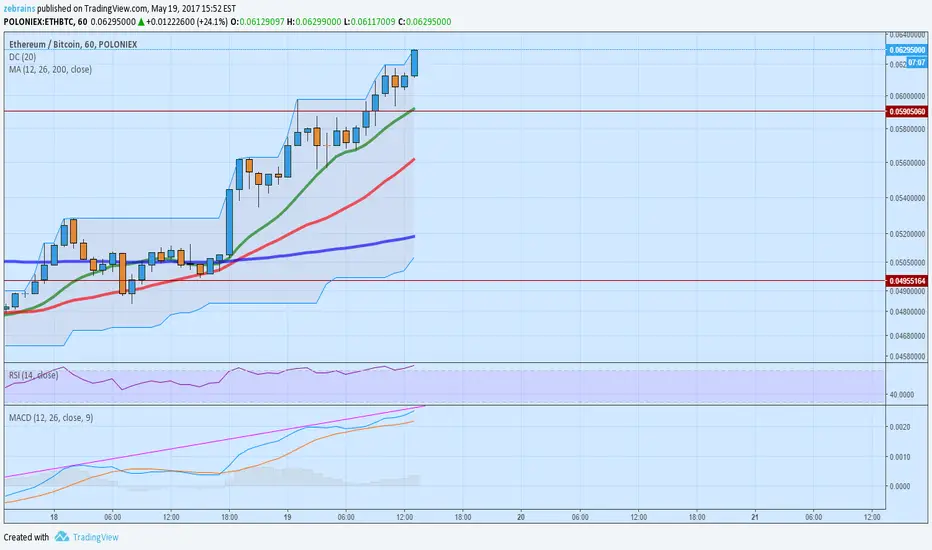
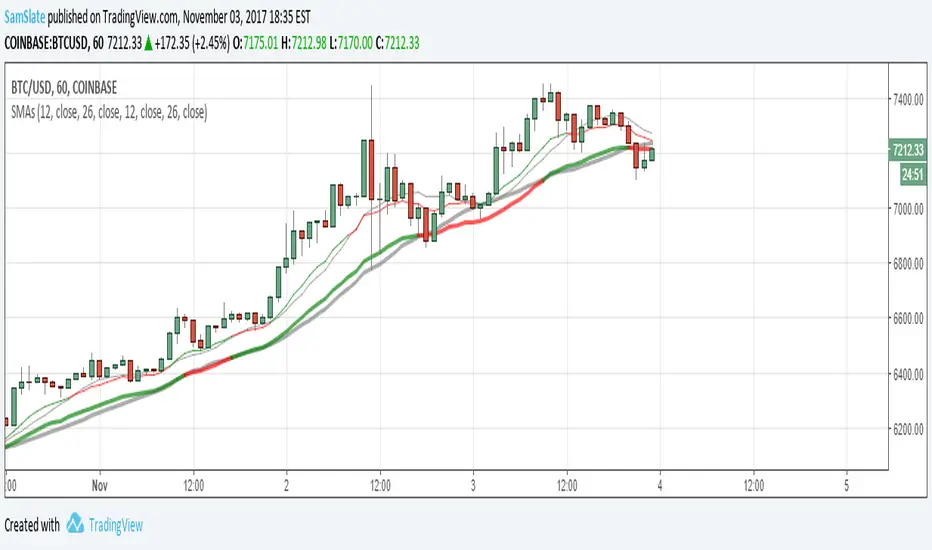
Triple Log-scale MA (Binance style)A combo of 3 MAs for traders who grew accustomed to using Binance MA settings
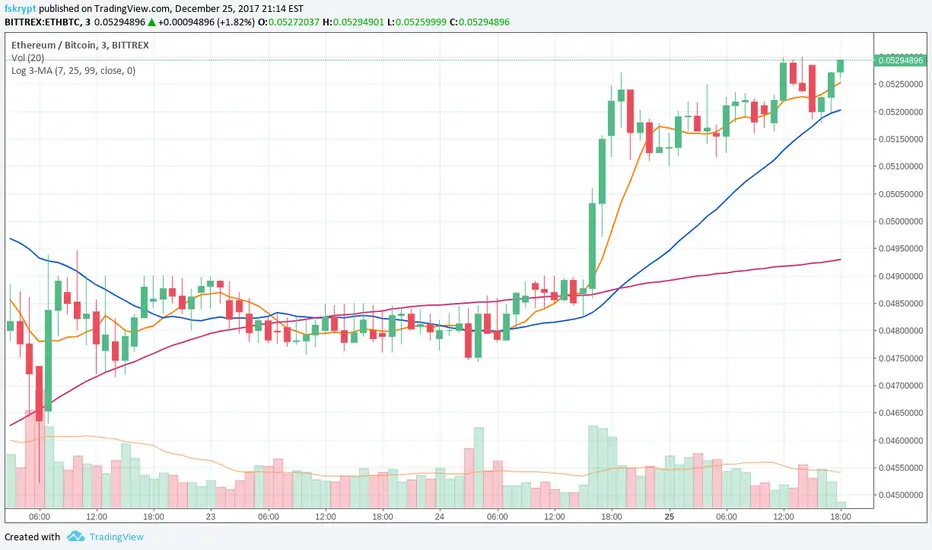
TSMA by Binko121Triple simple moving average. Use this to plot three averages with a single indicator instead of three individual ones.
Defaults are configured for 50, 100 and 200 interval averages. Adjust interval lengths to your desires.

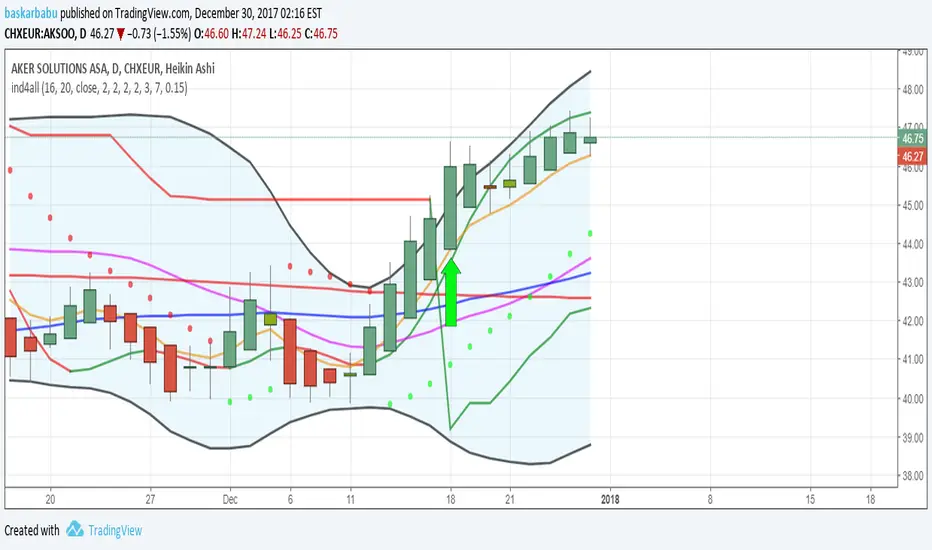
Raicher StrategyAnalyzes 343-minute intervals, spotting bullish/bearish trends, giving you the opportunity to strategize your trades according to market momentum.

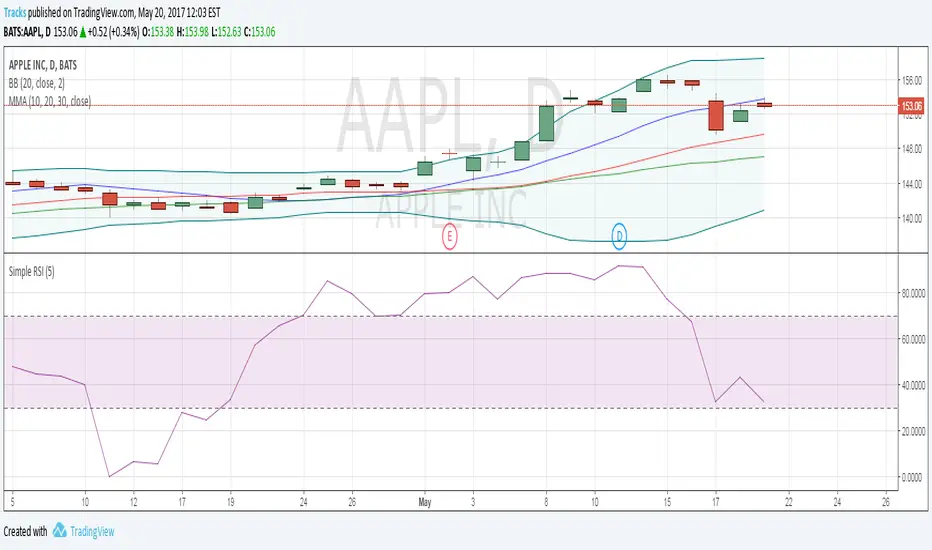
DepthHouse - Moving Average ChannelsThe indicator Moving Average Channels was created for experimental purposes due to the parabolic moves BTC has made in the recent past.
How it works:
The basis, or center line, is a standard moving average that is set by the user.
The bands are then a customizable percentage of the basis.
Which based on the settings, could serve as possible support and resistance.
DepthHouse – Moving Average Channels has been published for you all to see and try for yourselves.
Maybe this indicator has uses elsewhere? If you find something feel free to post it in the comments below!
If you like this indicator, please drop a like or comment!
They are very much appreciated!
Be sure to go to my profile and check out my other indicators!

EMA and SMA SpreadI had hard time to find a simple script to show EMA and SMA spread.
Bonus add for PT users :)
Set "buy_value" as you have in PAIRS.properties to show you when your buys will become potential.

Triple MASuper simple.
Three simple moving averages all in a single indicator for your convenience.
Default values:
MA 1 - 20
MA 2 - 50
MA 3 - 100
If you like this or any of my other scripts - please consider chucking some BTC my way ;) 1LbFxAYJSVPxirT8eW31QHaGbySHyPYgMq


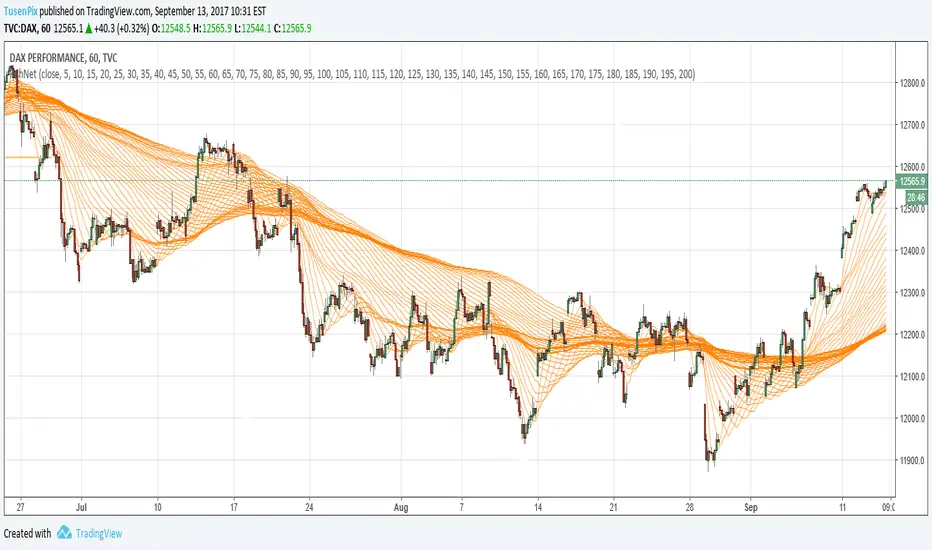
FishNet SMAMoving averages 1-200 that create this FishNet pattern. Works well on all timeframes and together they form resistens and support levels.

Simple and Exponential Moving AveragesThis script graphs 5 SMAs (20, 50, 100, 150, 200) and 5 EMAs (20, 50, 100, 150, 200). The first group uses blue and orange colors whereas the second one uses green and red. When a bar closes below a moving average, either orange or red will be used depending on which type of moving average and which period. In bullish mode, we show blue and green. Moving average periods are configurable, and you can hide the MAs you don't want.

High TimeFrame Multiple MABe vigilant to the levels used by swing traders trading on weekly and monthly charts. Often they use SMA with periods of 3,5,8.

[naoligo] 10x MA (H, D, W, M)This one is based on "Generic 8x MA Plotter" indicator, by @LazyBear.
It will plot three Moving Averages based on current time interval and seven based on chosen periods by hour, day, week and month. You will be able to see where is, for example, a 50 days SMA when using a 5 minutes time interval chart. I find it very useful to analyze, in a snap, possible price ranges and enter/exit points. All reference values are from setups known and used by traders.
Cons: Use it wisely, because if you choose to plot all the 10 Moving Averages, he will consume a lot of the computer resources.
Enjoy!!
Edit: I forgot to mention that you can choose between EMA or SMA for each time interval, that are distributed in:
2x MA Hour;
2x MA Day;
2x MA Week;
1x MA Month.
I've tried to keep the code as simple as possible, so you can increase that number or modify the Moving Average that each time interval will use.
Peace!

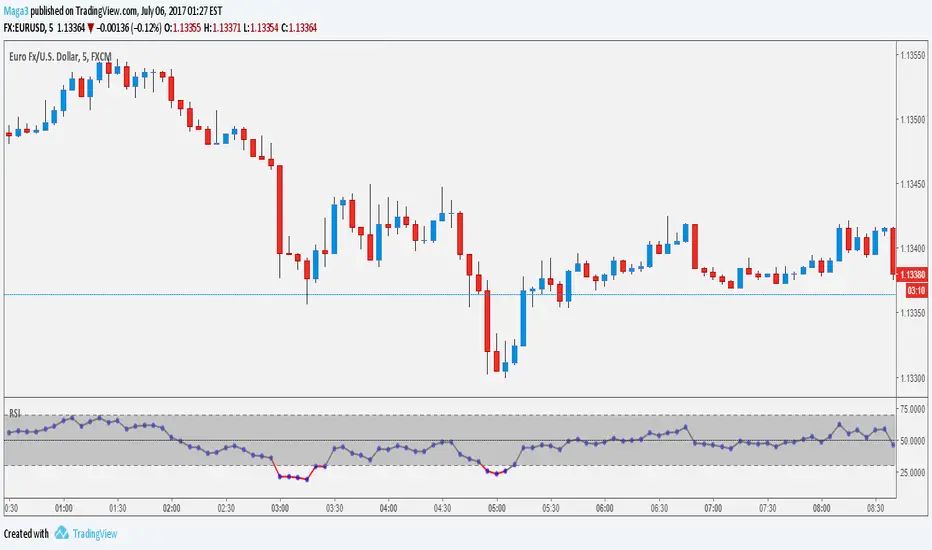
[M] RSI_dots + SMARSI with dots and red color when leaving the zone + sma. Just for convenience =)
----------------------
RSI с точками и красной окраской при выходе за зону + sma. Просто для удобства =)
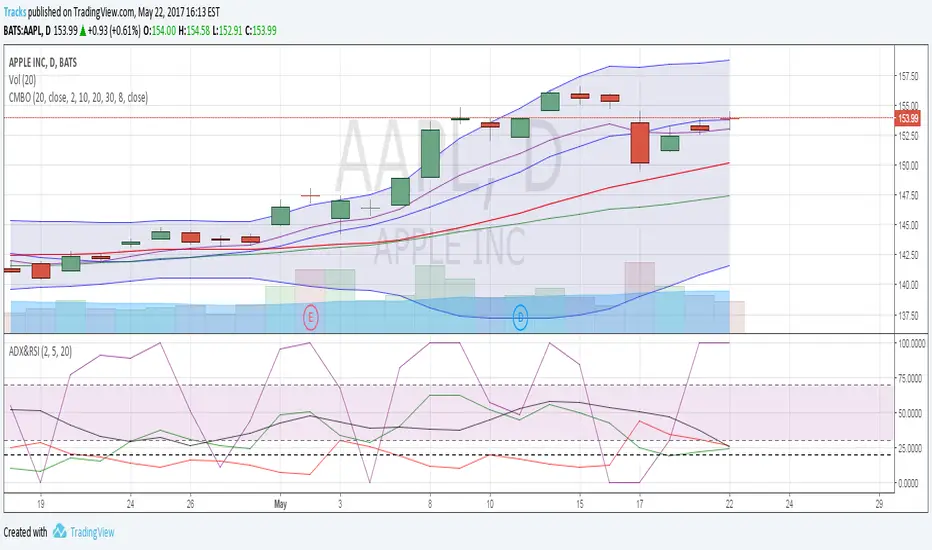
MoD_v1_StochRSISMA_Strategy_Iteration1combines StochRSI, RSI, SMA and BB to find best reversal entries. Also has options for finding Divergence (TBC in Version 2 :-) )

Bran's 8 Length SMAAll the SMAs you could ever want in a single indicator. Customizable, versatile and great for TAs who don't want to eat up their indicators with a bunch of custom SMA lines.

Combo IndicatorFor easier setup, this script combines 5 indicators. 3 simple moving averages, 1 EMA and Bollinger Bands. These are common indicators that are that often used and discussed on OptionsPlayers.com
Multiple Moving AverageCombines 3 moving average plot lines into one indicator for easy configuration