Time Locked Moving AverageSuccinct Description
Generates moving average that stays locked to users desired time preference.
Verbose Description
The default moving average indicator does not stay locked to the chart timeframe. Meaning, if you want to see a 1 day SMA on a 15 minute chart, you have to do math and adjust the moving average length to 96.
Needing to do this constantly (especially while flipping through multiple time frames) was really annoying, so I codded up this script to do it for me... and now it can for you too!
Error Handling
If you receive a 'study error' that says, "function sma references too many candles in history".
Go to the Time Locked Moving Average settings and increase the timeframe interval until error goes away.
Furthermore, UNCHECK gaps, to show real-time approximated moving average values.
Enjoy :)
Sma

Kijun Trend IndicatorName: Kijun Trend Indicator
Category: Trend Analysis
Timeframe: All timeframes
Suggested usage: In a trending market, to understand when it is good to enter short (red line) and when to enter long (blue line).
Technical Analysis: The original idea was taken from Larry Williams: an uptrend is identified when the price is above an 18-period simple moving average (SMA) and when at least two candles do not touch the simple moving average with their lows. The opposite is true for a downtrend.
Corrado Rondelli has therefore reinterpreted with Ichimoku aka "ichimokized" replacing the 18-period Simple Moving Average with the 26-period Kijun - as per the original Ichimoku settings.
In order to make the indicator more flexible an Exponential Moving Average (EMA) has also been added.
The indicator plots the chosen line that becomes red when it is good to enter short and blue when it is good to enter long.
Configuration:
- Length: period to be used to calculate the line.
- Type: the line type that can be the Kijun (26-period) or SMA/EMA (18-period)

JC Log($/SMA)Simple script with user-definable:
• SMA denominator days.
• A handy and subtle smoothing function for the numerator, in EMA days. Set to 0 to just use the standard current price. (Defaults to 3 for barely noticeable lag and smoothing.)
• User-definable time resolution, independent of the chart. (Or you can set to use the same as the chart.)

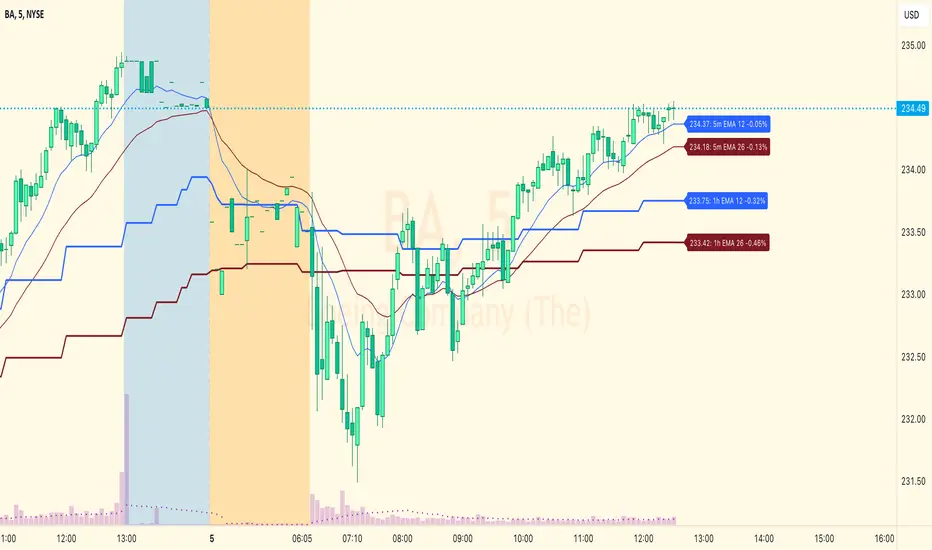
EMA Levels, Multi-TimeframeThe exponential moving average (EMA) tracks price over time, giving more importance to recent price data than simple moving average (SMA). EMAs for larger timeframes are generally considered to be stronger supports/resistances for price to move through than smaller timeframes. This indicator allows you to specify two different EMA lengths that you want to track. Additionally, this indicator allows you to display not just the EMA levels of your currently viewed timeframe on the chart, but also shows the EMA levels of up to 4 different timeframes on the same chart. This allows you to quickly see if multiple EMA levels are aligning across different timeframes, which is an even stronger indication that price is going to meet support or resistance when it meets those levels on the chart. There are a lot of nice configuration options, like:
Ability to customize the EMA lengths you want to track
Style customization (color, thickness, size)
Hide any timeframes/levels you aren't interested in
Labels on the chart so you can tell which plots are the EMA levels
Optionally display the plot as a horizontal line if all you care about is the EMA level right now
Moving Average MultitoolI made this script as a personal tool while backtesting multiple moving averages. It allows you to easily access and switch between different types of moving averages, without having to continuously add and remove different moving averages from your chart.
It also has the option to show the a 14 period average distance between the closing price of an asset and the selected moving average, as a multiple of ATR. This number can be shown by enabling the "Show ATR Between MA and Close" setting. The intention of this value is to quantify and compare the speed of different moving averages across any instrument and any timeframe. The higher the value, the slower the moving average. The lower the value, the faster the moving average.

Cloud Ribbon ++ by [JohnnySnow]Inspired by my favorite EMA ribbon - "EMA Ribbon " by fskrypt.
This Ribbon ADD the option to choose the avarage algorithm of the ribbon .
Created also to be more friendly to read along with trendlines and Fibonacci retracements.
For those like me that NOT use this ribbon to find exact price action but instead, to have a grasp of possible Support/Resistance strenght ahead.
High transparency lines and a configurable color palette for filling the background give the ribbon a look of support/ Resistance cloud Strenght.
Each MA length, line, and background color can be easily configured.

library TypeMovingAveragesLibrary "TypeMovingAverages"
This library function returns a moving average.
ma_fast
ma_slow
MA_selector()
Example
// This source code is subject to the terms of the Mozilla Public License 2.0 at mozilla.org
// © hapharmonic
//@version=5
indicator("Test MATYPE", overlay=true)
import hapharmonic/TypeMovingAverages/1 as MAType
xprd1 = input(title=' 💉Fast EMA period', defval=12)
ma_select1 = 'EMA'
xprd2 = input(title=' 💉Fast EMA period', defval=26)
ma_select2 = 'EMA'
xsmooth = input.int(title='🏄♂️Smoothing period (1 = no smoothing)', minval=1, defval=1)
ma_fast = MAType.MA_selector(close, xprd1, ma_select1,xsmooth)
ma_slow = MAType.MA_selector(close, xprd2, ma_select2,xsmooth)
plot(ma_fast, "INDICATOR",color.green)
plot(ma_slow, "INDICATOR",color.red)
///////////////////////////////////////////////////////
///////////////////////////////////////////////////////
Of course, you can run these types just by adding options. 'ma_select1 ' and 'ma_select2'
SMA', 'EMA', 'WMA', 'HMA', 'JMA', 'KAMA', 'TMA', 'VAMA', 'SMMA', 'DEMA', 'VMA', 'WWMA', 'EMA_NO_LAG', 'TSF', 'ALMA'

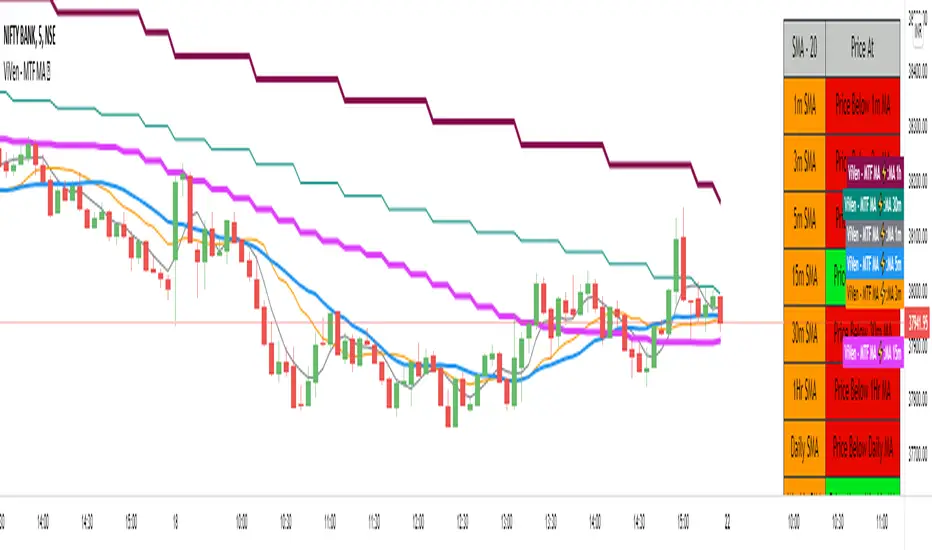
ViVen - Multi Time Frame - Moving Average StrategyHi Traders,
Indicator Description : Multiple Time Frame Moving Average lines in One Chart.
Moving Average Types : SMA, WMA, EMA
Moving Average Period : 20 Default (Variable up to 200)
MA Time Frame : 1m, 3m, 5m, 15m, 30m, 1Hr, Daily, Weekly, Monthly (All lines in one chart)
You can turn ON/OFF the moving average lines based on your requirement.
Moving Average Table : The table will give you an idea where the price is currently trading (LTP), if the price is above any of the moving average then it will show you the Price is above MA and wise versa.
Trading Method:
Monthly, Weekly, Daily and 1Hr Moving averages will tell you whether the script is in Bullish Trend or Bearish Trend.
Basically the moving averages will act as Support and Resistance Levels. With candle confirmation you can take trade.
Ready to Take Position - When 1m MA Crosses 3m MA (Upside / Downside)
BUY Strategy:
"Buy" - when 3m MA breaks 5m moving average on the upside. (Intraday/Scalp)
"Hold" - when 5m MA breaks 15m MA on the upside.
"Strong Hold" - when 15m MA breaks 1Hr MA on the upside for Long term.
"Exit" - when 3m MA breaks 5m MA on the Downside.
SELL Strategy:
"Sell" - when 3m MA breaks 5m moving average on the Downside. (Intraday/Scalp)
"Hold" - when 5m MA breaks 15m MA on the Downside. (Intraday)
"Strong Hold" - when 15m MA breaks 1Hr MA on the Downside. (Positional).
"Exit" - when 3m MA breaks 5m MA on the Downside.
If you agree with this strategy and works well please like this script, share it with your friends and Follow me for more Indicators.
In the next Version, I will come up with Strategy table that I have explained here.
Thanks for your support.
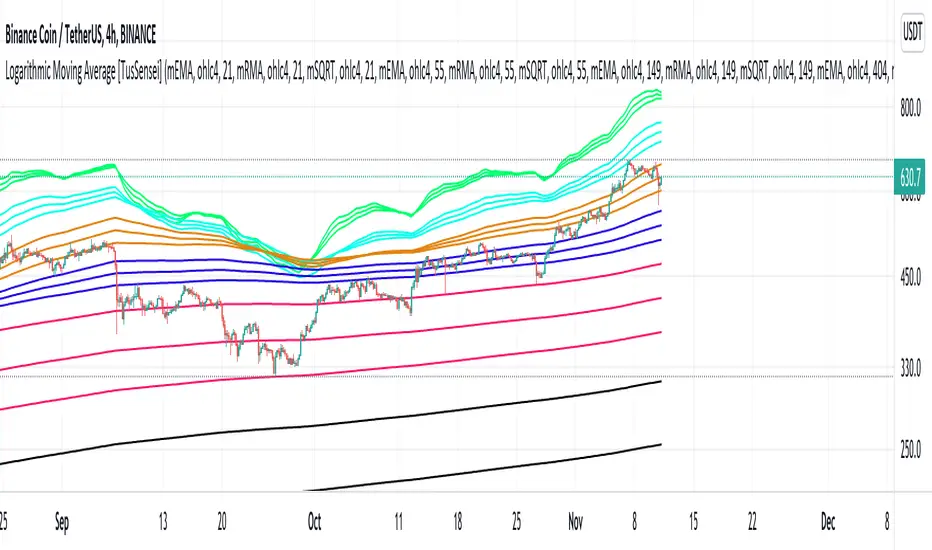
Logarithmic Moving Average [TusSensei]Logarithmic moving averages involve mathematical modification of classical moving averages(EMA-RMA-SMA). Logarithmic modified averages deviate high over short time periods. For long time periods, it behaves exactly like the original moving averages. Its basic formulation is (MovingAverage x (1 + (1 / log(length))).
The most important reason for the operability of logarithmic moving averages is the time periods they use. The values used are 21-55-149-404-1098-2981. These numbers are the consecutive powers of the number "e", which is the base of the natural logarithm (rounded up to an integer).
In this script you will also see another moving average called SQRT. This moving average is equal to the square root of the product of the EMA and the RMA. In other words, it is a moving average that is the geometric mean of two averages. In this script, you can use all of the EMA-RMA-SQRT and SMA averages in the classical and modified way. For formulaic modification, it is sufficient to select "mEMA", "mRMA" forms from the setting section.
Thanks everyone!
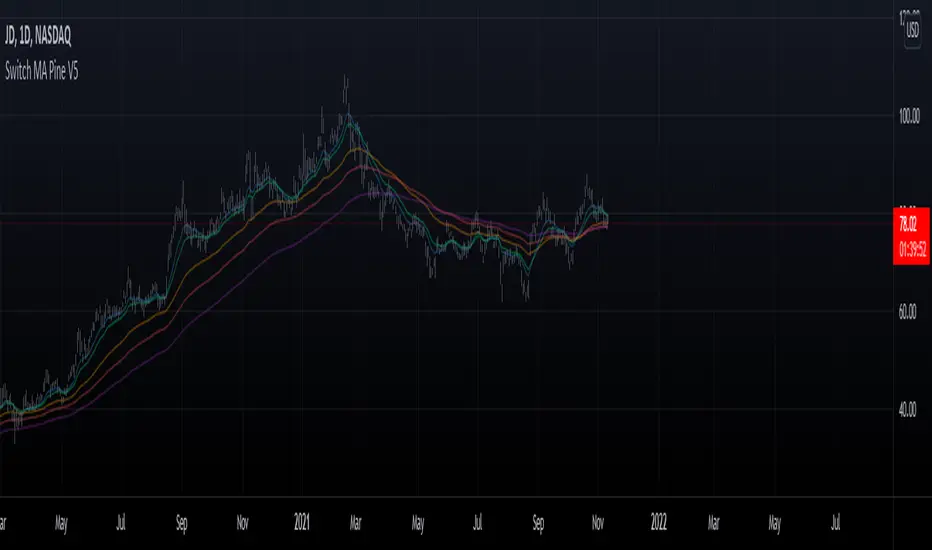
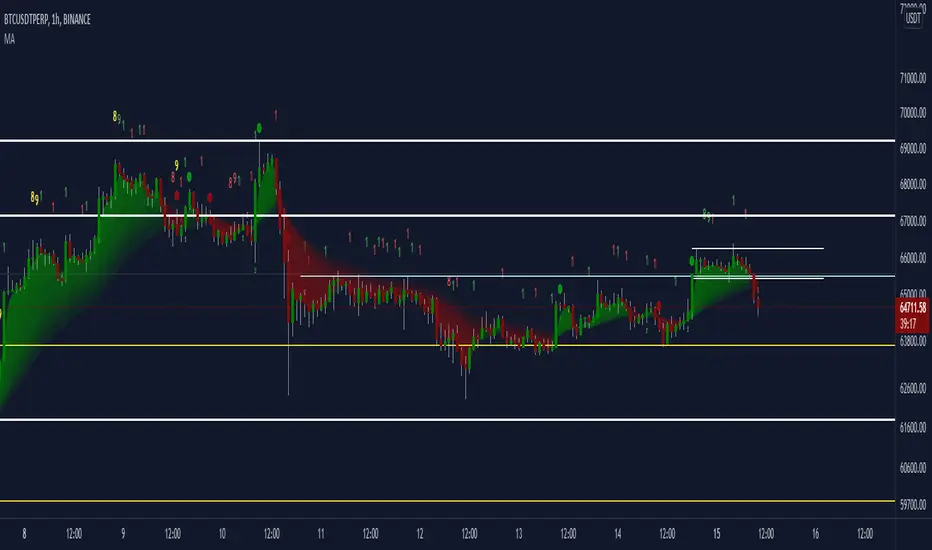
Moving Average Trend█ OVERVIEW
This is a Moving Average Script that contains both a cloud and a ribbon that has independent MA-type selection.
⬆ green arrow up = up trend flip
⬇ red arrow down = down trend flip
🟢 Green Dot = Potential Long
🔴 Red Dot = Potential Short
█ CONCEPTS
1 — Cloud, like most trading algo, the cloud is made of 8 short term MA , with MA cross and MA cross (longema)
2 — Ribbon, this is by default turned off, the default values , an option in setting to change longema to look for ribbon cross
3 — Sequence, It goes from 1 – 9 at 9 the sequence resets. The sequence changes colour depending on if it’s a down trend(red) or uptrend(green) or an over extended trend (yellow)
Setup definitions
Red sell start = current close < the close 4 candles back
Yellow sell extended = current close < last close and current close < two closes back
Green buy start = current close > the close 4 candles back
Yellow buy extended = current close last close and current close < two closes back
This can help you find when it’s time to get out, or sit out of a choppy trend.
4 - Moving Average types:
sma = Simple Moving Average
ema = Exponential Moving Average
wma = Weighted Moving Average
vwma = Volume Weighted Moving Average
rma = Running Moving Average
alma = Arnaud Legoux Moving Average
hma = Hull Moving Average
jma = Jurik Moving Average
frama-o = frama
frama-m = frama mod
dema = Double Exponential Moving Average
tema = Triple Exponential Moving Average
zlema = Zero lag Exponential Moving Average
smma = Smoothed Moving Average
kma = kaufman Moving Average
tma = triangular Moving Average
gmma = Geometric Mean Moving Average
vida = Variable Index Dynamic Average
cma = Corrective Moving average
rema = Range Exponential Moving average
█ OTHER SECTIONS
• FEATURES: to describe the detailed features of the script, usually arranged in the same order as users will find them in the script's inputs.
• HOW TO USE
• LIMITATIONS: Like with any MA script there is a lag factor associated with is.
• RAMBLINGS: Experiment to your hearts content with all the MA types, I'm impartial to HMA as is
• NOTES: some of the MA's are more taxing, therefore take longer to load, be patience, this is a trimmed down version of an existing invite only script i have
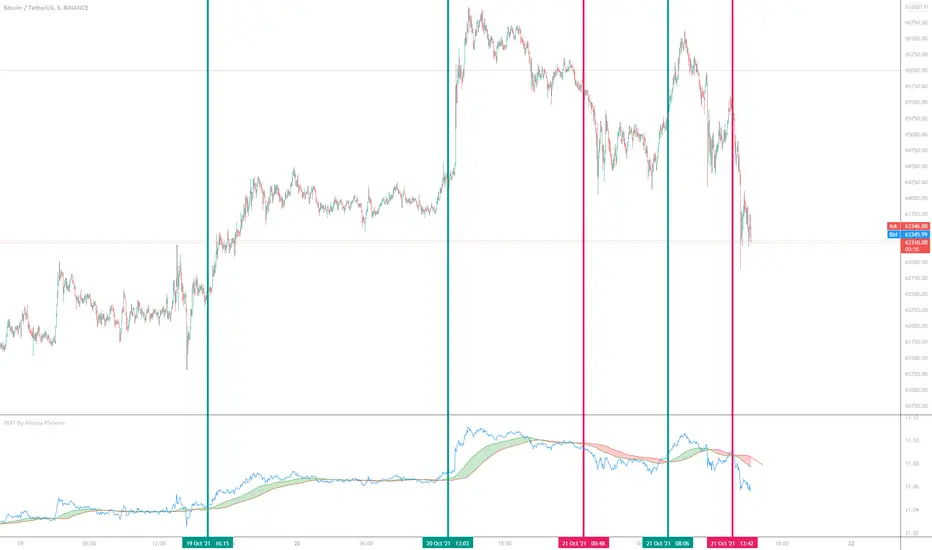
Price Movement Trend By Alireza Phoenix (Logarithmic)hi Traders
This logarithmic indicator shows the price movement trend, which is designed based on logarithmic functions and moving averages.
The Price Movement Trend Display Composed By :
A leading line consisting of the natural logarithm of Running Moving Average with length 60 and Offset 20 , and is displayed in red line.
A signal line consisting of a natural logarithm of an exponential moving average of length 90 , and is displayed in green line.
A price line consisting of the natural logarithm of a simple moving average along 1 whose source is price close , and is displayed in blue line.
A hidden price line consisting of the natural logarithm of a simple moving average along 1 and its source being the highest and lowest average prices , and is displayed in maroon line.
Learning how to get a signal from the price Movement trend indicator:
Moving the signal line and breaking the leading line upwards to form a green cloud is a buy signal.
Moving the signal line and breaking the leading line downwards that forms a red cloud is a sell signal.
Moving the price line and breaking the trend cloud upward , is a buy signal
Moving the price line and breaking the trend cloud downwards , is a sell signal
My instagram id : @pnxf6
ترجمه فارسی :
سلام تریدرها
این اندیکاتور لگاریتمی ، نمایش دهنده روند حرکتی قیمت است ، که بر اساس توابع لگاریتمی و میانگین های متحرک قیمت طراحی شده است
این اندیکاتور تشکیل شده از :
یک خط پیشرو متشکل از لگاریتم طبیعی متحرک وزنی نمایی مورد استفاده درآر اس آی به طول 60 و انحراف 20 است
یک خط سیگنال متشکل از لگاریتم طبیعی میانگین متحرک نمایی با طول 90
یک خط قیمت که متشکل از لگاریتم طبیعی میانگین متحرک ساده در طول 1 که منبع آن بسته شدن قیمت است.
یک خط قیمت مخفی که متشکل از لگاریتم طبیعی میانگین متحرک ساده در طول 1 و منبع آن میانگین بالاترین و پایین ترین قیمت است
یک فضای ابری مابین خط پیشرو و خط سیگنال که که با "نمایش روند حرکت قیمت" مشخص شده و در رنگ های سبز و قرمز قابل مشاهده میباشد.
آموزش گرفتن سیگنال ازاندیکاتور نمایش روند قیمت :
حرکت خط سیگنال و شکستن خط پیشرو رو به بالا که تشکیل ابر سبز رنگ میدهد یک سیگنال خرید میباشد .
حرکت خط سیگنال و شکستن خط پیشرو رو به پایین که تشکیل ابر قرمز رنگ میدهد یک سیگنال فروش میباشد .
حرکت خط قیمت و شکستن ابر روند حرکت قیمت رو به بالا سیگنال خرید میباشد
حرکت خط قیمت و شکستن ابر روند حرکت قیمت رو به پایین سیگنال فروش میباشد.
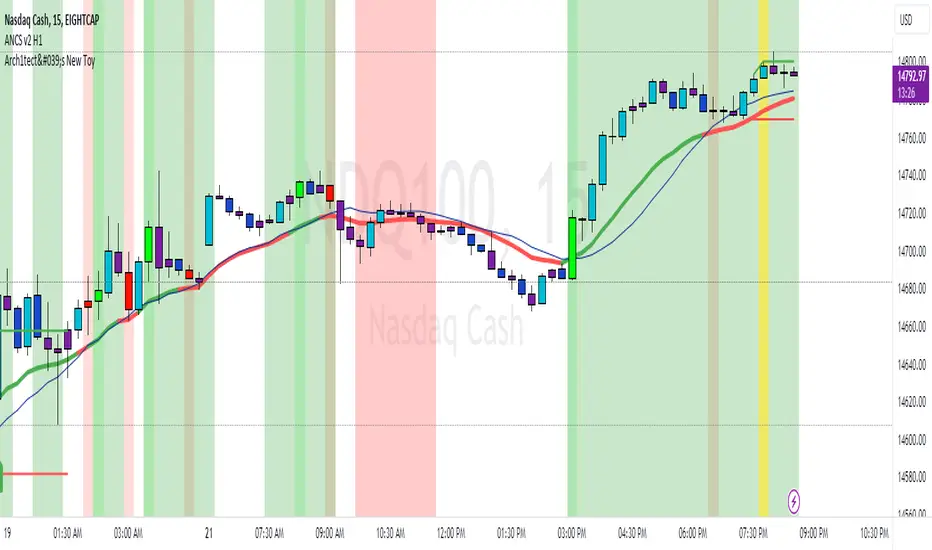
Arch1tect's New ToyDescription:
Arch1tect's New Toy tries to predict market trends by simply utilising 2 moving averages crossovers.
How it works:
Buy signals are triggered when the faster MA crosses over the slower MA from the downside to the upside.
Sell signals are triggered when the faster MA crosses under the slower MA from the upside to the downside.
How to use:
Take buys when buy signal is triggered AND close existing sell position
Take sells when sell signal is triggered AND close existing buy position
Note:
Settings are optimised for XAUUSD on the M1 chart.
Extra:
Alerts are included.
You can toggle between EMA , WMA and SMA to your liking.
Strategy Tester version:
Volume MA * Fibo levelsIn the scrypt above, the SMA of Volume is taken as a basis and the Fibonacci levels are calculated.
This can be useful for analyzing the trend in accordance with changes in volume.
Any feedback is appreciated!
Good luck with your trading!

multiMaLibrary "multiMa"
Provides function that returns the type of moving average requested.
ma(type, src, len) Returns the moving average requested.
Parameters:
type : The type of moving average (choose one of "EMA", "SMA", "DEMA", "TEMA", "WMA", "VWMA", "SMMA", "HMA")
src : The source
len : The length
Returns: The moving average requested or `na`

MACD Alert [All MA in one] [Smart Crypto Trade (SCT)]This code is a gift from "Smart Crypto Trade (SCT)" group
MACD indicator contains 3 EMA, I think one of the best usage of MACD is trend detection and divergences.
In our indicator, you can select the type of Moving averages that used in macd.
You can using "MACD" based on several types of moving averages including:
Exponential Moving Average ( EMA )
Volume-Weighted Moving Average ( VWMA )
Simple Moving Average ( SMA )
Weighted Moving Average ( WMA )
Exponentially Weighted Moving Average (RMA) that used in RSI
Smoothed Moving Average ( SMMA )
Arnaud Legoux Moving Average ( ALMA )
Double EMA ( DEMA )
Double SMA (DSMA)
Double WMA (DWMA)
Double RMA (DRMA)
Triple EMA ( TEMA )
Triple SMA (TSMA)
Triple WMA (TWMA)
Triple RMA (TRMA)
Linear regression curve Moving Average ( LSMA )
Variable Index Dynamic Average ( VIDYA )
Fractal Adaptive Moving Average ( FRAMA )
In other words we tried to collect all the most popular MAs in our MACD indicator.
In addition, you can use four types of alert or alarm conditions for detection LONG or SHORT positions and trends. For this, you must set an alert in alert tab and set the condition based on four defaults conditions.
Enjoy

MovingAveragesLibrary "MovingAverages"
Contains utilities for generating moving average values including getting a moving average by name and a function for generating a Volume-Adjusted WMA.
vawma(len, src, volumeDefault) VAWMA = VWMA and WMA combined. Simply put, this attempts to determine the average price per share over time weighted heavier for recent values. Uses a triangular algorithm to taper off values in the past (same as WMA does).
Parameters:
len : The number of bars to measure with.
src : The series to measure from. Default is 'hlc3'.
volumeDefault : The default value to use when a chart has no (N/A) volume.
Returns: The volume adjusted triangular weighted moving average of the series.
getMA(mode, len, src) Generates a moving average based upon a 'mode'.
Parameters:
mode : The type of moving average to generate. Values allowed are: SMA, EMA, WMA, VWMA and VAWMA.
len : The number of bars to measure with.
src : The series to measure from. Default is 'close'.
Returns: The volume adjusted triangular weighted moving average of the series.
4 SMAs & Inside Bar (Colored)SMAs and Inside Bar strategy is very common as far as Technical analysis is concern. This script is a combination of 10-20-50-200 SMA and Inside Bar Candle Identification.
SMA Crossover:
4 SMAs (10, 20, 50 & 200) are combined here in one single indicator.
Crossover signal for Buy as "B" will be shown in the chart if SMA 10 is above 20 & 50 and SMA 20 is above 50.
Crossover signal for Sell as "S" will be shown in the chart if SMA 10 is below 20 & 50 and SMA 20 is below 50.
Inside Bar Identification:
This is to simply identify if there is a inside bar candle. The logic is very simple - High of the previous candle should be higher than current candle and low of the previous candle should be lower than the current candle.
If the previous candle is red, the following candle would be Yellow - which may give some bullish view in most of the cases but not always
If the previous candle is green, the following candle would be Black - which may give some bearish view in most of the cases but not always
Be Cautious when you see alternate yellow and black candle, it may give move on the both side
Please comment if you have any interesting ideas to improve this indicator.

MA&AOThat is quit simple strategy, which combines only two indicators: AO and MA. The logic of trades is also clear, when AO is bullish; slow ma is under the close price; fast ma > slow ma - buy.

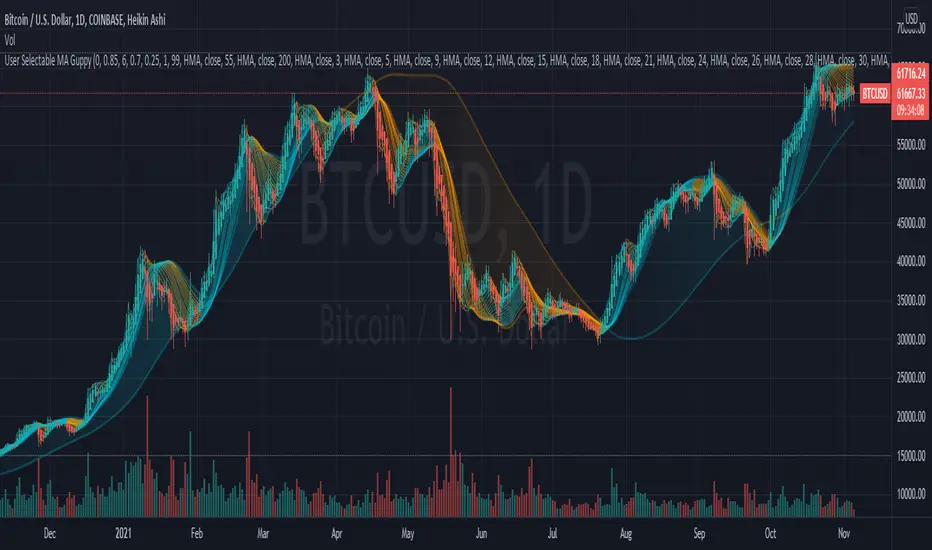
User Selectable Moving Average GuppyA version of the popular "Moving Average Ribbon" or "Guppy" indicators, except nearly everything about it is user selectable. The user can change the source, period, and type of moving average used for every single line on the chart. Note: The visuals are fairly intensive and may take a moment to catch up after adjusting settings.
Credit: This script utilizes the "Color Gradient Framework" tutorial by LucF (PineCoders) to create gradient visuals, which are also customizable for the user.
Moving Average Options:
Running (SMoothed) Moving Average (RMA or SMMA) - Slowest
Simple Moving Average (SMA) - Slow
Exponential Moving Average (EMA) - Responds faster to price than SMA
Weighted Moving Average (WMA)
Volume-Weighted Moving Average (VWMA)
Triple EMA (TEMA)
Exponential Hull Moving Average (EHMA) - Hull with Smoothing (Slower than Hull)
Least Squares Moving Average (LSMA) - Simple Linear Regression
Arnaud Legoux Moving Average (ALMA) - Adjustable, set offset=1 to be current, offset=0.85 for good smoothing (Slower)
Hull Moving Average (HMA) - Normally responds fastest to price of all options
Value Added :
This script is unique in that it allows the user to chart the "Guppy", except nearly everything about it is customizable. The user can change the source, period, and type of moving average used for every single line.
Typically, the Guppy is plotted with simple moving average or exponential moving average, which respond much slower to price than the Hull Moving Average, which this indicator uses as default. (Elimination of lag)
The Hull MA settings for the highest time frame moving averages should work well for assessing the overall macro trend, with a nice visual presentation. Additional labels and alerts for the macro trend are available.
Furthermore, this script provides many more options for type of moving average than is typical for a moving average indicator that provides the user with options, including advanced options such as Hull, TEMA, and ALMA.
The visual presentation is customizable and should provide some entertainment for users who want to create pretty charts.
7 Moving Averages [Plus]Moving Averages are price based, lagging (or reactive) indicators that display the average price of a security over a set period of time. A Moving Average is a good way to gauge momentum as well as to confirm trends, and define areas of support and resistance. Essentially, Moving Averages smooth out the “noise” when trying to interpret charts. Noise is made up of fluctuations of both price and volume. Because a Moving Average is a lagging indicator and reacts to events that have already happened, it is not used as a predictive indicator but as an interpretive one for confirmations and analysis.
Bollinger Bands (BB) are a widely popular technical analysis instrument created by John Bollinger. The BB consist of a band of three lines which are plotted in relation to security prices. The line in the middle is usually a Simple Moving Average (SMA) set to a period of 20 days (the type of trend line and period can be changed by the trader; however a 20 day moving average is by far the most popular). The SMA then serves as a base for the Upper and Lower Bands which are used as a way to measure volatility by observing the relationship between the Bands and price. Typically the Upper and Lower Bands are set to two standard deviations away from the SMA (The Middle Line); however the number of standard deviations can also be adjusted by the trader.
This script shows 6 moving averages and Bollinger Bands.
Features:
- Standard MA inputs.
- MA type.
- MA period.
- MA source.
- MA resolution (time frame).
- MA Offset.
- Forecasting : forcasted prices are calculated using our MAType and MASource for the MAPeriod.
- Trail: Show only candles not included in the MA calculation.
The color of MA1 depends on the chosen strategy, by default this is the 3EMA strategy. You can also select "Pivot Point Supertrend" or "Ichimoku Trend"
Added "Parabolic Stop and Reverse (PSAR)" . The PSAR is a time and price technical analysis tool primarily used to identify points of potential stops and reverses. In fact, the SAR in Parabolic SAR stands for "Stop and Reverse". The indicator's calculations create a parabola which is located below price during a Bullish Trend and above Price during a Bearish Trend.
Added "Linear Regression Channel" which can be correctly plotted on logarithmic charts. A linear regression channel consists of a median line with 2 parallel lines, above and below it, at the same distance. Those lines can be seen as support and resistance. The median line is calculated based on linear regression of the closing prices but the source can also be set to open, high or low. The height of the channel is based on the deviation of price to the median line. Extrapolating the channel forward can help to provide a bias and to find trading opportunities.

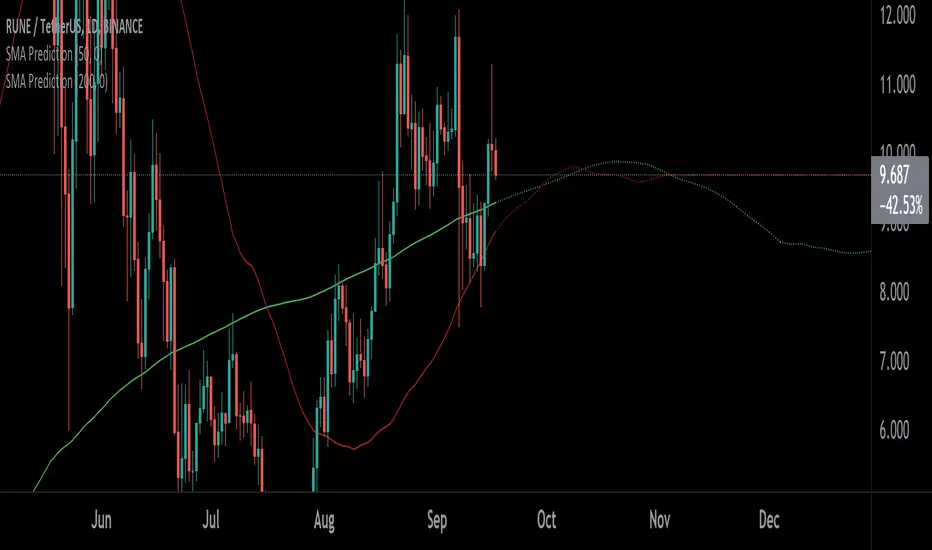
SMA PredictionThis indicator predicts future moving average (SMA) values assuming the prices remains at configured level (-50% to +50%).
It can be used to predict golden/death crosses as well - when two of these indicators are on - one configured for length 50 and one for length 200.
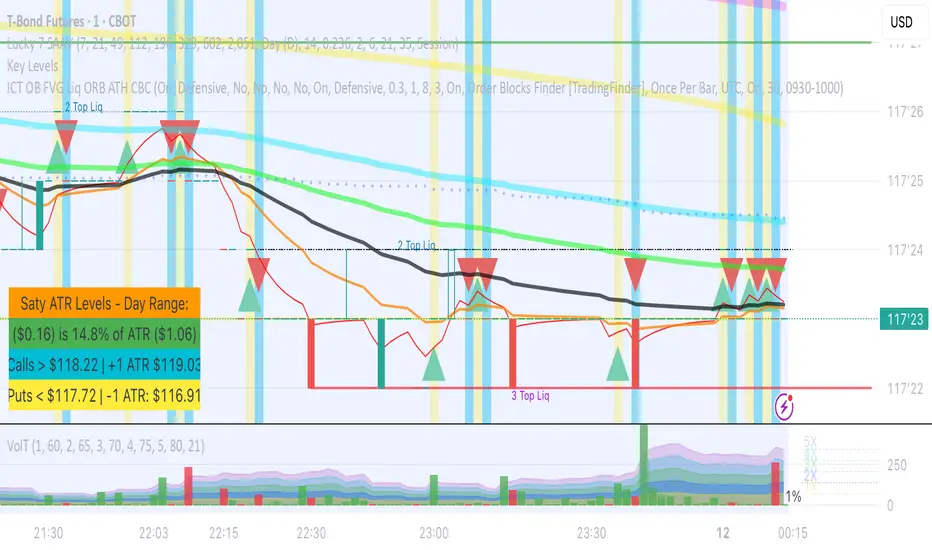
VolT by empowerTVolT is conceived to expose and alert volume volatility.
Using 21-candle moving average volume values compared to the current candle volume, you can graphically see the volume as it comes in - as a percentage of the historic 1X volume moving average.
Getting close to 2X or 5X of the 21-candle SMA? Just glance at the transparent plots behind the volume bars - or the actual percentage value in yellow.
Never wonder again how much volume that bar is compared to previous volume - now you know. Set alerts based on the volume crossing your chosen volume SMA. You'll never be surprised that the hedgies loaded up and left you behind, because you'll be right there loading up with them. (Let me know if you need help setting the alerts...)
As always, your feedback and criticisms are appreciated.