Day Trading Signals Trend & Momentum Buy/Sell [CocoChoco]Day Trading Signals: Trend & Momentum Buy/Sell
Overview
The indicator is a comprehensive day-trading tool designed to identify high-probability entries by aligning short-term momentum with long-term trend confluence.
It filters out low-volatility "choppy" markets using ADX and ensures you are always trading in the direction of the dominant higher-timeframe trend.
Important: Use on timeframes from 15 min to 2 hours, as the indicator is for day trading only.
How It Works
The script uses a three-layer confirmation system:
Trend Alignment: Uses a Fast/Slow SMA cross (10/50) on the current chart. Signal prints only if price closes above (for bullish) or below (for bearish) the 10-period SMA.
Higher Timeframe Confluence: The script automatically looks at a higher timeframe (1H for charts <=15m, and 4H for others) and checks if the price is above/below a 200-period SMA.
Momentum & Volatility: Signals are only triggered if the Stochastic Oscillator is rising/falling and the ADX is above 20, ensuring there is enough "strength" behind the move.
Visual Signals Buy/Sell
Green Label (Up Arrow): Bullish entry signal
Red Label (Down Arrow): Bearish entry signal.
Red "X": Exit signal based on a moving average crossover (trend exhaustion).
Visual Risk/Reward (1:1) Boxes: When a signal appears, the script automatically draws a projection of your Stop Loss (Red) and Take Profit (Green) based on the current ATR (Average True Range).
How to Use
Entry: Enter when a Label appears. Ensure the candle has closed to confirm the signal.
Stop Loss/Take Profit: Use the visual boxes as a guide. The default is 1.0 ATR for risk and 1.0 RR ratio, which can be adjusted in the settings.
Exit: Exit the trade either at the target boxes or when the Red "X" appears, indicating the trend has shifted.
Please note that this is just a tool, not financial advice. Perform your own analysis before entering a trade.
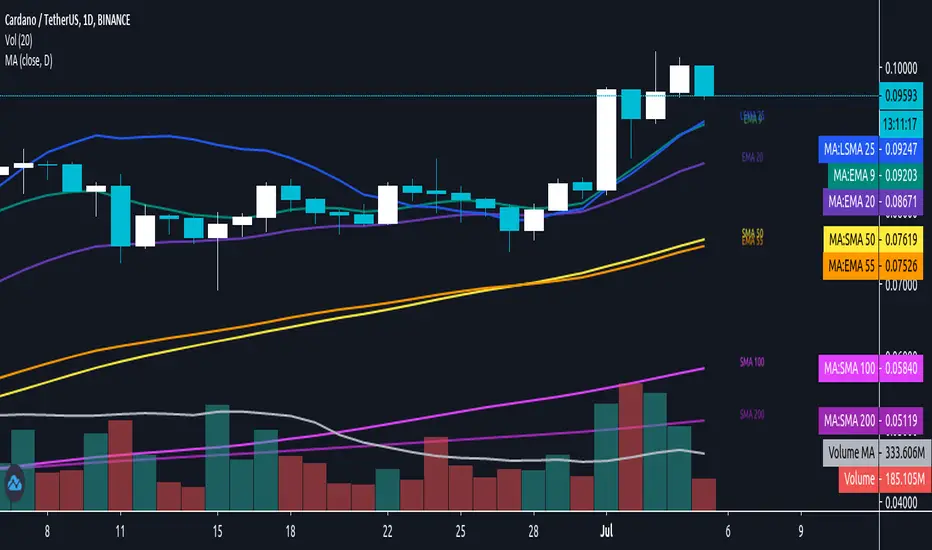
Sma50

Swing Data [ATR Ext | RVol | ADR | Ticker/Sector RS]Disclaimer : This indicator is not financial advice and is strictly for educational and informational purposes only. The metrics and signals provided herein—including ATR extensions, volume projections, and rolling alpha for relative strength — are calculated based on historical market data and do not guarantee future performance. Trading stocks and commodities involves significant risk of loss. The user assumes full responsibility for all trading decisions and should always perform their own due diligence before executing trades.
Hello there. I was inspired after reading this Twitter post by Steve Jacobs regarding the ATR Matrix. I followed Steve's recommendation to the interesting indicator built by @Fred6724 for @jfsrev but I couldn't match my manual calculations to their math. So, I threw together this TradingView indicator to match my own manual calculations for the ATR Extension Multiple. And then, I added more quality-of-life features that I found useful in my daily workflow such as table positioning, specific data streams, threshold customization, and conditional coloring. This became quite a snowball.
Daily Chart : Please note that the design for this indicator was focused on the daily chart. Edge case testing has not been fully conducted for other charting periods, although the math should apply agnostically. The calculations of rolling alpha for Ticker RS and Sector RS fetch daily data instead of the displayed chart period, which may affect Ticker RS if you have turned on pre-market and after-market.
Relative Strength Differential reveals rolling alpha: One way to read the Ticker RS and Sector RS is... this stock is beating SPY by +75% in the past 63 days and blue color means the stock's outperformance is accelerating but the sector of this stock is beating SPY by a sleepy 3% and orange color means the sector's performance against the broader market is shrinking... so at a glance, we can conclude this is a strong stock in a lagging sector.
Status Line : The script outputs the raw ATR Extension value, ATR%, and a Boolean (0/1) for the ATR Extension alert dot directly to the Status Line. This allows you to hover your mouse over any historical candle to see exactly how extended price was on that specific candle, without needing to calculate it manually. These values are coded to display as text only. They provide the data you need without drawing distracting line plots across your price action. In the Style Tab of the indicator settings, you will see checkboxes for these values. Avoid toggling them off and on. Doing so can override the script’s default "invisible" setting and force TradingView to draw unnecessary lines on the chart.
Data streams available for turning on/off:
ATR Multiple above SMA (default SMA50, default alert on candle >6 multiple, the simple math is Price minus SMA50 and then divide by ATR)
ATR Percent (default period length 14)
ATR Value
Percent Distance from SMA (default SMA50)
Projected Relative Volume calculated against Average Volume (default 60 day avg vol)
Projected Volume (estimates end of day volume based on current volume at elapsed time)
Projected Dollar Volume (estimates end of day turnover based on projected volume x current price... it's a ballpark for gauging liquidity... time arrays for modestly more accurate turnover projection is compute heavy and low signal intel)
Average Volume (default 60 day)
Average Dollar Volume (default 60 day)
ADR Percent (default period length 20 while TradingView prefers 14)
ADX (default period length 14)
Low of Day Price
Dynamic Stop Loss (default Stop MA length 10 and Stop ATR multiple 0.5, adjust at your preference)
Market Capitalization (calculates latest Fiscal Quarter's Shares Outstanding x Price)
Ticker RS vs SPY (calculates the stock's 63-day rolling performance against the broader market to quantify raw outperformance percentage; the text color signals velocity, turning default blue if the relative strength is flying above the 21-day average of this relative strength or default orange if shrinking below)
Sector RS vs SPY (calculates the sector's 63-day rolling performance against the broader market to quantify raw outperformance percentage; the text color signals velocity, turning default blue if the relative strength is flying above the 21-day average of this relative strength or default orange if shrinking below)
Sector (basic exception handling such as metal/energy/crypto in ambiguous industries and GICS industry overrides, see code block below)
Industry (pulls TradingView's syminfo, truncates when too long)
Advanced mapping of the Sector string to a specific ETF, GICS Compliant.
// 1. Get Sector and Industry Strings
// 'str.lower' converts the description to lowercase to make keyword matching easier (case-insensitive).
string sec_raw = syminfo.sector
string ind_raw = syminfo.industry
string desc_raw = str.lower(syminfo.description)
// Default Fallback: If no match is found, we compare against SPY (Market Average).
string sec_etf = "SPY"
// 2. DEFINE CONDITIONAL GATES (The Safeguards)
// CRITICAL: We only want to scan for keywords (like "Silver") if the stock is in a vague industry bucket.
// This prevents "False Positives". For example, we don't want "Silvergate Bank" (Regional Banks)
// to be accidentally reclassified as a Mining stock just because it has "Silver" in the name.
bool is_ambiguous = ind_raw == "Investment Trusts/Mutual Funds" or ind_raw == "Miscellaneous" or ind_raw == "Financial Conglomerates" or ind_raw == "Other Metals/Minerals" or ind_raw == "Precious Metals"
// 3. KEYWORD LOGIC (Only runs inside the Gate)
// RULE A: COMMODITY TRUSTS (Metals -> XLB)
// Fixes: PSLV, PHYS, SPPP, GLD, SLV which are legally "Financial Trusts" but trade like Commodities.
// Logic: If it's a Trust AND mentions "Silver/Gold/Bullion", map to Materials ( AMEX:XLB ).
bool has_metal = str.contains(desc_raw, "silver") or str.contains(desc_raw, "gold") or str.contains(desc_raw, "bullion") or str.contains(desc_raw, "platinum") or str.contains(desc_raw, "palladium") or str.contains(desc_raw, "precious")
// RULE B: ENERGY TRUSTS (Oil/Uranium -> XLE)
// Fixes: USO, UNG, SPUT (Uranium).
// Logic: Uranium and Oil trusts correlate with Energy ( AMEX:XLE ), not Financials.
bool has_energy = str.contains(desc_raw, "oil") or str.contains(desc_raw, "natural gas") or str.contains(desc_raw, "petroleum") or str.contains(desc_raw, "uranium") or str.contains(desc_raw, "crude")
// RULE C: CRYPTO PROXIES (Bitcoin/Ether -> XLK)
// Fixes: GBTC, IBIT, FBTC.
// Logic: Crypto equities currently have the highest correlation with High-Beta Tech ( AMEX:XLK ).
bool has_crypto = str.contains(desc_raw, "bitcoin") or str.contains(desc_raw, "ethereum") or str.contains(desc_raw, "crypto") or str.contains(desc_raw, "coin")
// 4. EXECUTE KEYWORD MAPPING
if is_ambiguous and has_metal
sec_etf := "XLB" // Force Metals to Materials
else if is_ambiguous and has_energy
sec_etf := "XLE" // Force Energy Trusts to Energy
else if is_ambiguous and has_crypto
sec_etf := "XLK" // Force Crypto to Tech (Risk On)
// 5. GICS INDUSTRY OVERRIDES (The "Standard" Fixes)
// These rules fix known classification errors where TradingView data lags behind GICS reclassifications.
// EXCEPTION: PAYMENT PROCESSORS (The "Visa" Rule - 2023 Update)
// Visa ($V), Mastercard ( NYSE:MA ), and PayPal ( NASDAQ:PYPL ) are now Financials ( AMEX:XLF ), not Tech.
else if ind_raw == "Data Processing Services"
sec_etf := "XLF"
// EXCEPTION: COMMUNICATIONS (The "Google/Meta" Rule - 2018 Update)
// Separates "Internet" and "Media" stocks ( NASDAQ:GOOGL , NASDAQ:META , NASDAQ:NFLX ) from "Packaged Software" ( NASDAQ:MSFT ).
// These belong in Communications ( AMEX:XLC ).
else if ind_raw == "Internet Software/Services" or ind_raw == "Advertising/Marketing Services" or ind_raw == "Broadcasting" or ind_raw == "Cable/Satellite TV" or ind_raw == "Movies/Entertainment"
sec_etf := "XLC"
// EXCEPTION: REAL ESTATE (The "REIT" Rule)
// Pulls REITs out of the Financials bucket ( AMEX:XLF ) and into their own sector ( AMEX:XLRE ).
else if str.contains(ind_raw, "Real Estate") or str.contains(ind_raw, "REIT")
sec_etf := "XLRE"
// EXCEPTION: AUTO MANUFACTURERS (The "Tesla" Rule)
// Tesla ( NASDAQ:TSLA ), Ford ($F), and GM are Consumer Discretionary ( AMEX:XLY ), not Tech or Industrials.
else if ind_raw == "Motor Vehicles"
sec_etf := "XLY"
// EXCEPTION: INTERNET RETAIL (The "Amazon" Rule)
// Amazon ( NASDAQ:AMZN ) and eBay are Consumer Discretionary ( AMEX:XLY ), distinct from generic "Retail Trade" ( AMEX:XRT ).
else if ind_raw == "Internet Retail"
sec_etf := "XLY"
// EXCEPTION: TEXTILES & APPAREL
// Nike ( NYSE:NKE ), Lululemon ( NASDAQ:LULU ), and Ralph Lauren are Consumer Discretionary ( AMEX:XLY ).
else if ind_raw == "Apparel/Footwear" or ind_raw == "Textiles"
sec_etf := "XLY"
// EXCEPTION: AEROSPACE & DEFENSE (The "Lockheed" Rule)
// Often mislabeled as Tech in some feeds, strictly belongs to Industrials ( AMEX:XLI ).
else if ind_raw == "Aerospace & Defense"
sec_etf := "XLI"
// EXCEPTION: SEMICONDUCTORS
// Explicit check to ensure Semis ( NASDAQ:NVDA , NASDAQ:AMD ) always stick to Tech ( AMEX:XLK ).
else if ind_raw == "Semiconductors"
sec_etf := "XLK"
// 6. STANDARD FALLBACKS
// If the stock didn't trigger any exception above, map based on the broad Sector name.
else
sec_etf := switch sec_raw
"Technology Services" => "XLK" // Microsoft, Oracle, Adobe
"Electronic Technology" => "XLK" // Apple, Hardware
"Finance" => "XLF" // Banks, Insurance
"Health Technology" => "XLV" // Pharma, Biotech
"Health Services" => "XLV" // Managed Care (UNH)
"Retail Trade" => "XRT" // Home Depot, Walmart (Retailers)
"Consumer Non-Durables" => "XLP" // Coke, P&G (Staples)
"Energy Minerals" => "XLE" // Exxon, Chevron (Oil)
"Industrial Services" => "XLI" // Construction, Engineering
"Consumer Services" => "XLY" // Restaurants, Hotels
"Consumer Durables" => "XLY" // Homebuilders, Appliances
"Utilities" => "XLU" // Power, Water
"Transportation" => "XTN" // Airlines, Rail, Trucking
"Non-Energy Minerals" => "XLB" // Steel, Copper, Chemicals
"Commercial Services" => "XLC" // Remaining Media/Comms
"Communications" => "XLC" // Legacy tag
"Distribution Services" => "XLY" // Wholesalers
=> "SPY" // Final Catch-All

Daily/MTF Moving Averages (EMA20, EMA55, SMA50, SMA100, SMA200)Script to plot common daily/alternative timeframe moving averages on when viewing securities at other resolutions.
There's lots of different MA scripts out there, but I couldn't find one that just represented the standard support/resistance indicators that were typical for my markets. So, this is the DIY. :)
sma 50 100 200 multi Timframes actual daily weekly monthlysma 50-100-200
Just 3 sma from actual,daily,weekly and monthly timeframe
SMA colour changeThis SMA will change colour when the price crosses above and below.
When the Price is above, the SMA will be GREEN to indicate you should look for BUY entries.
When the Price is below, the SMA will be RED to indicate you should look for SELL entries.
The default is set to 50 SMA, this can be changed in the settings to suit your requirements.

SMA 50 collector V2Hi everyone
The today script is an upgrade on steroids of my previous SMA 50 collector
Why this script ?
The SMA 50 is known to define a trend. If price is closing above, trend is bullish , if below, trend is bearish.
That's why I like to have all of them in all timeframes on my chart :)
Those are very relevant for all assets class : FOREX, INDEX, STOCKS, CRYPTO, ...
What's the update ?
I added new timeframes and developped a small optimization to get those labels placed on the right hand side of your screen.
"Is it really useful sir ?" Well, you certainly noticed that looking at a chart on tradingview mobile is not ideal (indicators overlapping, indicator names taking too much space and so on...)
When you'll deactivate the indicator name label display from tradingview, you can activate mine which will look way nicer on your mobile (and even Desktop).
This concept was greatly inspired by @scarf :
HOW TO USE IT ?
You can activate/deactivate the SMA50 you (don't) need in the style section of the indicator configuration UI. You'll just have to uncheck/check. Simple right :) ?
See y'all tomorrow for the next indicator or idea. The one for tomorrow should blow your mind as it certainly did when I discovered and optimized it
Enjoy
Dave
