Sonarlab - Smart Money ConceptsSupply and Demand is one of the core strategies used in trading. It focuses on the ancient laws of supply and demand and how price moves in a free-flowing market. Supply and demand zones are a popular analysis technique used in all kinds of trading styles. The zones are the periods of sideways price action that come before explosive price moves, and are typically marked out using a box. We wanted to make these squares drawn automatically for you - so it will save you time spotting the zones.
Green Box
The green box defines demand - in these areas you will look for long opportunities. You can also use these zones for take profit levels when you are in a sell trade.
Blue Box
The blue box defines supply - in these areas you will look for short opportunities. You can also use these zones for take profit levels when you are in a buy trade.
Break of structure
For markets to move up and down a break in market structure must occur. A break in market structure occurs when the market begins to shift direction and break the previous HH and HL or HL and LL of the market. We also integrated the feature that you can see the BOS lines. In the indicator settings you can adjust the values:
1) Sensitivity
2) Min. candles in structure
3) BOS type: close or wick
Warning Never blindly take a position on each box - wait for a proper signal to occur before considering a position.
SMC
DFXT Smart Money ToolsAdded some additional features that may be useful for those trading smart money concepts.
~ Higher time frame candle Open, High, Low and close marker: for reference of where you are in price.
~ Asian Session High and Low marker: Can be used to clearly see runs on the Asian range.
~ Engulfing Candle detector: Marks engulfing candles in a colour of your choice.
~ Impulsive Candle detector: Marks Impulsive candles in a colour of your choice.
~ Quarter's Theory: Marks Quarter levels on the chart.
~ Doji Candle: Marks Doji candles in a colour of your choice.
~ Inside Bar detector: Marks Inside bars in a colour of your choice.
~ Imbalance detector: Marks Bullish and bearish imbalance in a colour of your choice.
~ Zig-Zag structure: Classic ZZ indicator that can be used to simplify the structure.
~ Liquidity Wicks: Wicks that take Liquidity then close back inside the range.
~ Session Marker: Markers the various trading sessions in a background colour of your choice.
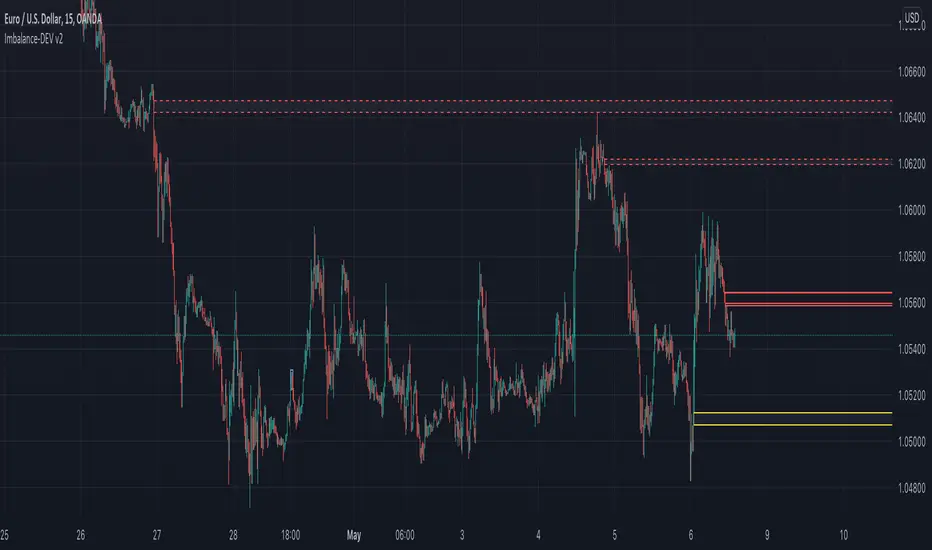
AMD-ImbalanceThis script looks at three consecutive candles and if there is an area between the wicks of the first and third candle, it will paint a box to mark the area.
The marked area is considered an imbalance or inefficiency in the market. Price usually finds its way back to that area of imbalance to clear it.
As price clears part of the area of imbalance, the box turns from a solid border to a dashed border.