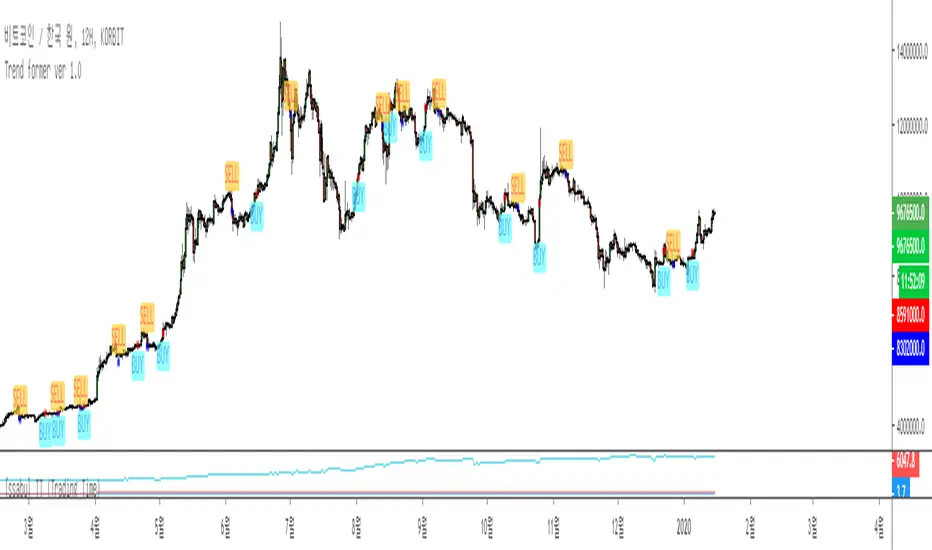
Siege mode 1.4The new trend following indicator Siege mode1.4.
This is a real-time algorithm that allows signal output in the middle of a rod without repainting, such as Basel major swing and Trend former.
Therefore, the seed change graph can be reliably measured at the time of sale by setting the purchase and sale to 1:1.
It is an algorithm developed based on the most optimized strategic position in the stock market and coin market.
The signal as a whole helps to cope with a lot of swipes and to buy from the knee and sell from the shoulder.
새로운 추세추종 지표 Siege mode1.4 입니다.
Basel major swing, Trend former와 같이 리페인팅 없이 봉 중간에 시그널 출력이 가능한 후행이 아닌 실시간 알고리즘 입니다.
때문에 매수와 매도를 1:1로 설정하여 해당 매매시의 시드변화그래프를 신뢰도 있게 측정 할 수 있습니다.
주식시장과 코인시장에서 가장 최적화 된 전략 포지션을 기반으로 발전된 알고리즘입니다.
시그널 전체적으로 많은 휩쏘에 대처하여 깔끔하게 발생하여 무릎에서 매수하여 어깨에서 매도하는데 많은 도움을 줍니다.
Black line is Siege mode1.4 total balance, Red line is Hodl total balance
result based on Commission 0.1% Slippage 0.1%
검정선이 Siege mode1.4 시드변화 그래프 빨간선이 존버 ( 슬리피지 0.1%, 수수료 0.1% 적용 )
Black line is Siege mode1.4 total balance, Red line is Hodl total balance
result based on Commission 0.1% Slippage 0.1%
검정선이 Siege mode1.4 시드변화 그래프 빨간선이 존버 ( 슬리피지 0.1%, 수수료 0.1% 적용 )
Black line is Siege mode1.4 total balance, Red line is Hodl total balance
result based on Commission 0.1% Slippage 0.1%
검정선이 Siege mode1.4 시드변화 그래프 빨간선이 존버 ( 슬리피지 0.1%, 수수료 0.1% 적용 )
Black line is Siege mode1.4 total balance, Red line is Hodl total balance
result based on Commission 0.1% Slippage 0.1%
검정선이 Siege mode1.4 시드변화 그래프 빨간선이 존버 ( 슬리피지 0.1%, 수수료 0.1% 적용 )
Black line is Siege mode1.4 total balance, Red line is Hodl total balance
result based on Commission 0.1% Slippage 0.1%
검정선이 Siege mode1.4 시드변화 그래프 빨간선이 존버 ( 슬리피지 0.1%, 수수료 0.1% 적용 )
트레이딩은 열심히 하는 것이 잘하는게 아니라, 선택을 잘하는 것이 잘하는 것이다
Trading is not about working hard, but choosing good
- SSABU -
PM us to obtain access
Ssabu

New T - ZONE Indicator✅ ssabu "New T - ZONE" Lecture Indicator
It is a secondary indicator that filters the buy interval for a position.
It also aims to capture the highs and lows of the trend.
However, the highs and lows of the trend are not for buying, but for selling.
There is no repainting on the indicator, and the steep line, the steep line, the sell line + the long short line are added to the indicator, so you can get help in trading by section.
The gray line is the line that marks a sharp rise and fall, and the sky blue and orange lines are the lines that mark the sale.
✅ ssabu "뉴티존" 강의용보조지표
롱과 숏에 대한 매수구간을 필터링 해주는 수강생 전용 보조지표 입니다.
추세의 최고점과 최저점을 포착하는 것 또한 목표로 합니다.
하지만 추세의 최고점과 최저점은 매수를 위한 포착이 아닌 매도를 위한 포착이 됩니다.
지표에 리페인팅은 발생하지 않으며 급등선과 급락선 매도선 + 롱숏선이 지표에 추가되어 구간 별로 매매에 도움을 받을 수 있습니다
회색선은 급등과 급락을 표시해주는 선이고 하늘색과 주황색은 매도를 표시해주는 선이 됩니다.
트레이딩은 열심히 하는 것이 아니라 선택을 잘해야 하는 것이다
Trading is not about working hard, but choosing good
- SSABU -

[ssabu] TT (Trading Time)✅ TT(Trading Time)
The supplementary indicators are based on 12-hour pay.
Graph of seed change when bought at market price and sold at closing price
When we bought at the closing price and sold at the market
It is a supplementary indicator that compares the seed change graph when it is in the same period.
The cryptocurrency market is open 24 hours, but there's definitely a time for more upside. (Not 100%, very high probability)
It is a supplementary indicator that provides back data about it.
Red seed change graph shows Johnsbury's fund change
The other two graphs, light green and blue, are the difference in the seeding changes between the different buy and sell prices at the market price and closing price.
There is a very high probability of maintaining a much higher seed in more grass green stocks.
What time of day is the seed change graph that you bought and sold at what time?
The answer is in the indicator.
If you know the time, whatever trading method and algorithm you use will increase your winnings and profits.
(These secondary indicators are designed to operate only on 30 minute, 1 hour, 2 hour, 3 hour, 4 hour, 6 hour, 12 hour rods.)
해당 보조지표는 12시간봉 기준으로
싯가에 사서 종가에 팔았을 때의 시드변화 그래프와
종가에 사서 싯가에 팔았을 때의 시드변화 그래프와
같은 기간에 존버 했을 시에 시드변화 그래프를 비교해주는 보조지표입니다.
암호화폐 시장은 24시간 열려있지만 분명히 상승구간이 더 많이 나오는 시간이 정해져 있습니다. (100%는 아니고 굉장히 높은 확률적으로)
그에 대한 백데이터를 제공해주는 보조지표 입니다.
빨간색 시드변화 그래프는 존버시의 자금변화
연두색과 파란색의 다른 두 그래프는 싯가와 종가의 다른 매수와 매도의 시드변화 차이입니다.
굉장히 높은 확률로 연두색이 많은 종목에서 훨씬 더 높은 시드를 유지해주고 있습니다.
연두색은 어떤 시간에 매수하여 어떤 시간에 매도한 시드변화 그래프일까요?
지표 안에 답이 나와있습니다.
그 시간을 알 수 있다면 당신은 어떤 매매법과 알고리즘을 사용하던 당신의 매매는 승률과 손익비가 올라가게 될 것 입니다.
(해당 보조지표는 30분, 1시간, 2시간, 3시간, 4시간, 6시간, 12시간 봉에서만 동작하도록 설계되어 있습니다.)
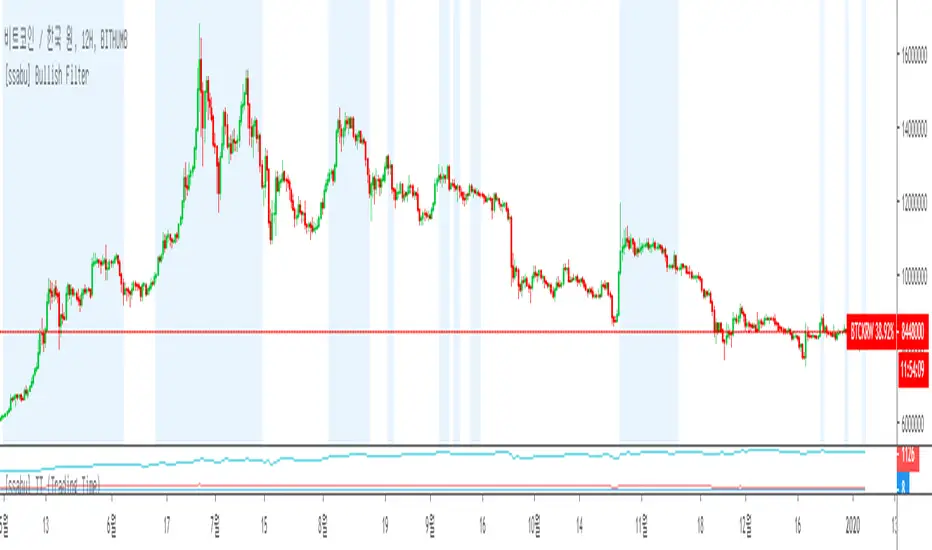
[ssabu] Bullish Filter✅ Bullish Filter
This sub indicator is a sub indicator that changes the background color for the rising section in the frame below one day.
Buying and selling only in the upside section is an important reference when entering the position as it is closely related to the increase in the win rate and profit and loss.
The sub-indicators work in the 30 minutes, 1 hour, 2 hours, 3 hours, 4 hours, 6 hours, and 12 hours, but not in other timeframes.
In addition, all the frames where the background color changes are the same.
There is no problem with repainting where the background color changes.
해당 보조지표는 일봉이하의 프레임에서 상승구간에 대하여 배경색을 바꿔주는 보조지표입니다.
상승구간에서만 매매를 하는 것은 승률 및 손익비의 상승과 밀접한 관련이 있기 때문에 포지션의 진입시에 중요한 참고사항이 됩니다.
30분, 1시간, 2시간, 3시간, 4시간, 6시간, 12시간의 타임프레임에서 해당 보조지표는 동작하고 이 외의 타임프레임에서는 동작하지 않습니다.
(일봉 이하의 단기프레임의 매매에서 도움을 주기 위함)
또한 모든 프레임에서 배경의 색깔이 변경되는 구간은 모두 같습니다.
배경색이 바뀌는 리페인팅에 관한 문제는 없습니다.
[ssabu] Renko Chart✅ Renko Chart Indicator
실시간으로 캔들 차트를 렌코차트로 바꿔서 배경에 렌코차트를 자동으로 그려주는 인디케이터 입니다.
It is an indicator that automatically draws a Renko chart in the background by changing the candle chart to a Renko chart in real time.
위의 사진은 캔들차트를 렌코로 바꾸고 해당 인디케이터를 적용한 스크린샷
Above picture is a screenshot of changing the candle chart to Renko and applying the indicator


ssabu Lecture Indicator2✅ ssabu Long Short Compass
✅ ssabu 강의용보조지표
강의의 매매법을 마진에 이용하는데 있어서 롱과 숏의 방향에 필터링을 더해주는 마진용 보조지표입니다.
초록색선이 저가로 떨어지면 롱을 기준으로 매매법(S기법, F기법)을 사용하시면 되고
빨간색선이 저가로 떨어지면 숏을 기준으로 매매법(역S기법, 역F기법)을 사용하시면 됩니다.
현물은 매수를 초록색선으로 이용하여 기법(S기법, F기법)을 사용하시면 되고 매도는 빨간색선으로 이용하여 OS기법을 이용하시면 됩니다.
✅ ssabu Lecture Indicator
It is a supplementary index for margins that adds filtering to the direction of long and short in using lecture trading method for margin.
If the green line drops at a low price, you can use the long sales method.
If the red line falls at a low price, you can use the trading method based on short.
You can use the technique using the green line as the number of spot and use the OS technique as the red line.


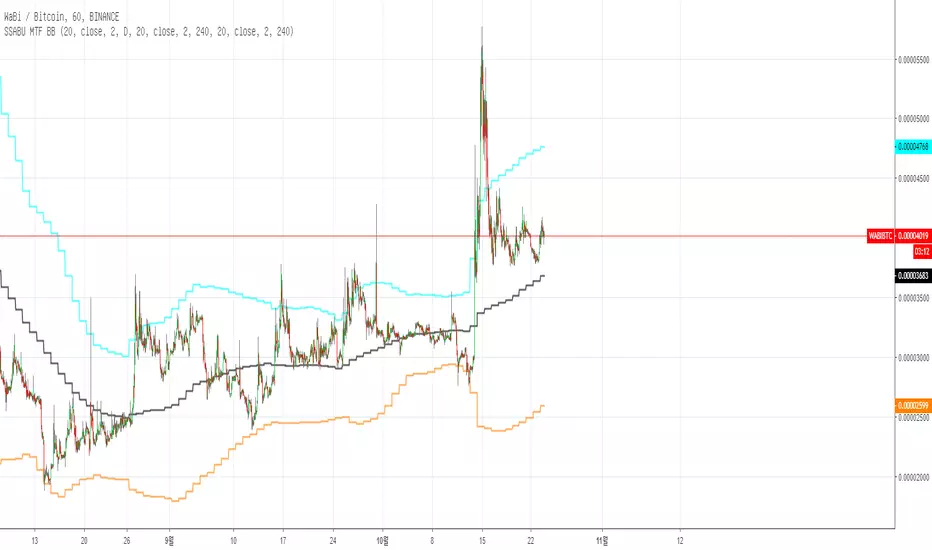
SSABU MTF BB
✅ MTF BB (Multi-Time Frame Bollinger Band) Indicator.
This indicator is a supplementary indicator for viewing the BB value of the high frame splitting in the low frame splitting.
If you set the indicator instead of entering the time directly, you can set 1/3/5/13/30/45 minutes 1/2/3 / hour for 1 week from BB1 MTF Set (Minute).
The default setting is 4H and the number of BB is 3.
The above screenshot shows a BB with a one-hour stick in the chart of 1 hour's bar.
✅ MTF BB (멀티 타임 프레임 볼린저 밴드) 지표입니다.
본 지표는 낮은 프레임의 분봉에서 높은 프레임의 분봉의 BB수치를 볼 수 있는 보조지표 입니다.
직접 시간을 입력 하는 건 아니고 지표를 설치하시면 BB1 MTF Set(Minute)에서 1/3/5/13/30/45분 1/2/3/시간 1일 1주로 설정이 가능합니다.
기본설정은 4H으로 되어있고 BB갯수는 3개로 구성되어 있습니다.
위의 스크린샷은 1시간봉의 차트에서 일봉의 BB를 적용한 모습입니다.
✅ Other indicators to help you trade
✅ 매매에 도움되는 다른 보조지표
Basel major swing ver 2.2