Omnisphere UniverseFor those who likes stars in their chart :) Fits pretty well to my Omnisphere PREMIUM indicator. Cheers! IncrediBullPine Script®指標由INCREDI_BULL提供已更新 8
Gann Box by time frame █ OVERVIEW This script is designed to plot Gann boxes within a specific time frame candle. That means, you can get your intraday Gann box with one click and zoom in to low time frame. Highs and lows are set by candle chosen, you can display the yearly Gann box if that's something you want to view! In addition, this script can highlight the golden ratio and its inverse ( .618 & .382 ) within the box itself. You have the option to select between a daily, a weekly, or a monthly candle. Not to mention that you have the ability to select a multiplier to those candles, where for example, you would be able to plot the 3 month ( quarterly ) gann box. or the yearly by selecting 12 months! This script includes zero, one and two divisions to Gann box. The first division would get you the sun lines only. while the first division has the middle 0.5 point and so on. This script is meant to be used as a one-click fast solution. Highs and lows get adjusted as the chart breaks those levels automatically. █ Future Plans and upgrades to this script may include : 1. Adding more divisions. 2. Data box that shows box stats and performance. 3. More geometrical features such as the spirals and the circles on demand by one click. and more! feel free to let me know what you'd like to see! █ How to use : 1. Put the script on your chart 2. Navigate to the settings 3. Select your box's time frame. give the script a few seconds and you should be set. This script is coded as an addon to the Gann ToolBox package/scripts.Pine Script®指標由NasserHumood提供已更新 66142
Study forloop Star Triangle'Study forloop' pinescript Program to print star Triangle The Program Logic For example, the following Pinescript programme will need two nested for loops. The outer forloop is for rows and the inner forloop is for columns or stars. to create a triangle shape.Pine Script®指標由hapharmonic提供已更新 2221
Gann ToolsThis is basically an updated version of my scripts with additional features, all in one instead of 3 separated scripts, The script includes the following but not limited to: 1- Price Angles (Angles of Square of 9) with the ability to add extra primary angles or whole cycles, and the customization of every line color and style and more 2- Gann Star with the customization of every line color and style and more 3- Gann Grid with the customization of every line color and style and more 4- Gann Fan/s, that can be drawn from the all 4 directions/points, with the customization of every line color and style and more 5- Gann Square (Sq of 52/90/144) with the ability to extend boxes in all directions, and of course with the customization of every line color and style The only reason that made me create 3 separated scripts, is that there was a limit of 55 line per script, and I had to draw a lot of lines, specially in the Grid, now that limit is 500 (crazy right?). You can now select the starting point with a click instead of having to type the price by yourself, input whatever color you want for every single line that will be drawn on your screen. I hope everyone enjoys using my indicator/s to plot their creativity on the chart. Pine Script®指標由KirolosT.Zakery提供已更新 1414168
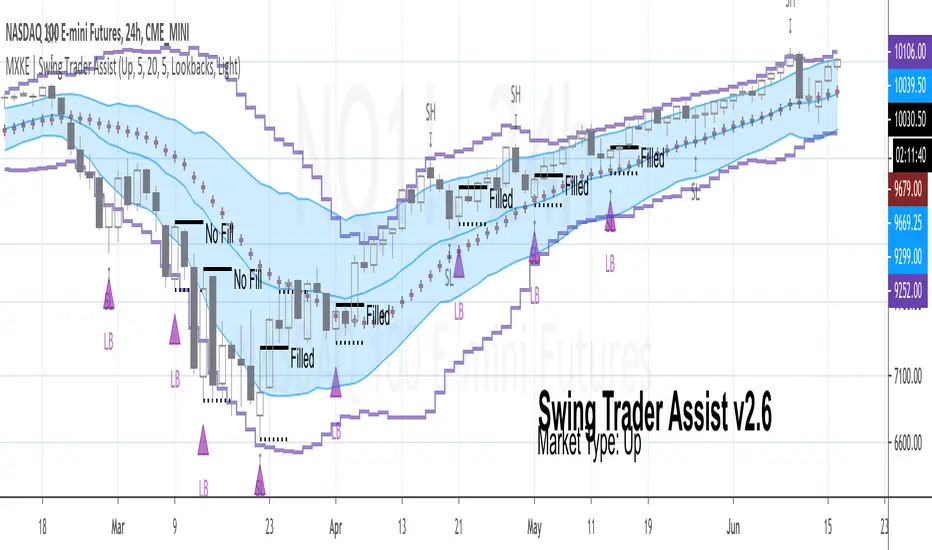
MXKE | Swing Trader AssistIntroduction Swing Trader Assist indicator is designed to assist in the systematic identification of Hammers & Lookback signals within Uptrending markets, Stars & Lookback signals within Downtrending markets, and Mean Reversion signals within Sideways markets. The trader must first identify a strong market trend, then apply the indicator. Application of the indicator to weak trends will render equally weak signals. Application of the indicator to strong trends will render equally strong signals. Identification of strong trends is the responsibility of the individual trader and is instrumental to the successful deployment of this indicator and accompanying trading plan. *Please comment below to request access* *Please share with me on Twitter your usage and/or ideas for improvement so that I may improve this indicator in the future* Market Types Uptrend: Higher highs + Higher lows Downtrend: Lower highs + Lower lows Sideways: Higher highs + Lower lows (Expanding Range) or Lower highs + Higher lows (Narrowing Range) Position Sizing 1R = .25%-2% of total nominal capital dependent upon timeframe and risk appetite Order Types Entry: Buy Stop 1 tick above High of “Up” Signal Bars; Sell Stop 1 tick below Low of “Down” Signal Bars Stop: Bar Close <= 1 tick below Low of “Up” Signal Bar; Bar Close >= 1 tick above High of “Down” Signal Bar Profit Target: 1.5R distance from “Up” or “Down” fill level with the option to trail stop on each new swing high/low; Bollinger Band Midline minimum 1.5R distance from “Sideways” fill level with option to trail stop on continuation to the opposite end of the range (opposite Bollinger Band) Trading Plan ❑ Market Type is clearly identifiable as Up, Down or Sideways ❑ Swing Trader Assist indicator is set to the corresponding Market Type: Up, Down or Sideways ❑ Position size is no more than .25%-2% of total nominal capital (based on distance from Signal Bar fill level to Signal Bar stop level as 1R) ❑ Distance from Signal Bar fill level to potential Profit Target is minimum 1.5R ❑ On Hammer or Star fill: close position into trend extension at 1.5R+ or adjust trailing stop on each new swing high/low ❑ On Mean Reversion fill: close position at midline or adjust trailing stop on each continuation to opposite end of range Usage Notes The indicator will display developing signals intrabar and it is therefore suggested to wait until bar close to act on any signals. “Autodetect” setting under “Market Type” is currently in beta mode. While it is designed to reveal only relevant signals within strong trends based on a series of EMAs, this setting has not been extensively tested. Use with caution. The indicator is not meant to be a mechanical trading system. It is designed to assist the trader in objectively and systematically identifying signal bars during the execution of the below swing trading plan. It is up to the trader to determine if overall price action warrants acting upon the signal bars or not. Case Studies Pine Script®指標由mikegyulai提供已更新 19219285
Price Angles & Gann Star By Se7s - V1 An indicator to draw :- 1-price angles given the cycle start point, cycle type ( bullish / bearish ) , spacing and shape (Circle,StrightLine,Triangle,Square,Pentagon ) shapes (Hexagon, Heptagon, Octagon, Nonagon, Decagon ) will be added later . 2-time levels . 3-Draw Price Channel . 4-Draw Gann Star . you can customize all colors and text positions. you can offset the time-levels start point . -------------------------- The script is free !! just add it to your favorite and start using it . your suggestions and feedback are very appreciated . -Shapes (Hexagon, Heptagon, Octagon, Nonagon, Decagon ) Have been Added . -Multi-time frame feature Added .Pine Script®指標由winnergamer404提供已更新 2222 1.6 K
Plotchar - How to draw external symbols on a chartHey everyone It's been a while :) but still on holidays and working on the website. I'll resume the scripts sharing shortly once I'll get back home For today, I wanted to share a very useful script that is going to make you a top of money 100% guaranteed and you'll even have a Lamborghini delivered at your place by tomorrow... (imagine some followers would believe me for this) This "script" is a proof of concept that you can draw external Unicode symbols on a chart. If you're tired with the plotshape shapes by default, you can use some others - I usually find mine there emojipedia.org What are the use cases? - Draw a dead skeleton when your stop-loss is hit - Draw a winning cup when your take profit is hit - Draw a coffin when you run out of capital FAQ Q: Does this script has any interest? A: I'm not sure myself Q: Will you make money using it? A: I'm not a financial advisor but ... very likely NO Q: Is it cool though? A: Hell yeah!! Be sure to hit the thumbs up so that I'll share real scripts the next times and not "joke scripts". I promise it's the first and last time I'm sharing such a script Dave ____________________________________________________________ - I'm an officially approved PineEditor/LUA/MT4 approved mentor on codementor. You can request a coaching with me if you want and I'll teach you how to build kick-ass indicators and strategies Jump on a 1 to 1 coaching with me - You can also hire for a custom dev of your indicator/strategy/bot/chrome extension/python Pine Script®指標由Daveatt提供33128
Gann StarA script to draw Gann Star given Cycle start point, Cycle space (or size), Cycle type (Bullish / Bearish) You can customize Time Levels color and style and the rest of lines Color and Style Telegram : @Kirolos_TPine Script®指標由KirolosT.Zakery提供已更新 4646395
Hammer & Hanging Man & Inverted Hammer & Shooting StarThis script tries to identify the candles that have Hammer & Hanging Man & Inverted Hammer & Shooting Star patternsPine Script®指標由alik472提供445
Patrick's Buy HistogramSet up a trailing stop at about 0. Look for the red dots.and that's a good point to enter a long trade.Pine Script®指標由patrickestarian提供95
Patrick's Buy/Sell HistogramSimply look for a 12 point long bar and that's a perfect time to buy the securityPine Script®指標由patrickestarian提供44195