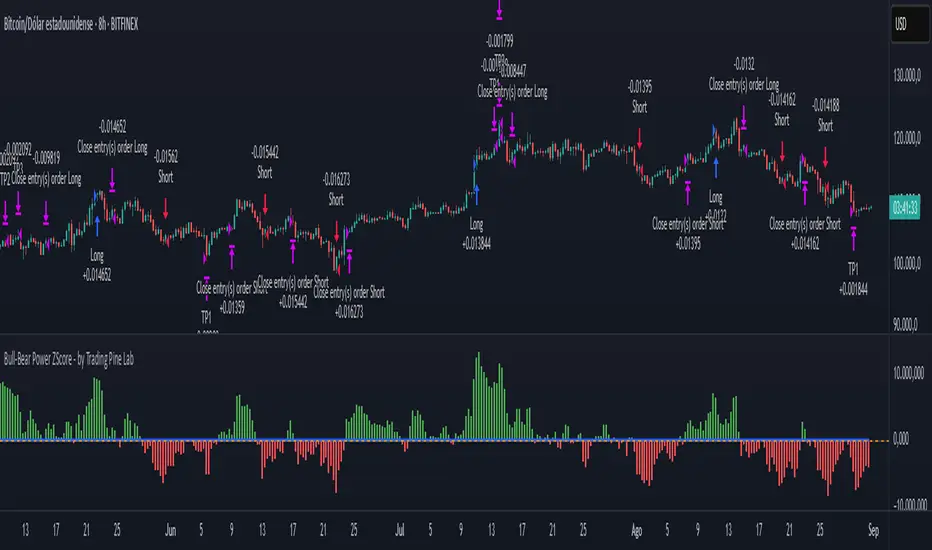
Stx Monthly Trades ProfitMonthly profit displays profits in a grid and allows you to know the gain related to the investment during each month.
The profit could be computed in terms of gain/trade_cost or as percentage of equity update.
Settings:
- Profit: Monthly profit percentage or percentage of equity
- Table position
This strategy is intended only as a container for the code and for testing the script of the profit table.
Setting of strategy allows to select the test case for this snippet (percentage grid).
Money management: not relevant as strategy is a test case.
This script stand out as take in account the gain of each trade in relation to the capital invested in each trade. For example consider the following scenario:
Capital of 1000$ and we invest a fixed amount of 1000$ (I know is too risky but is a good example), we gain 10% every month.
After 10 months our capital is of 2000$ and our strategy is perfect as we have the same performance every month.
Instead, evaluating the percentage of equity we have 10% the first month, 9.9% the second (1200$/1100$ - 1) and 5.26% the tenth month. So seems that strategy degrade with times but this is not true.
For this reason, to evaluate my strategy I prefer to see the montly return of investment.
WARNING: The strategy provided with this script is only a test case and allows to see the behavior with different "trades" management, for these reason commision are set to zero.
At the moment only the provided test cases are handled:
test 1 - single entry and single exit;
test 2 - single entry and multiple exits;
test 3 - single entry and switch position;
Statistics
Martingale + Grid DCA Strategy [YinYangAlgorithms]This Strategy focuses on strategically Martingaling when the price has dropped X% from your current Dollar Cost Average (DCA). When it does Martingale, it will create a Purchase Grid around this location to likewise attempt to get you a better DCA. Likewise following the Martingale strategy, it will sell when your Profit has hit your target of X%.
Martingale may be an effective way to lower your DCA. This is due to the fact that if your initial purchase; or in our case, initial Grid, all went through and the price kept going down afterwards, that you may purchase more to help lower your DCA even more. By doing so, you may bring your DCA down and effectively may make it easier and quicker to reach your target profit %.
Grid trading may be an effective way of reducing risk and lowering your DCA as you are spreading your purchases out over multiple different locations. Likewise we offer the ability to ‘Stack Grids’. What this means, is that if a single bar was to go through 20 grids, the purchase amount would be 20x what each grid is valued at. This may help get you a lower DCA as rather than creating 20 purchase orders at each grid location, we create a single purchase order at the lowest grid location, but for 20x the amount.
By combining both Martingale and Grid DCA techniques we attempt to lower your DCA strategically until you have reached your target profit %.
Before we start, we just want to make it known that first off, this Strategy features 8% Commission Fees, you may change this in the Settings to better reflect the Commission Fees of your exchange. On a similar note, due to Commission Fees being one of the number one profit killers in fast swing trade strategies, this strategy doesn’t focus on low trades, but the ideology of it may result in low amounts of trades. Please keep in mind this is not a bad thing. Since it has the ability to ‘Stack Grid Purchases’ it may purchase more for less and result in more profit, less commission fees, and likewise less # of trades.
Tutorial:
In this example above, we have it set so we Martingale twice, and we use 100 grids between the upper and lower level of each martingale; for a total of 200 Grids. This strategy will take total capital (initial capital + net profit) and divide it by the amount of grids. This will result in the $ amount purchased per grid. For instance, say you started with $10,000 and you’ve made $2000 from this Strategy so far, your total capital is $12,000. If you likewise are implementing 200 grids within your Strategy, this will result in $12,000 / 200 = $60 per grid. However, please note, that the further down the grid / martingale is, the more volume it is able to purchase for $60.
The white line within the Strategy represents your DCA. As the Strategy makes purchases, this will continue to get lower as will your Target Profit price (Blue Line). When the Close goes above your Target Profit price, the Strategy will close all open positions and claim the profit. This profit is then reinvested back into the Strategy, which may exponentially help the Strategy become more profitable the longer it runs for.
In the example above, we’ve zoomed in on the first example. In this we want to focus on how the Strategy got back into the trades shortly after it sold. Currently within the Settings we have it set so our entry is when the Lowest with a length of 3 is less than the previous Lowest with a length of 3. This is 100% customizable and there are multiple different entry options you can choose from and customize such as:
EMA 7 Crossover EMA 21
EMA 7 Crossunder EMA 21
RSI 14 Crossover RSI MA 14
RSI 14 Crossunder RSI MA 14
MFI 14 Crossover MFI MA 14
MFI 14 Crossunder MFI MA 14
Lowest of X Length < Previous Lowest of X Length
Highest of X Length > Previous Highest of X Length
All of these entry options may be tailored to be checked for on a different Time Frame than the one you are currently using the Strategy on. For instance, you may be running the Strategy on the 15 minute Time Frame yet decide you want the RSI to cross over the RSI MA on the 1 Day to be a valid entry location.
Please keep in mind, this Strategy focuses on DCA, this means you may not want the initial purchase to be the best location. You may want to buy when others think it is a good time to sell. This is because there may be strong bearish momentum which drives the price down drastically and potentially getting you a good DCA before it corrects back up.
We will continue to add more Entry options as time goes on, and if you have any in mind please don’t hesitate to let us know.
Now, back to the example above, if we refer to the Yellow circle, you may see that the Lowest of a length of 3 was less than its previous lowest, this triggered the martingales to create their grids. Only a few bars later, the price went into the first grid and went a little lower than its midpoint (Yellow line). This caused about 60% of the first grid to be purchased. Shortly after the price went even lower into this grid and caused the entire first martingale grid to be purchased. However, if you notice, the white line (your DCA) is lower than the midpoint of the first grid. This is due to the fact that we have ‘Stack Grid Purchases’ enabled. This allows the Strategy to purchase more when a single bar crosses through multiple grid locations; and effectively may lower your average more than if it simply executed a purchase order at each grid.
Still looking at the same location within our next example, if we simply increase the Martingale amount from 2 to 3 we can see something strange happens. What happened is our Target Profit price was reached, then our entry condition was met, which caused all of the martingale grids to be formed; however, the price continued to increase afterwards. This may not be a good thing, sure the price could correct back down to these grid locations, but what if it didn’t and it just kept increasing? This would result in this Strategy being stuck and unable to make any trades. For this reason we have implemented a Failsafe in the Settings called ‘Reset Grids if no purchase happens after X bars’.
We have enabled our Failsafe ‘Reset Grids if no purchase happens after X bars’ in this example above. By default it is set to 100 bars, but you can change this to whatever works best for you. If you set it to 0, this Failsafe will be disabled and act like the example prior where it is possible to be stuck with no trades executing.
This Failsafe may be an important way to ensure the Strategy is able to make purchases, however it may also mean the Grids increase in price when it is used, and if a massive correction were to occur afterwards, you may lose out on potential profit.
This Strategy was designed with WebHooks in mind. WebHooks allow you to send signals from the Strategy to your exchange. Simply set up a Custom TradingView Bot within the OKX exchange or 3Commas platform (which has your exchange API), enter the data required from the bot into the settings here, select your bot type in ‘Webhook Alert Type’, and then set up the alert. After that you’re good to go and this Strategy will fully automate all of its trades within your exchange for you. You need to format the Alert a certain way for it to work, which we will go over in the next example.
Add an alert for this Strategy and simply modify the alert message so all it says is:
{{strategy.order.alert_message}}
Likewise change from the Alert ‘Settings’ to Alert ‘Notifications’ at the top of the alert popup. Within the Notifications we will enable ‘Webhook URL’ and then we will pass the URL we are sending the Webhook to. In this example we’ve put OKX exchange Webhook URL, however if you are using 3Commas you’ll need to change this to theirs.
OKX Webhook URL:
www.okx.com
3Commas Webhook URL:
app.3commas.io
Make sure you click ‘Create’ to actually create this alert. After that you’re all set! There are many Tutorials videos you can watch if you are still a little confused as to how Webhook trading works.
Due to the nature of this Strategy and how it is designed to work, it has the ability to never sell unless there it will make profit. However, because of this it also may be stuck waiting in trades for quite a long period of time (usually a few months); especially when your Target Profit % is 15% like in the example above. However, this example above may be a good indication that it may maintain profitability for a long period of time; considering this ‘Deep Backtest’ is from 2017-8-17.
We will conclude the tutorial here. Hopefully you understand how this Strategy has the potential to make calculated and strategic DCA Grid purchases for you and then based on a traditional Martingale fashion, bulk sell at the desired Target Profit Percent.
Settings:
Purchase Settings:
Only Purchase if its lower than DCA: Generally speaking, we want to lower our Average, and therefore it makes sense to only buy when the close is lower than our current DCA and a Purchase Condition is met.
Purchase Condition: When creating the initial buy location you must remember, you want to Buy when others are Fearful and Sell when others are Greedy. Therefore, many of the Buy conditions involve times many would likewise Sell. This is one of the bonuses to using a Strategy like this as it will attempt to get you a good entry location at times people are selling.
Lower / Upper Change Length: This Lower / Upper Length is only used if the Purchase Condition is set to 'Lower Changed' or 'Upper Changed'. This is when the Lowest or Highest of this length changes. Lowest would become lower or Highest would become higher.
Purchase Resolution: Purchase Resolution is the Time Frame that the Purchase Condition is calculated on. For instance, you may only want to start a new Purchase Order when the RSI Crosses RSI MA on the 1 Day, but yet you run this Strategy on the 15 minutes.
Sell Settings:
Trailing Take Profit: Trailing Take Profit is where once your Target Profit Percent has been hit, this will trail up to attempt to claim even more profit.
Target Profit Percent: What is your Target Profit Percent? The Strategy will close all positions when the close price is greater than your DCA * this Target Profit Percent.
Grid Settings:
Stack Grid Purchases: If a close goes through multiple Buy Grids in one bar, should we amplify its purchase amount based on how many grids it went through?
Reset Grids if no purchase happens after X Bars: Set this to 0 if you never want to reset. This is very useful in case the price is very bullish and continues to increase after our Target Profit location is hit. What may happen is, Target Profit location is hit, then the Entry condition is met but the price just keeps increasing afterwards. We may not want to be sitting waiting for the price to drop, which may never happen. This is more of a failsafe if anything. You may set it very large, like 500+ if you only want to use it in extreme situations.
Grid % Less than Initial Purchase Price: How big should our Buy Grid be? For instance if we bought at 0.25 and this value is set to 20%, that means our Buy Grid spans from 0.2 - 0.25.
Grid Amounts: How many Grids should we create within our Buy location?
Martingale Settings:
Amount of Times 'Planned' to Martingale: The more Grids + the More Martingales = the less $ spent per grid, however the less risk. Remember it may be better to be right and take your time than risk too much and be stuck too long.
Martingale Percent: When the current price is this percent less than our DCA, lets create another Buy Grid so we can lower our average more. This will make our profit location less.
Webhook Alerts:
Webhook Alert Type: How should we format this Alert? 3Commas and OKX take their alerts differently, so please select the proper one or your webhooks won't work.
3Commas Webhook Alerts:
3Commas Bot ID: The 3Commas Bot ID is needed so we know which BOT ID we are sending this webhook too.
3Commas Email Token: The 3Commas Email Token is needed for your webhooks to work properly as it is linked to your account.
OKX Webhook Alerts:
OKX Signal Token: This Signal Token is attached to your OKX bot and will be used to access it within OKX.
If you have any questions, comments, ideas or concerns please don't hesitate to contact us.
HAPPY TRADING!
Bonsai BX (Backtester)In today's trading landscape, traders need precision and deep analytical tools to navigate the sea of strategies. The Bonsai Backtester is one such tool, meticulously designed to evaluate multiple trading strategies in an integrated manner.
═════════════════════════════════════════════════════════════════════════
🌳 Bonsai BX 🌳 Universal Strategy Testing
📘 Overview
A product of collaboration with the Bonsai community, this backtester is both a reflection of collective insights and a means to provide traders with data-driven insights on TradingView.
📌 Current Backtest
• Dataset: BTCUSD daily candles from Coinbase, starting from March 2015.
• Source Signals: The Bonsai indicator signals are employed for both long and short entries. These are directly visible on the publication chart.
• Trading Assumptions:
• Initial Capital: $1,000
• Maximum Position Size: 10% of equity per trade
• Stop Loss: 10% per position
• Commission: 0.1%
• Slippage: 100 ticks (1.00)
🛠 Key Features
The Bonsai BX is equipped with a range of features aimed at providing traders with a more comprehensive analysis environment:
Features on Chart
• External Indicator Adaptability: Easily incorporate signals from both built-in and custom TradingView indicators.
• Snapshot Table: Delivers on-the-spot insights into crucial strategy performance metrics, including equity, open profit, position size, and entry price. While these details are available in TradingView's 'Performance Summary' panel, we've integrated them directly onto the chart for a more streamlined and accessible viewing experience.
• Trade Labels: Visualize profit metrics for individual trades directly on the chart, allowing for a more immediate grasp of trade outcomes.
• Long & Short Behaviors: Modify long behaviors to either open new long positions while closing short ones, or simply to close short positions. Conversely, for short behaviors, opt to either initiate new short positions while closing any active long ones or simply close long positions.
• Multiple Signals Integration: The tool can currently handle up to three different external signals for long and short trades.
• Condition-based Initiation: Define whether longs and shorts are triggered when 'All Conditions Met' or just 'Any Single Condition Met'. This flexibility allows for a more nuanced trading approach. For example, if you're using a trade signal alongside the RSI, you can specify that a long position should only open when the trade signal is active and the RSI is below 30 at the same time. This lets you combine multiple signals or conditions for more precise trade initiation.
• TP & SL Customization:
• Single TP: Set a specific Take Profit percentage.
• SL: Define a Stop Loss percentage and choose between a standard or trailing stop.
• Trail From: Specify the starting point of the trailing stop, be it the breakeven point or a certain percentage.
• Interface Theme: Users can select between light and dark themes for their interface.
Performance and Trailing
🎛 Using Bonsai BX
1. Add it to your TradingView chart.
2. Adjust script parameters and settings. Integrate external indicator signals as needed.
3. Activate the backtester to refine trading strategies.
Backtester Settings Menu
🪝 Webhook (Beta)
The Webhook functionality, now in beta, augments the Bonsai BX utility. This feature offers a more intuitive method for users to direct webhooks to trading bots, exchanges, and brokers. It simplifies the process by eliminating the need to adjust JSON structures or other payload formats, making alert automation more accessible.
📜 Feedback & Community
The feedback from the Bonsai community has been instrumental in the tool's development and will continue to shape its evolution. As part of our commitment to adaptive, smart trading, this script will continually be updated to meet the ever-changing requirements of traders.
❗️ Disclaimer
Backtesting tools, including the Bonsai BX , simulate trading strategies based on historical data. The following key points should be kept in mind:
1. Past Performance is Not Predictive: While backtesting can offer insights, it's essential to understand that past performance does not guarantee or predict future results. Historical data might not account for future market changes or unforeseen events.
2. External Influences: Market outcomes can be significantly influenced by various external factors like geopolitical events, economic announcements, and sudden shifts in market sentiment. Such factors are often not considered in backtesting simulations.
3. Market Dynamics: Elements like market volatility, liquidity constraints, and slippage can drastically alter expected outcomes. These dynamics might not always be accurately represented in backtest simulations.
4. Limitations of Simulated Trades: Backtesting operates under the assumption that historical trends and patterns will replicate. However, market conditions evolve, and what worked in the past might not necessarily be viable in the future.
5. Informed Decisions: Always base your trading decisions on a mix of comprehensive research, current market analysis, and risk assessment. Relying solely on backtested results can lead to misconstrued perceptions and potential pitfalls.
Trading involves risks, and it's crucial to be fully informed and cautious before making any investment decisions. Always consider seeking advice from financial experts or professionals when in doubt.
MMI Auto Backtesting StrategyDescription:
A strategy based on ATR with auto-backtesting capabilities, Take Profit and Stop Loss (either Normal or Trailing). It allows you to select ranges of values and step for each parameter, and backtest the strategy on a multitude of input combinations at once. You can alternatively use a constant value for each parameter. The backtesting results strive to be as close as possible to those given by Tradingview Strategy Tester.
The strategy displays a table with results for different input combinations. This has columns showing current input combination as well as the following stats: Net Profit, Number of trades, % of Profitable trades, Profit Factor, Max Drawdown, Max Runup, Average Trade and Average number of bars in a trade.
You can sort the table by any column (including sorting by multiple columns at the same time) to find, for example, input combination that gives highest Net Profit (or, if sorting by multiple columns, to find input combination with the best balance of Net Profit and % of Profitable trades). You can filter by any column as well (or multiple columns at the same time), using logical expressions like "< value", "> value", "<= value", ">= value". And you can use logical expressions like "< value%" for Net Profit, Max Drawdown, Max Runup and Average trade to filter by percentage value. You will see a "↓" symbol in column's header if that column is sorted from Highest to Lowest, a "↑" symbol if it's sorted from Lowest to Highest and a "𐕢" symbol if that column is being filtered.
The table has customisable styles (like text color, background color of cells, etc.), and can show the total number of backtested combinations with the time taken to test them. You can also change Initial Capital and Position Size (either Contracts, Currency or % of Equity).
Parameters:
The following parameters are located in the "INPUTS (USUAL STRATEGY)" group, and control the behaviour of strategy itself (not the auto-backtesting functionality):
- Period: ATR Length
- Multiplier: ATR Multiplier
- DPO: length of the filtering moving average
- SL: stop loss
- TP: take profit
- Use Stop Loss: enable stop loss
- Stop Loss Mode: stop loss mode (either Normal or Trailing)
- Use Take Profit: enable take profit
- Wicks: use high & low price, or close price
The strategy also has various parameters separated by different groups:
- INPUTS (AUTO-BACKTESTING): has the same parameters as the "INPUTS (USUAL STRATEGY)" group, but controls the input combinations for auto-backtesting; all the numeric parameters have 3 values: F/V (from), T (to) and S (step); if the checkbox to the left of F/V parameter is off, the value of F/V will indicate the constant value used for that parameter (if the checkbox is on, the values will be from F/V to T using step S)
- STRATEGY: contains strategy related parameters like Initial Capital and Position Size
- BACKTESTING: allows you to display either Percentage, Absolute or Both values in the table and has checkboxes that allow you to exclude certain columns from the table
- SORTING: allows you to select sorting mode (Highest to Lowest or vice versa) and has checkboxes in case you want to sort by multiple columns at the same time
- FILTERING: has a text field for each column of the strategy where you can type logical expressions to filter the values
- TABLE: contains styling parameters
Many parameters have the "(i)" description marker, so hover over it to see more details.
Problems:
- The script works best on lower timeframes and continuous markets (trades 24/7), in other cases the backtesting results may vary from those that Tradingview shows
- The script shows closest results when Take Profit and Stop Loss are not used
- Max Runup percentage value is often wrong
Limitations:
- As we are limited by the maximum time a script can be running (which is 20s for Free plan and 40s for Paid plans), we can only backtest several hundreds of combinations within that timeframe (though it depends on the parameters, market and timeframe of the chart you use)
Strategy Gaussian Anomaly DerivativeConcept behind this Strategy :
Considering a normal "buy/sell" situation, an asset would be bought in average at the median price following a Gaussian like concept. A higher or lower average trend would significate that the current perceived value is respectively higher or lower than the current median price, which mean that the buyers are evaluating the price underpriced or overpriced.
This behaviour would be even more relevent depending on its derivative evolution.
Therefore, this Strategy setup is based on this Gaussian like concept anomaly of average close positionning compare to high-low average derivative, such as the derivative of the following ploted basic signal : 1-(high+low)/(2*close).
This Strategy can actually be used like a trend change and continuation strength indicator aswell.
In the Setup Signal part :
You can define the filtering of the basis signal "1-(high+low)/(2*close)" on EMA or SMA as you wish.
You can define the corresponding period and the threathold as a mutiply of the average 1/3 of all time value of the basis signal.
You can define the SMA filtering period of the Derivative signal and the corresponding threathold on the same mutiply of the average 1/3 of all time value of the derivative.
In the Setup Strategy part :
You can set up your strategy assesment based on Long and/or Short. You can also define the considered period.
The most successful tuned strategies I did were based on the derivative indicator with periods on the basis signal and the derivative under 30, can be 1 to 3 of te derivative and 7 to 21 for the basis signal. The threathold depends on the asset volatility aswell, 1 is usually the most efficient but 0 to 10 can be relevent depending on the situation I met. You can find an example of tuning for this strategy based on Kering's case hereafter.
I hoping that you will enjoy using this Strategy, don't hesitate to comment, to question, to correct or complete it ! I would be very curious about similar famous approaches that would have already been made.
Thank to you !
CC Trend strategy 2- Downtrend ShortTrend Strategy #2
Indicators:
1. EMA(s)
2. Fibonacci retracement with a mutable lookback period
Strategy:
1. Short Only
2. No preset Stop Loss/Take Profit
3. 0.01% commission
4. When in a profit and a closure above the 200ema, the position takes a profit.
5. The position is stopped When a closure over the (0.764) Fibonacci ratio occurs.
* NO IMMEDIATE RE-ENTRIES EVER!*
How to use it and what makes it unique:
This strategy will enter often and stop quickly. The goal with this strategy is to take losses often but catch the big move to the downside when it occurs through the Silvercross/Fibonacci combination. This is a unique strategy because it uses a programmed Fibonacci ratio that can be used within the strategy and on any program. You can manipulate the stats by changing the lookback period of the Fibonacci retracement and looking at different assets/timeframes.
This description tells the indicators combined to create a new strategy, with commissions and take profit/stop loss conditions included, and the process of strategy execution with a description of how to use it. If you have any questions feel free to PM me and boost if you found it helpful. Thank you, pineUSERS!
CHEATCODE1
Risk to Reward - FIXED SL BacktesterDon't know how to code? No problem! TradingView is an excellent platform for you. ✅ ✅
If you have an indicator that you want to backtest using a risk-to-reward ratio or fixed take profit/stop loss levels, then the Risk to Reward - FIXED SL Backtester script is the perfect solution for you.
introducing Risk to Reward - FIXED SL Backtester Script which will allow you to test any indicator / Signal with RR or Fixed SL system
How does it work ?!
Once you connect the script to your indicator, it will analyze your entry points and perform calculations based on them. It will then open trades for you according to the specified inputs in the script settings.
HOW TO CONNECT IT to your indicator?
simply open your indicator code and add the below line of code to it
plot(Signal ? 100 : 0,"Signal",display = display.data_window)
Replace Signal with the long condition from your own indicator. You can also modify the value 100 to any number you prefer. After that, open the settings.
Once the script is connected to your indicator, you can choose from two options:
Risk To Reward Ratio System
Fixed TP/ SL System
🔸if you select the Risk to Reward System ⤵️
The Risk-to-Reward System requires the calculation of a stop loss. That's why I have included three different types of stop-loss calculations for you to choose from:
ATR Based SL
Pivot Low SL
VWAP Based SL
Your stop loss and take profit levels will be automatically calculated based on the selected stop loss method and your risk-to-reward ratio.
You can also adjust their values to match your desired risk level. The trades will be displayed on the chart.
with the ability to change their values to match your risk.
once this is done, trades will be displayed on the chart
🔸if you select the Fixed system ⤵️
You have 2 inputs, which are FIXED TP & Fixed SL
input the values you want, and trades will be on your chart...
I have also added a Breakeven feature for you.
with this Breakeven feature the trade will not just move SL to Entry ?! NO NO, it will place it above entry by a % you input yourself, so you always win! 🚀
Here is an example
Enjoy, and have fun, if you have any questions do not hesitate to ask
Premium VWAP Trendfollow Strategy [wbburgin]This is a strongly-revised version of my VWAP Trendfollow Strategy, which follows a substantial reworking to address various structural inefficiencies with the script, such as the narrowing of the standard deviation band upon anchor reset. I will continue updating the original script with planned adjustments, this is a different proof-of-concept that builds off of the original script thesis with a different calculation method and execution.
This strategy is not built for any specific asset or timeframe, and has been backtested on crypto and equities from 1 min-1 day. The previous experimental strategy was heavily-correlated with the actual movement of the asset, which added unpalatable risk to the strategy and increased drawdown. This revised form has a more stable backtesting curve, but I want to heavily emphasize that I cannot guarantee that the strategy will be profitable for your circumstances. Backtesting only goes so far and every exchange has a different fee schedule, which can substantially eat into your profits. At the bottom I will explain the parameters behind the strategy results.
**********
The VWAP Trendfollow Strategy begins with a simple premise: to enter long when the price breaks above the upper standard deviation of a VWAP, and to close the position when the price breaks below the lower standard deviation of the VWAP. This is more effective than initiating the same strategy for a VWMA because the VWAP resets its anchor depending on your chosen anchor period, and the act of resetting its anchor also resets its standard deviation value. As a consequence, in sustained uptrends, the standard deviation is pulled upward to meet the price when the anchor resets, instead of requiring the price to fall all the way back down, as in the lower standard deviation band of the VWMA. This essentially acts as the VWAP itself raising the stop loss at each anchor period, which works well for the overall trend-following strategy.
However, this narrowing can still have consequences for a simple breakout strategy; as the price gradually oscillates towards above or below its standard deviation band, it may cross over the other and produce false signals. This oscillation is worrisome especially when fees are taken into account.
Thus, the premium VWAP Trendfollow strategy has a variable width which detects abnormal narrowing of the band, and adjusts it until it is reasonable to close the variability period. Additionally, a filter is added to the open/close signals to soften the frequency of signals without impacting performance significantly.
This script contains an ATR stop loss and an ATR take profit (which is also a difference between it and the original experimental script), with customizable inputs. The strategy results shown below are with initial capital of $1000, qty entry of 10%, and commissions of 0.06%. It works best on 24/7 instruments, like crypto, but I have found it also works with FAANG stocks or other high volatility / high volume assets. The issue with stocks, however, is that the price can jump/plummet because of abnormal events after-hours, which the strategy cannot pick up on until pre-trading begins the next morning. For that reason I suggest it be used on crypto and, because of its low % profitable (but high average winning trade in relation to its average losing trade), be used on an exchange that has minimal fees or volume-based discounts. In the unfortunate case that you cannot find a minimal fee or volume-discounted fee exchange (such as fellow Americans following the liquidity-retreat on Binance.US), I encourage you to test out the higher anchor periods for the higher timeframes, which will reduce the number of trades and increase the average % per trade.
Additionally, this is a long-term strategy used best for accumulation. It is currently long-only; that may change based off of user input.
**********
Disclaimer
Copyright by wbburgin.
The information contained in my Scripts/Indicators/Algorithms does not constitute financial advice or a solicitation to buy or sell any securities of any type. I will not accept liability for any loss or damage, including without limitation any loss of profit, which may arise directly or indirectly from the use of or reliance on such information.
All investments involve risk, and the past performance of a security, industry, sector, market, financial product, trading strategy, backtest, or individual's trading does not guarantee future results or returns. Investors are fully responsible for any investment decisions they make. Such decisions should be based solely on an evaluation of their financial circumstances, investment objectives, risk tolerance, and liquidity needs.
Buy&Sell Bullish Engulfing - The Quant Science🇺🇸
GENERAL OVERVIEW
Buy&Sell Bullish Engulfing - The Quant Science It is a Buy&Sell strategy based on the 'Bullish Engulfing' candlestick pattern. The main goal of the strategy is to achieve a consistent and sustainable return over time, with a manageable level of risk.
Bullish Engulfing
The template was developed at the top of the Indicator provided by TradingView called 'Engulfing - Bullish'.
ENTRY AND EXIT CRITERIA
Entry: A single long order is opened when the candlestick pattern is formed, and the percentage size of the order (%) is fixed by the trader through the user interface.
Exit: The long trade is closed on a percentage equity take profit-stop loss.
----------------------------------------------------------------------------------------------------------------------------------------------------------------------------------------------
🇮🇹
PANORAMICA GENERALE
Buy&Sell Bullish Engulfing - The Quant Science è una strategia Buy&Sell basata sul candlestick pattern 'Bullish Engulfing'. L'obiettivo principale della strategia è ottenere un ritorno costante e sostenibile nel tempo, con un livello gestibile di rischio.
Bullish Engulfing
Il template è stato sviluppato al top dell' Indicatore fornito da Trading View chiamato 'Engulfing - Bullish'.
CRITERI DI ENTRATA E USCITA
Entrata: viene aperto un singolo ordine long quando si forma il candlestick pattern, la size percentuale dell'ordine (%) viene selezionato tramite l'interfaccia utente dal trader.
Uscita: la chiusura della posizione avviene unicamente tramite un take profit-stop loss percentuale calcolato sul capitale.
Default Strategy Template© CN_FX-999
Coded By Christian Nataliano
First Coded In 14/06/2023
Last Edited In 22/06/2023
This Is A Default Strategy Template That Can Make Your Strategy Scripts More Organized With The Benefit Of Having The Same Layouts & Not Needing To Copy Over The Common Codes Such As Displaying Backtest Results, Opening & Closing Trades, Pine Connector Capabilities And A Clean User Input Interface. This Is A Blank Strategy Script So Feel Free To Use It As Your Default Template For Your Future Strategies.
Credits To Some Of The Custom Code In The Scripts To © ZenAndTheArtOfTrading, Especially The Table Data Plotting
The Z-score The Z-score, also known as the standard score, is a statistical measurement that describes a value's relationship to the mean of a group of values. It's measured in terms of standard deviations from the mean. If a Z-score is 0, it indicates that the data point's score is identical to the mean score. Z-scores may be positive or negative, with a positive value indicating the score is above the mean and a negative score indicating it is below the mean.
The concept of Z-score was introduced by statistician Carl Friedrich Gauss as part of his "method of the least squares," which was an important step in the development of the normal distribution and Z-score tables. It's a key concept in statistics and is used in various statistical tests.
In financial analysis, Z-scores are used to determine whether a data point is usual or unusual. You can think of it as a measure of how many standard deviations an element is from the mean. For instance, a Z-score of 1.0 would denote a value that is one standard deviation from the mean. Z-scores are also used to predict probabilities, with Z-scores having a distribution that is expected to be normal.
In trading, a Z-score is used to determine how often a trading system may produce a string of winners or losers. It can help a trader to understand whether the losses or profits they see are something that the system would most likely produce, or if it's a once in a blue moon situation. This helps traders make decisions about when to start or stop a system.
I just wanted to play a bit with the Z-score I guess.
Feel free to share your findings if you discover additional applications for this strategy or identify timeframes where it appears to perform more optimally.
How it works:
This strategy is based on a statistical concept called Z-score, which measures the number of standard deviations a data point is from the mean. In other words, it helps determine how unusual or usual a data point is.
In the context of this strategy, Z-score is applied to a 10-period EMA (Exponential Moving Average) of Heikin-Ashi candlestick close prices. The Z-score is calculated over a look-back period of 25 bars.
The EMA of the Z-score is then calculated over a 20-bar period, and the upper and lower thresholds (bounds for buy and sell signals) are defined using the 90th and 10th percentiles of this EMA score.
Long positions are taken when the Z-score crosses above the lower threshold or crosses above the mid-line (50th percentile). An additional long entry is made when the Z-score crosses above the highest value the EMA has been in the past 100 periods.
Short positions are initiated when the EMA crosses below the upper threshold, lower threshold or the highest value the EMA has been in the past 100 periods.
Positions are closed when opposing entry conditions are met, for example, a long position is closed when the short entry condition is true, and vice versa.
Set your desired start date for the strategy. This can be modified in the timestamp("YYYY MM DD") function at the top of the script.
Monthly Strategy Performance TableWhat Is This?
This script code adds a Monthly Strategy Performance Table to your Pine Script strategy scripts so you can see a month-by-month and year-by-year breakdown of your P&L as a percentage of your account balance.
The table is based on realized equity rather than open equity, so it only updates the metrics when a trade is closed.
That's why some numbers will not match the Strategy Tester metrics (such as max drawdown), as the Strategy Tester bases metrics like max drawdown on open trade equity and not realized equity (closed trades).
The script is still a work-in-progress, so make sure to read the disclaimer below. But I think it's ready to release the code for others to play around with.
How To Use It
The script code includes one of my strategies as an example strategy. You need to replace my strategy code with your own. To do that just copy the source code below into a blank script, delete lines 11 -> 60 and paste your strategy code in there instead of mine. The script should work with most systems, but make sure to read the disclaimer below.
It works best with a significant amount of historical data, so it may not work very effectively on intraday timeframes as there is a severe limitation of available bars on TradingView. I recommend using it on 4HR timeframes and above, as anything less will produce very little usable data. Having a premium TradingView plan will also help boost the number of available bars.
You can hover your mouse over a table cell to get more information in the form of tooltips (such as the Long and Short win rate if you hover over your total return cell).
Credit
The code in this script is based on open-source code originally written by QuantNomad, I've made significant changes and additions to the original script but all credit for the idea and especially the display table code goes to them - I just built on top of it:
Why Did I Make This?
None of this is trading or investment advice, just my personal opinion based on my experience as a trader and systems developer these past 6+ years:
The TradingView Strategy Tester is severely limited in some important ways. And unless you use complex Excel formulas on exported test data, you can't see a granular perspective of your system's historical performance.
There is much more to creating profitable and tradeable systems than developing a strategy with a good win rate and a good return with a reasonable drawdown.
Some additional questions we need to ask ourselves are:
What did the system's worst drawdown look like?
How long did it last?
How often do drawdowns occur, and how quickly are they typically recovered?
How often do we have a break-even or losing month or year?
What is our expected compounded annual growth rate, and how does that growth rate compare to our max drawdown?
And many more questions that are too long to list and take a lifetime of trading experience to answer.
Without answering these kinds of questions, we run the risk of developing systems that look good on paper, but when it comes to live trading, we are uncomfortable or incapable of enduring the system's granular characteristics.
This Monthly Performance Table script code is intended to help bridge some of that gap with the Strategy Tester's limited default performance data.
Disclaimer
I've done my best to ensure the numbers this code outputs are accurate, and according to my testing with my personal strategy scripts it appears to work fine. But there is always a good chance I've missed something, or that this code will not work with your particular system.
The majority of my TradingView systems are extremely simple single-target systems that operate on a closed-candle basis to minimize many of the data reliability issues with the Strategy Tester, so I was unable to do much testing with multiple targets and pyramiding etc.
I've included a Debug option in the script that will display important data and information on a label each time a trade is closed. I recommend using the Debug option to confirm that the numbers you see in the table are accurate and match what your strategy is actually doing.
Always do your own due diligence, verify all claims as best you can, and never take anyone's word for anything.
Take care, and best of luck with your trading :)
Kind regards,
Matt.
PS. If you're interested in learning how this script works, I have a free hour-long video lesson breaking down the source code - just check out the links below this script or in my profile.
Initial Balance Panel Strategy for BitcoinInitial Balance Strategy
Initial Balance Strategy uses a source code of "Initial Balance Monitoring Panel" that build from "Initial Balance Markets Time Zones - Overall Highest and Lowest".
Initial Balance is based on the highest and lowest price action within the first 60 minutes of trading. Reading online this can depict which way the market can trend for the session. More information about Initial Balance Panel you can read at the end of the article.
Strategy idea
The main idea is to catch the trend move when most of the 16 Crypto pairs break the Low or High levels together. I found good results when 15 of 16 pairs is break that levels and after we manage the trade within some trail stop indicator, I choose Volatility Stop for this strategy.
Additional Strategy idea
The second one idea that was not made is to catch the pullback after fully green/red zones in Initial Balance Panel become white. That mean the main trend can be finished and we can try to catch good pullback in opposite direction.
Binance Crypto pairs
The strategy use the 16 default Crypto currencies pairs from the Binance. As additional variations of the strategy can be changing the currencies pairs and their number.
List of default pairs:
BINANCE:BTCUSDT, BINANCE:ETHUSDT, BINANCE:EOSUSDT, BINANCE:LTCUSDT, BINANCE:XRPUSDT, BINANCE:DASHUSDT, BINANCE:IOTAUSDT, BINANCE:NEOUSDT, BINANCE:QTUMUSDT, BINANCE:XMRUSDT, BINANCE:ZECUSDT, BINANCE:ETCUSDT, BINANCE:ADAUSDT, BINANCE:XTZUSDT, BINANCE:LINKUSDT, BINANCE:DOTUSDT
Summary
The strategy works very well for a buy trades with settings 15 crypto pairs of 16 that follow the trend with breaking the long initial balance level.
Initial Balance Monitoring Panel
Allows you to have an instant view of 16 Crypto pairs within a monitoring panel, monitoring Initial Balance (Asia, London, New York Stock Exchanges).
The code can easily be changed to suit the crypto pairs you are trading.
The setup of my chart would also include this indicator and the "Initial Balance Markets Time Zones - Overall Highest and Lowest" (with all IBs enabled) as shown above.
Initial Balance is based on the highest and lowest price action within the first 60 minutes of trading. Reading online this can depict which way the market can trend for the session.
The indicator has been coded for Crypto (so other symbols may not work as expected).
Though Initial Balance is based off the first 60 minutes of the trading markets opening, but Crypto is 24/7, this indicator looks at how Asia, London and New York Stock Exchanges opening trading can affect Crypto price action.
Source: Initial Balance Monitoring Panel
Premium MTF Layered RSI - Bitcoin Bot [wbburgin]This the premium version of my MTF Layered RSI strategy, which improves significantly on the original strategy (publicly available on my profile). Improvements are below. This strategy will also appear as an overlay on your chart. It is completely non-repainting.
The MTF Layered RSI strategy uses the current timeframe and two configurable higher timeframes to enter a long position when Bitcoin is oversold on all three timeframes, and exit the long position when Bitcoin is overbought on the current timeframe. This hedges against situations where the RSI on higher timeframes never reaches the overbought level and we are left "holding the bag" so to speak with the classic "enter long at oversold and enter short at overbought" strategy.
IMPORTANT: This strategy does not work on ranges. It will work on all timeframes and assets, but does not work on ranges (Renko blocks and some other advanced types of charts).
********** My Background
I am an investor, trader, and entrepreneur with 10 years of cryptocurrency and equity trading experience and founder of two fintech startups. I am a graduate of a prestigious university in the United States and carry broad and inclusive interests in mathematical finance, computer science, machine learning / artificial intelligence, as well as other fields.
**********
Improvements over the original MTF RSI strategy include:
Filters for Uptrends and Downtrends → The Premium RSI strategy will adjust its buy and sell thresholds depending on whether the instrument is trending. This means that, in uptrends, the Premium strategy will buy more frequently, bringing in potentially greater profit, and in downtrends, the strategy will stop buying altogether. These filters and dynamic buy/sell thresholds have made this strategy more profitable in my backtesting across random timeframes, but I cannot guarantee that the strategy will be profitable for you on the default settings. To that end, I have enabled a number of different configurations that you can change in the settings of the strategy.
Stop Loss / Take Profit Calculation Per Tick → Stop loss and take profit are now both enabled in the script and each has their own alerts. You can specify what type of stop loss or take profit you want: percentage or ATR. If you have alerts configured, you will be alerted mid-bar, instead of at close. This helps prevent loss from abrupt falls in price between closing price and next bar open.
Customizable Alert Messages In-Strategy → In the settings, there will be text boxes where you can create your own alerts. All you will need to do is create an alert in the alert panel on Tradingview and leave the message box blank - if you fill out the alert boxes in the settings, these will automatically populate into your alerts. There are in total eight different customizable alerts messages: Entry, Exit, Stop loss, and Take profit alerts for both Long and Short sides. If you disable stop loss and/or take profit, these alerts will also be disabled. Similarly, if you disable shorts, all short alerts will be disabled.
**********
Display
Configuring Stop Loss or Take Profit will make their corresponding displays appear.
Separately from the trading boxes, background colors (green, red) signify extended uptrends and downtrends, respectively.
Configuring Alerts
In TradingView desktop, go to the ‘Alerts’ tab on the right panel. Click the “+” button to create a new alert. Select this strategy for the condition and one of the two options that includes alert() function calls. Name the alert what you wish and clear the default message, because your text in the settings will replace this message.
Now that the alert is configured, you can go to the settings of the strategy and fill in your chosen text for the specific alert condition. You will need to check “Long and Short” in the “Trade Direction” setting in order for any Short Alerts to become active. Similarly, you will need to check “Enable Stop Loss” for stop loss alerts to become active and “Enable Take Profit” for take profit alerts to become active.
**********
Disclaimer
Copyright by wbburgin.
The information contained in my Scripts/Indicators/Algorithms does not constitute financial advice or a solicitation to buy or sell any securities of any type. I will not accept liability for any loss or damage, including without limitation any loss of profit, which may arise directly or indirectly from the use of or reliance on such information.
All investments involve risk, and the past performance of a security, industry, sector, market, financial product, trading strategy, backtest, or individual's trading does not guarantee future results or returns. Investors are fully responsible for any investment decisions they make. Such decisions should be based solely on an evaluation of their financial circumstances, investment objectives, risk tolerance, and liquidity needs.
**********
Notes on the Strategy Performance below: This is 3% of equity per trade, with a pyramiding number of 3. I did not include fees because Binance US on Bitcoin/USD does not charge fees on the instrument; however, I heavily encourage you to include fees in your backtesting if you use a different brokerage. To mitigate fees, this strategy is designed with a high average %/trade. If your current fees are greater than the strategy's average %/trade, I encourage you to choose a higher RSI period, such as 14 or 28, which will result in less trades but potentially a higher %/trade.
Index Strength Strategy with Signal Using the Index Strength Strategy Indicator for Trading
Introduction:
In this article, we'll explore the Index Strength Strategy Indicator and how it can be used for trading. The Index Strength Strategy Indicator is a technical analysis tool designed to help traders identify trends, determine trend strength, and generate buy and sell signals.
Overview of the Index Strength Strategy Indicator:
The Index Strength Strategy Indicator is based on two moving averages - a fast moving average and a slow moving average - and the Relative Strength Index (RSI). The fast and slow moving averages are used to determine the trend direction, while the RSI is used to calculate the trend strength. The indicator assigns a strength score to the current trend, which is then classified into one of four categories - Very Weak, Weak, Strong, or Very Strong. Traders can use this information to identify the strength of the trend and adjust their trading strategy accordingly.
The indicator also generates buy and sell signals based on a user-defined threshold level. When the strength score crosses above the threshold level, a buy signal is generated, and when the strength score crosses below the threshold level, a sell signal is generated.
Using the Index Strength Strategy Indicator for Trading:
Traders can use the Index Strength Strategy Indicator to identify trends, determine trend strength, and generate buy and sell signals. To use the indicator, traders should first determine the appropriate fast and slow moving average periods and the strength threshold level for their trading style. These input parameters can be adjusted in the indicator's settings.
Once the indicator is added to the chart, traders can use the strength score and trend direction to identify potential trading opportunities. If the trend is classified as Strong or Very Strong, traders may look for opportunities to enter long or short positions in the direction of the trend. If the trend is classified as Very Weak or Weak, traders may look for opportunities to exit or avoid positions.
Traders can also use the buy and sell signals generated by the indicator to enter or exit positions. When a buy signal is generated, traders can enter a long position, and when a sell signal is generated, traders can enter a short position. Traders should set stop-loss and take-profit levels based on their risk management strategy.
Avoiding Mistakes:
To avoid mistakes when using the Index Strength Strategy Indicator, traders should keep the following tips in mind:
Don't rely solely on the indicator - it should be used in conjunction with other technical analysis tools and fundamental analysis.
Use appropriate risk management strategies, including setting stop-loss and take-profit levels.
Adjust the input parameters of the indicator to match your trading style and preferences.
Avoid overtrading and chasing trades - wait for the right opportunities to enter or exit positions.
Trading Strategy Test Results: Time Frame Tested for 15 Mins
To provide an idea of the potential performance of the Index Strength Strategy Indicator, let's look at some recent test results for two popular indices - Bank Nifty and Nifty 50.
From 1-May-2023 to 12-May-2023, using 2 lots of Bank Nifty with the Index Strength Strategy Indicator, a profit of 15,175 was achieved, with a percentage profitable trade rate of 80% and a profit factor of 3.395. The maximum drawdown was 7,000, and the average trade was 3,035.
During the same time period, using 1 lot of Nifty 50 with the Index Strength Strategy Indicator, a profit of 8,187 was achieved
Conclusion:
The Index Strength Strategy Indicator is a useful tool for traders to identify trends, determine trend strength, and generate buy and sell signals. Traders can use the indicator in conjunction with other technical analysis tools and fundamental analysis to make informed trading decisions. By following proper risk management strategies and avoiding common mistakes, traders can use the indicator to improve their trading performance.
Grid Spot Trading Algorithm V2 - The Quant ScienceGrid Spot Trading Algorithm V2 is the last grid trading algorithm made by our developer team.
Grid Spot Trading Algorithm V2 is a fixed 10-level grid trading algorithm. The grid is divided into an accumulation area (red) and a selling area (green).
In the accumulation area, the algorithm will place new buy orders, selling the long positions on the top of the grid.
BUYING AND SELLING LOGIC
The algorithm places up to 5 limit orders on the accumulation section of the grid, each time the price cross through the middle grid. Each single order uses 20% of the equity.
Positions are closed at the top of the grid by default, with the algorithm closing all orders at the first sell level. The exit level can be adjusted using the user interface, from the first level up to the fifth level above.
CONFIGURING THE ALGORITHM
1) Add it to the chart: Add the script to the current chart that you want to analyze.
2) Select the top of the grid: Confirm a price level with the mouse on which to fix the top of the grid.
3) Select the bottom of the grid: Confirm a price level with the mouse on which to fix the bottom of the grid.
4) Wait for the automatic creation of the grid.
USING THE ALGORITHM
Once the grid configuration process is completed, the algorithm will generate automatic backtesting.
You can add a stop loss that destroys the grid by setting the destruction price and activating the feature from the user interface. When the stop loss is activated, you can view it on the chart.
Statistical Arbitrage Right LegStatistical Arbitrage, this is the right leg strategy signal.
You should find "Statistical Arbitrage Left Leg (Symbol 1)" this strategy for the opposite leg (Left Leg),
In order to full hedge the position exposure risk, and profit on the spread convergence.
Statistical arbitrage is a quantitative trading strategy that seeks to exploit pricing discrepancies in financial markets based on statistical models and analysis. It involves using mathematical models and statistical techniques to identify and take advantage of mispricings between related financial assets.
In statistical arbitrage, traders use sophisticated algorithms to identify pairs or groups of financial assets that are expected to move in tandem based on historical correlations. They then look for deviations from these historical patterns in order to generate profitable trades. For example, a trader might identify a pair of stocks that have historically moved together, but are currently priced such that one is significantly cheaper than the other. The trader would then buy the cheaper stock and simultaneously sell the more expensive one, hoping to profit when the prices converge.
Statistical arbitrage is a popular trading strategy among hedge funds and other institutional investors, who have access to large amounts of data and the computational resources necessary to analyze it. However, it requires significant expertise in statistics, mathematics, and programming, as well as access to advanced analytical tools and data sources.
Statistical Arbitrage Left LegStatistical Arbitrage, this is the left leg strategy signal.
You should find "Statistical Arbitrage Right Leg (Symbol 1)" this strategy for the opposite leg (Right Leg),
In order to full hedge the position exposure risk, and profit on the spread convergence.
Statistical arbitrage is a quantitative trading strategy that seeks to exploit pricing discrepancies in financial markets based on statistical models and analysis. It involves using mathematical models and statistical techniques to identify and take advantage of mispricings between related financial assets.
In statistical arbitrage, traders use sophisticated algorithms to identify pairs or groups of financial assets that are expected to move in tandem based on historical correlations. They then look for deviations from these historical patterns in order to generate profitable trades. For example, a trader might identify a pair of stocks that have historically moved together, but are currently priced such that one is significantly cheaper than the other. The trader would then buy the cheaper stock and simultaneously sell the more expensive one, hoping to profit when the prices converge.
Statistical arbitrage is a popular trading strategy among hedge funds and other institutional investors, who have access to large amounts of data and the computational resources necessary to analyze it. However, it requires significant expertise in statistics, mathematics, and programming, as well as access to advanced analytical tools and data sources.
Strategy DesignerHello traders.
Thanks to the tool I have published, everyone who knows or does not know coding will be able to create strategies and see the results instantly on the screen. Yes it looks very nice :)
What does this script do?
Thanks to this tool, even if you don't know any coding, you will be able to create your own strategies. You can add and remove indicators.
Entrance
The first thing you need to do is to set a strategy in your mind.
Then you need to adjust the settings of the indicators installed in the system. Please set the indicators first, because later they are forgotten.
The screen for entering the parameters of the indicators will be as follows.
After entering the parameters there is an important part . In this section, we can adjust the strategy settings.
First we choose between which dates we want the strategy to run. We then choose whether we want the strategy results to be displayed in a table or not.
We choose how the Terms should be linked together. For example, if you have a condition that is expected to produce more than one receive signal, select whether these conditions are connected to each other with and or with the connector.
In this way, you can determine whether all or any of the rules in your strategy should apply.
Next, we choose whether our strategy will work in the spot market or in a bidirectional market. Yes, you can design a strategy for both spot and bidirectional trades :)
At the bottom of the above image, we see a screen where we can adjust the stop level and tp level. As a standard, adjustments are made according to the percentage level you enter. However, if you remove the tick next to the percent sign, the previous stop level and the next profit level are determined as much as the value you entered.
At the bottom is the trailing stop. When you open the trailing stop, the trailing stop becomes active in your strategy.
Very important, when the trailing stop and the stop are active at the same time, the trailing stop value is valid.
It's time to design our strategy. Each chapter that begins with an exclamation point is a separate fiction.
If you do not mark the Active button, that condition will not be included in the calculation.
Direction = It is the direction for which the fiction in this region is valid.
We came to the indicator setting screen. Here, there is a screen where we can select two different indicators on the right and left.
We choose the first indicator starting with 1.
Then we choose from the middle region how we want these two indicators to interact.
We choose our second indicator from the place starting with 2.
If you want an indicator to interact with any value, tick the box where it says Value and fill in the value in the blank. When Value is ticked, the second indicator does not work.
Lorentzian Classification Strategy Based in the model of Machine learning: Lorentzian Classification by @jdehorty, you will be able to get into trending moves and get interesting entries in the market with this strategy. I also put some new features for better backtesting results!
Backtesting context: 2022-07-19 to 2023-04-14 of US500 1H by PEPPERSTONE. Commissions: 0.03% for each entry, 0.03% for each exit. Risk per trade: 2.5% of the total account
For this strategy, 3 indicators are used:
Machine learning: Lorentzian Classification by @jdehorty
One Ema of 200 periods for identifying the trend
Supertrend indicator as a filter for some exits
Atr stop loss from Gatherio
Trade conditions:
For longs:
Close price is above 200 Ema
Lorentzian Classification indicates a buying signal
This gives us our long signal. Stop loss will be determined by atr stop loss (white point), break even(blue point) by a risk/reward ratio of 1:1 and take profit of 3:1 where half position will be closed. This will be showed as buy.
The other half will be closed when the model indicates a selling signal or Supertrend indicator gives a bearish signal. This will be showed as cl buy.
For shorts:
Close price is under 200 Ema
Lorentzian Classification indicates a selling signal
This gives us our short signal. Stop loss will be determined by atr stop loss (white point), break even(blue point) by a risk/reward ratio of 1:1 and take profit of 3:1 where half position will be closed. This will be showed as sell.
The other half will be closed when the model indicates a buying signal or Supertrend indicator gives a bullish signal. This will be showed as cl sell.
Risk management
To calculate the amount of the position you will use just a small percent of your initial capital for the strategy and you will use the atr stop loss or last swing for this.
Example: You have 1000 usd and you just want to risk 2,5% of your account, there is a buy signal at price of 4,000 usd. The stop loss price from atr stop loss or last swing is 3,900. You calculate the distance in percent between 4,000 and 3,900. In this case, that distance would be of 2.50%. Then, you calculate your position by this way: (initial or current capital * risk per trade of your account) / (stop loss distance).
Using these values on the formula: (1000*2,5%)/(2,5%) = 1000usd. It means, you have to use 1000 usd for risking 2.5% of your account.
We will use this risk management for applying compound interest.
> In settings, with position amount calculator, you can enter the amount in usd of your account and the amount in percentage for risking per trade of the account. You will see this value in green color in the upper left corner that shows the amount in usd to use for risking the specific percentage of your account.
> You can also choose a fixed amount, so you will have to activate fixed amount in risk management for trades and set the fixed amount for backtesting.
Script functions
Inside of settings, you will find some utilities for display atr stop loss, break evens, positions, signals, indicators, a table of some stats from backtesting, etc.
You will find the settings for risk management at the end of the script if you want to change something or trying new values for other assets for backtesting.
If you want to change the initial capital for backtest the strategy, go to properties, and also enter the commisions of your exchange and slippage for more realistic results.
In risk managment you can find an option called "Use leverage ?", activate this if you want to backtest using leverage, which means that in case of not having enough money for risking the % determined by you of your account using your initial capital, you will use leverage for using the enough amount for risking that % of your acount in a buy position. Otherwise, the amount will be limited by your initial/current capital
I also added a function for backtesting if you had added or withdrawn money frequently:
Adding money: You can choose how often you want to add money (Monthly, yearly, daily or weekly). Then a fixed amount of money and activate or deactivate this function
Withdraw money: You can choose if you want to withdraw a fixed amount or a percentage of earnings. Then you can choose a fixed amount of money, the period of time and activate or deactivate this function. Also, the percentage of earnings if you choosed this option.
Some other assets where strategy has worked
BTCUSD 4H, 1D
ETHUSD 4H, 1D
BNBUSD 4H
SPX 1D
BANKNIFTY 4H, 15 min
Some things to consider
USE UNDER YOUR OWN RISK. PAST RESULTS DO NOT REPRESENT THE FUTURE.
DEPENDING OF % ACCOUNT RISK PER TRADE, YOU COULD REQUIRE LEVERAGE FOR OPEN SOME POSITIONS, SO PLEASE, BE CAREFULL AND USE CORRECTLY THE RISK MANAGEMENT
Do not forget to change commissions and other parameters related with back testing results!. If you have problems loading the script reduce max bars back number in general settings
Strategies for trending markets use to have more looses than wins and it takes a long time to get profits, so do not forget to be patient and consistent !
Please, visit the post from @jdehorty called Machine Learning: Lorentzian Classification for a better understanding of his script!
Any support and boosts will be well received. If you have any question, do not doubt to ask!
[pAulseperformance] PSStrategyX█ OVERVIEW
This script reduces the amount of time it takes to turn your indicator into a live trading bot.
It will convert your signals into alerts that will be sent to your exchange for trading.
The script features a broker connector to automate alert syntax and connect with third-party exchanges to live trade strategies with minimal setup.
It also includes an enhanced version of the built-in backtester with customizable options to speed up backtesting, trade-by-trade statistics, and a chart strategy summary to help traders make informed decisions.
The PSStrategyX trading tool is designed to provide traders with a range of benefits, including:
Increased confidence in their strategies.
Better understanding of the accuracy of indicator signals.
Simplified automated trading through third-party broker connections.
Reduced time to develop strategies by focusing on signal development only. No need to work with complicated strategy testing code and 3rd party automation.
█ FEATURES
Broker Connector
— Supports Autoview (More Connectors added in the future)
— Connects and auto trades with most exchanges
— No need for Webhooks (AutoView)
— Can forward test live strategies on Testnets before using real money.
Built in Backtester loaded with options to speed up backtesting
— Standard strategy features including stop loss, take profit, and various filters reduce the time and complexity involved in building a working strategy.
Trade By Trade Statistics
— Gain insight on every trade with additional trade-by-trade statistics.
Strategy Summary
— Get instant feedback on your chart of your strategies performance. Visual cues and feedback give you hints on where to look and what to improve.
Strategy Tester Enhancements
— Take the max trades allowed in the strategy tester without errors.
— Take the largest or smallest trade allowed without errors.
█ WHY?
The PSStrategyX tool was developed to solve a common problem faced by traders who use Pine Script on TradingView: the inability to integrate Pine Script with exchanges through TradingView.
Without this integration, traders need to go through several extra steps to live trade their Pine Script strategies on a real exchange with real money. This includes finding a broker, learning the new syntax for the broker, and placing that syntax correctly in the strategy.
These steps can be time-consuming and add complexity to the codebase.
The PSStrategyX tool simplifies this process by automatically configuring the correct alert syntax to connect to third-party exchanges, allowing traders to live trade their strategies with minimal setup. This saves traders time and effort, allowing them to focus on signal development rather than complicated strategy testing code and 3rd party automation.
Additionally, the tool was developed to address the time-consuming task of converting any one of the thousands of great free indicators on TradingView to strategies through hours of coding.
Overall, I built the PSStrategyX to streamline the auto trading process and make auto trading more accessible to traders of all levels.
█ HOW TO USE THIS?
Using the PSStrategyX trading tool is a straightforward process that requires a few key steps:
1 — Generate trading signals: You need a signal generator that can provide buy and sell signals for your preferred trading instrument(s).
You can use TradingView's indicators or create your own custom indicators using TradingView's Pine programming language.
2 — Connect trading signals to PSStrategyX: You will use 2 scripts on your chart. One generates buy/sell/exit signals, and the other is the PSStrategyX script executing those signals as trades.
To set this up you will need to make sure that your signal generator is an indicator, NOT a strategy.
Make sure the signals are being plotted buy = 1; sell = -1; exit = 0; signals in one plot. Exits are optional.
Example plot(buy ? 1 : sell ? -1 : exit ? 0 : na)
You will choose the plot with buy/sell/exit signals inside the PSStrategyX tool to execute trades. If you need help, check out the docs for more details.
3 — Set up the broker connector (optional): If you want to take live trades with this tool, you will need to set up a third party connecter. Once set up, everything is automated. See more details in the "authors instructions." at the bottom of this post.
4 — Set up an exchange account (optional): If you want to trade on an exchange, you will need to set up an account with the exchange you plan to use.
The Broker Connector supports a range of popular exchanges, including Binance, Bitfinex, Kraken, Oanda and more.
Once you have generated your trading signals, set up the Broker connecter (optional) and set up an exchange account (optional), you can start using the PSStrategyX trading tool to execute trades automatically based on your trading signals.
█ LIMITATIONS
Here are some important limitations to keep in mind when using the PSStrategyX trading tool:
General:
— Once the alert is sent, there is no way to monitor positions on any exchange. The order will be processed by the broker connector and sent to the exchange.
While this usually works fine, it's important to check the log for errors.
Sometimes the broker connector may fail to process the order, or the exchange may not process it for various reasons.
— The tool sends TP/SL orders with the entry order when possible to protect your order in case of errors or if you lose a connection.
However, not all exchanges accept TP/SL orders, and sometimes your entry order will be left unprotected.
FIFO:
— This tool DOES NOT support the First In First Out (FIFO) method for closing positions.
— Instead, it uses the ANY method. There currently is no way to make this variable.
█ FAQ
What does PSStrategyX do exactly?
PSStrategyX is a strategy enhancing, backtester, forwardtester, automation and simulation tool. It's NOT a signal generator, and does not produce buy/sell signals by itself. You provide buy/sell signals, and PSStrategyX will put those signals on steroids...basically.
PSStrategyX helps you figure out what indicators actually work. Without wasting time learning how to code.
Why did you choose AutoView for this tool?
AutoView offered the best integration I could find. They allow you to connect to test exchanges for free, which is great for practicing without using real money. They also work without using webhooks, which means you can live trade without paying for Tradingview pro. Additionally, AutoView supports many different exchanges. I don't work for AutoView, but if you sign up through my referral link and purchase a paid version, I earn a commission.
Why doesn't Tradingview automatically connect Pine Script to exchanges?
This is a great question, but unfortunately I don't have the answer. It would definitely be helpful if Tradingview provided this feature, but it might also put some brokers out of business.
How do I get access?
DON'T ask for access in the comments.
DO review the "Authors Instructions" on this page for details.
*Backtesting System ⚉ OVERVIEW ⚉
One of the best Systems for Backtesting your Strategies.
Incredibly flexible, simple, fast and feature-rich system — will solve most of your queries without much effort.
Many systems for setting StopLoss, TakeProfit, Risk Management and advanced Filters.
All you need to do is plug in your indicator and start Backtesting .
I intentionally left the option to use my System on Full Power before you load your indicator into it.
The system uses the built-in simple and popular moving average crossover signal for this purpose. (EMA 50 & 200).
Also Highly Recommend that you Fully use ALL of the features of this system so that you understand how they work before you ask questions.
Also tried to leave TIPS for each feature everywhere, read Tips, activate them and see how they work.
But before you use this system, I Recommend you to read the following description in Full.
—————— How to connect your indicator in 2 steps:
Adapt your indicator by adding only 2 lines of code and then connect it to this Backtesting System.
Step 1 — Create your connector, For doing so:
• 1 — Find or create in your indicator where are the conditions printing the Long-Buy and Short-Sell signals.
• 2 — Create an additional plot as below
I'm giving an example with a Two moving averages cross.
Please replicate the same methodology for your indicator wether it's a MACD, RSI , Pivots, or whatever indicator with Clear Buy and Sell conditions.
//@version=5
indicator('Moving Average Cross', overlay = true)
MA200 = ta.𝚎𝚖𝚊(close, 200)
MA50 = ta.𝚎𝚖𝚊(close, 50)
// Generate Buy and Sell conditions
buy = ta.crossover (MA200, MA50)
sell = ta.crossunder (MA200, MA50)
plot(MA200, color=color.green)
plot(MA50 , color=color.red )
bgcolor(color = buy ? color.green : sell ? color.red : na, title='SIGNALS')
// ———————————————— SIGNAL FOR SYSTEM ————————————————
Signal = buy ? +1 : sell ? -1 : 0
plot(Signal, title='🔌Connector🔌', display = display.none)
// —————— 🔥 The Backtesting System expects the value to be exactly +1 for the 𝚋𝚞𝚕𝚕𝚒𝚜𝚑 signal, and -1 for the 𝚋𝚎𝚊𝚛𝚒𝚜𝚑 signal
Basically, I identified my Buy & Sell conditions in the code and added this at the bottom of my indicator code
Now you can connect your indicator to the Backtesting System using the Step 2
Step 2 — Connect the connector
• 1 — Add your updated indicator to a TradingView chart and Add the Backtesting System as well to the SAME chart
• 2 — Open the Backtesting System settings and in the External Source field select your 🔌Connector🔌 (which comes from your indicator)
_______________________________
⚉ MAIN SETTINGS ⚉
‾‾‾‾‾‾‾‾‾‾‾‾‾‾‾‾‾‾‾‾‾‾‾‾‾‾‾‾‾‾‾
𝐄𝐱𝐭𝐞𝐫𝐧𝐚𝐥 𝐒𝐨𝐮𝐫𝐜𝐞 — Select your indicator. Add your indicator by following the 2 steps described above and select it in the menu. To familiarize yourself with the system until you select your indicator, you will have an in-built strategy of crossing the two moving EMA's of 50 and 200.
Long Deals — Enable/Disable Long Deals.
Short Deals — Enable/Disable Short Deals.
Wait End Deal — Enable/Disable waiting for a trade to close at Stop Loss/Take Profit. Until the trade closes on the Stop Loss or Take Profit, no new trade will open.
Reverse Deals — To force the opening of a trade in the opposite direction.
ReEntry Deal — Automatically open the same new deal after the deal is closed.
ReOpen Deal — Reopen the trade if the same signal is received. For example, if you are already in the long and a new signal is received in the long, the trade will reopen. * Does not work if Wait End Deal is enabled.
𝐓𝐚𝐤𝐞 𝐏𝐫𝐨𝐟𝐢𝐭:
None — Disables take profit. Useful if you only want to use dynamic stoplosses such as MA, Fast-Trailing, ATR Trail.
FIXED % — Fixed take profit in percent.
FIXED $ — Fixed Take in Money.
ATR — Fixed Take based on ATR.
R:R — Fixed Take based on the size of your stop loss. For example, if your stop is 10% and R:R=1, then the Take would be 10%. R:R=3 Take would be 30%, etc.
HH / LL — Fixed Take based on the previous maximum/minimum (extremum).
𝐒𝐭𝐨𝐩 𝐋𝐨𝐬𝐬:
None — Disables Stop Loss. Useful if you want to work without a stop loss. *Be careful if Wait End Deal is enabled, the trade may not close for a long time until it reaches the Take.
FIXED % — Fixed Stop in percent.
FIXED $ — Fixed Stop in Money.
TRAILING — Dynamic Trailing Stop like on the stock exchanges.
FAST TRAIL — Dynamic Fast Trailing Stop moves immediately in profit and stays in place if the price stands still or the price moves in loss.
ATR — Fixed Stop based on the ATR.
ATR TRAIL — Dynamic Trailing Stop based on the ATR.
LO / HI — A Fixed Stop based on the last Maximum/Minimum extemum. Allows you to place a stop just behind or above the low/high candle.
MA — Dynamic Stop based on selected Moving Average. * You will have 8 types of MA (EMA, SMA, HMA, etc.) to choose from, but you can easily add dozens of other MAs, which makes this type of stop incredibly flexible.
Add % — If true, then with the "𝗦𝘁𝗼𝗽 %" parameter you can add percentages to any of the current SL. Can be especially useful when using Stop - 𝗔𝗧𝗥 or 𝗠𝗔 or 𝗟𝗢/𝗛𝗜. For example with 𝗟𝗢/𝗛𝗜 to put a stop for the last High/Low and add 0.5% additional Stoploss.
Fixed R:R — If the stop loss is Dynamic (Trailing or MA) then if R:R true can also be made Dynamic * Use it carefully, the function is experimental.
_________________________________________
⚉ TAKE PROFIT LEVELS ⚉
‾‾‾‾‾‾‾‾‾‾‾‾‾‾‾‾‾‾‾‾‾‾‾‾‾‾‾‾‾‾‾‾‾‾‾‾‾‾‾‾‾
A unique method of constructing intermediate Take Profit Levels will allow you to select up to 5 intermediate Take Profit Levels and one intermediate Stop Loss.
Intermediate Take Profit Levels are perfectly calculated into 5 equal parts in the form of levels from the entry point to the final Take Profit target.
All you need to do is to choose the necessary levels for fixing and how much you want to fix at each level as a percentage. For example, TP 3 will always be exactly between the entry point and the Take Profit target. And the value of TP 3 = 50 will close 50% of the amount of the remaining size of the position.
Note: all intermediate SL/TP are closed from the remaining position amount and not from the initial position size, as TV does by default.
SL 0 Position — works in the same way as TP 1-5 but it's Stop. With this parameter you can set the position where the intermediate stop will be set.
Breakeven on TP — When activated, it allows you to put the stop loss at Breakeven after the selected TP is reached. For this function to work as it should - you need to activate an intermediate Take. For example, if TP 3 is activated and Breakeven on TP = 3, then after the price reaches this level, the Stop loss will go to Breakeven.
* This function will not work with Dynamic Stoplosses, because it simply does not make sense.
CoolDown # Bars — When activated, allows you to add a delay before a new trade is opened. A new trade after CoolDown will not be opened until # bars pass and a new signal appears.
_____________________________
⚉ TIME FILTERS ⚉
‾‾‾‾‾‾‾‾‾‾‾‾‾‾‾‾‾‾‾‾‾‾‾‾‾‾‾‾‾
Powerful time filter code that allows you to filter data based on specific time zones, dates, and session days. This code is ideal for those who need to analyze data from different time zones and weed out irrelevant data.
With Time Filter, you can easily set the starting and ending time zones by which you want to filter the data.
You can also set a start and end date for your data and choose which days of the week to include in the analysis. In addition, you can specify start and end times for a specific session, allowing you to focus your analysis on specific time periods.
_________________________________
⚉ SIGNAL FILTERS ⚉
‾‾‾‾‾‾‾‾‾‾‾‾‾‾‾‾‾‾‾‾‾‾‾‾‾‾‾‾‾‾‾‾‾
Signal Filters — allows you to easily customize and optimize your trading strategies based on 10 filters.
Each filter is designed to help you weed out inaccurate signals to minimize your risks.
Let's take a look at their features:
__________________________________
⚉ RISK MANAGEMENT ⚉
‾‾‾‾‾‾‾‾‾‾‾‾‾‾‾‾‾‾‾‾‾‾‾‾‾‾‾‾‾‾‾‾‾‾
Risk management tools that allow you to set the maximum number of losing trades in a row, a limit on the number of trades per day or week and other filters.
Loss Streak — Set Max number of consecutive loss trades.
Win Streak — Max Winning Streak Length.
Row Loss InDay — Max of consecutive days with a loss in a row.
DrawDown % — Max DrawDown (in % of strategy equity).
InDay Loss % — Set Max Intraday Loss.
Daily Trades — Limit the number of MAX trades per day.
Weekly Trades — Limit the number of MAX trades per week.
* 🡅 I would Not Recommend using these functions without understanding how they work.
Order Size — Position Size
• NONE — Use the default position size settings in Tab "Properties".
• EQUITY — The amount of the allowed position as a percentage of the initial capital.
• Use Net Profit — On/Off the use of profit in the following trades. *Only works if the type is EQUITY.
• SIZE — The size of the allowed position in monetary terms.
• Contracts — The size of the allowed position in the contracts. 1 Сontract = Сurrent price.
________________
⚉ NOTES ⚉
‾‾‾‾‾‾‾‾‾‾‾‾‾‾‾‾
It is important to note that I have never worked with Backtesting and the functions associated with them before.
It took me about a month of slow work to build this system.
I want to say Big Thanks:
• The PineScripters🌲 group, the guys suggested how to implement some features. Especially @allanster
• Thanks to all those people who share their developments for free on TV and not only.
• I also thank myself for not giving up and finishing the project, and not trying to monetize the system by selling it. * Although I really want the money :)
I tried hard to make it as fast and convenient as possible for everyone who will use my code.
That's why I didn't use any libraries and dozens of heavy functions, and I managed to fit in 8+-functions for the whole code.
Absolutely every block of code I tried to make full-fledged modular, that it was easy to import/edit for myself (you).
I have abused the Ternary Pine operator a little (a lot) so that the code was as compact as possible.
Nevertheless, I tried very hard to keep my code very understandable even for beginners.
At last I managed to write 500 lines of code, making it one of the fastest and most feature-rich systems out there.
I hope everyone enjoys my work.
Put comments and write likes.
MVRV Z Score and MVRV Free Float Z-ScoreIMPORTANT: This script needs as much historic data as possible. Please run it on INDEX:BTCUSD , BNC:BLX or another chart of sufficient length.
MVRV
The MVRV (Market Value to Realised Value Ratio) simply divides bitcoins market cap by bitcoins realized market cap. This was previously impossible on Tradingview but has now been made possible thanks to Coinmetrics providing us with the realized market cap data.
In the free float version, the free float market cap is used instead of the regular market cap.
Z-Score
The MVRV Z-score divides the difference between Market cap and realized market cap by the historic standard deviation of the market cap.
Historically, this has been insanely accurate at detecting bitcoin tops and bottoms:
A Z-Score above 7 means bitcoin is vastly overpriced and at a local top.
A Z-Score below 0.1 means bitcoin is underpriced and at a local bottom.
In the free float version, the free float market cap is used instead of the regular market cap.
The Z-Score, also known as the standard score is hugely popular in a wide range of mathematical and statistical fields and is usually used to measure the number of standard deviations by which the value of a raw score is above or below the mean value of what is being observed or measured.
Credits
MVRV Z Score initially created by aweandwonder
MVRV initially created by Murad Mahmudov and David Puell