Step Generalized Moving Average [BackQuant]Step Generalized Moving Average
Overview
Step Generalized Moving Average (StepGMA) is a trend-structure moving average designed to solve two common problems with classic MAs:
They overreact to noise in chop, causing constant micro-flips.
They lag too much when you smooth them enough to stop that noise.
StepGMA tackles this by combining two layers:
A Generalized Moving Average (GMA) that increases responsiveness without simply shortening length.
A Step Filter that converts the MA into discrete “steps” sized by ATR, suppressing insignificant movement and only updating when the move is meaningful.
The output is a trend line that behaves more like market structure: it holds its level through noise, then “reprices” in chunks when volatility-adjusted movement is large enough.
What the indicator is trying to represent
Instead of showing every tiny MA wiggle, StepGMA tries to represent the idea that:
Most price movement is noise relative to volatility.
Trend only matters when it advances by a meaningful amount.
A good trend line should stay stable until the market forces it to move.
That makes this indicator useful as:
A regime filter (trend vs chop).
A trend-following bias line.
A structure-like dynamic S/R reference.
A signal generator with fewer low-quality flips.
Component 1: Moving Average engine (selectable)
The base smoothing is not fixed. You can choose between multiple MA types:
SMA, EMA, WMA, VWMA: classic smoothing families.
DEMA, TEMA: reduced-lag EMA variants.
T3: smooth yet responsive, good for trend.
HMA: very low lag, can be twitchy without filtering.
ALMA: center-weighted smoothing, often “cleaner” visually.
KAMA: adaptive smoothing based on efficiency ratio, good in mixed regimes.
LSMA: regression-based, tends to track trend direction well.
McGinley: dynamic smoothing designed to reduce lag during fast moves.
This matters because the StepGMA is not “one MA.” It is a framework that lets you pick the underlying smoothing behavior, then applies the generalization and step logic on top.
Component 2: Generalized Moving Average (GMA)
Where the idea comes from
Generalized MA here is essentially a form of two-stage smoothing compensation . A common trick in signal processing and technical analysis is:
Apply a smoother once (MA1).
Apply it again (MA2).
Use MA2 as a “lag reference,” then combine MA1 and MA2 to reduce lag while keeping smoothness.
This is related in spirit to reduced-lag filters (like DEMA/TEMA) and “zero-lag” style constructions that subtract part of the lag component. You are not magically removing lag, you are biasing the output toward the first-pass MA while subtracting some of the second-pass smoothing that represents delayed response.
How this script does it
It computes:
ma1 = MA(src, len)
ma2 = MA(ma1, len)
Then combines them using a volume factor (vf):
generalized = ma1 * (1 + vf) - ma2 * vf
Interpretation:
ma2 is a “more delayed” version of ma1.
Subtracting vf * ma2 and adding (1+vf) * ma1 pushes the output toward responsiveness.
vf controls how aggressive that push is.
Volume Factor (vf) is really an aggressiveness knob
The script clamps vf between 0.01 and 1.0 to keep it stable. Conceptually:
Low vf: behaves closer to a normal MA1, smoother, more lag.
High vf: more compensation, faster response, more risk of overshoot or noise sensitivity (which is then handled by the step filter).
So the GMA stage tries to give you a cleaner, faster trend estimate without just shrinking the MA period.
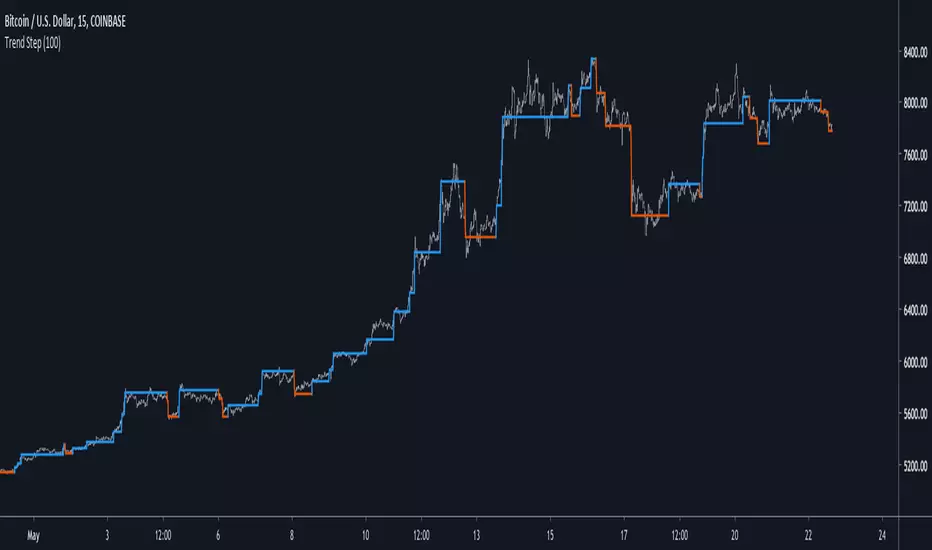
Component 3: Step Filter (the key behavior)
What a step filter is
A step filter turns a continuous signal (here, the generalized MA) into a discrete “staircase” signal. Instead of updating every bar, it updates only when the input has moved far enough to justify a new step.
This is conceptually similar to:
A quantizer in signal processing (rounding changes to discrete increments).
A volatility threshold filter (ignore changes smaller than X).
Market structure logic where levels matter more than micro movement.
How it works in this script
The filter maintains a persistent value: stepped .
Each bar:
diff = src - stepped
If |diff| < stepSize, do nothing (hold the level).
If |diff| >= stepSize, move stepped by a number of step increments.
The step increment size is:
stepSize = (stepMult / 100) * ATR(atrPeriod)
This is critical:
In higher volatility, ATR is larger, so steps are larger, fewer updates, more stability.
In lower volatility, ATR is smaller, so steps are smaller, more updates, more sensitivity.
So the step behavior automatically adapts to volatility.
Multiple-step catching behavior
If price jumps far beyond one step, the script does not move only one step. It moves by:
floor(|diff| / stepSize) * stepSize
So it “catches up” in discrete blocks, preserving the stepped character without lagging massively after large moves.
Direction and regime
Direction is determined by the stepped line, not the raw MA:
direction = +1 if steppedMA is rising
direction = -1 if steppedMA is falling
otherwise direction stays the same
Signals only trigger on direction state changes:
Long when direction flips to +1
Short when direction flips to -1
This matters because it prevents repeated signals while the trend remains intact. You only get a signal when the market has moved enough (in ATR terms) to justify a structural step in the opposite direction.
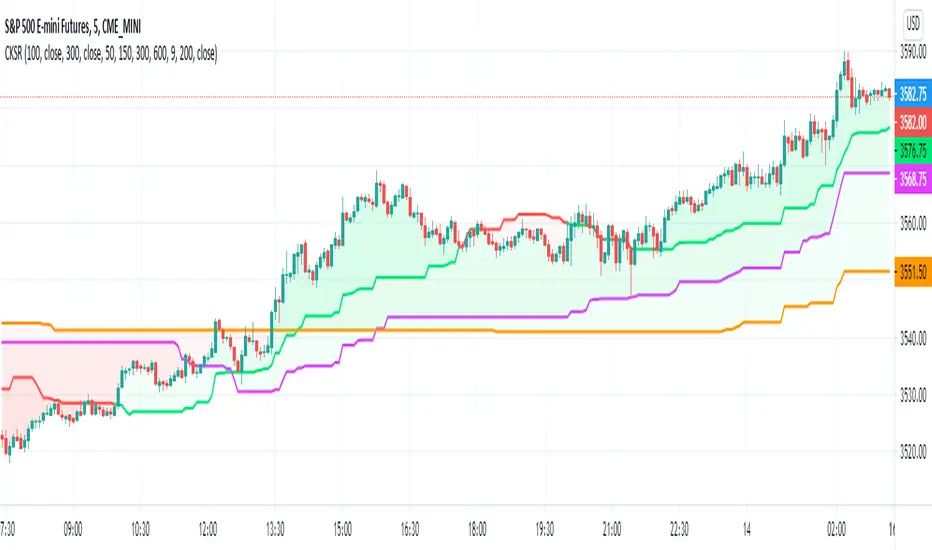
Secondary line and gradient fill
The script also plots a secondary “slow MA” (length 25, same MA type). This is not the core logic, it is a visual context layer:
StepGMA is the structure line (discrete, regime-driven).
Slow MA is a smoother reference for the underlying drift.
The gradient fill highlights separation and dominance.
When StepGMA sits above the slow MA, the fill reinforces bullish bias. When below, it reinforces bearish bias. It is basically a “trend pressure” visual, not a separate signal.
How to interpret it
1) StepGMA as trend structure
Flat steps mean price is not making enough volatility-adjusted progress to move structure.
Up-steps mean the market has advanced enough to reprice the trend line upward.
Down-steps mean deterioration significant enough to reprice structure downward.
2) Direction is a regime, not a tick-by-tick call
Because direction is derived from step changes, it is naturally a regime filter:
Fewer flips in chop.
Clearer regime transitions.
Signals tend to occur later than ultra-fast tools, but with better confirmation quality.
3) Step size controls noise rejection
StepMult is the main “anti-chop” control:
Higher stepMult = bigger ATR steps = fewer updates, fewer signals, more confirmation, slower to react.
Lower stepMult = smaller steps = more updates, more signals, more sensitivity, more chop risk.
4) Generalization controls responsiveness of the underlying trend estimate
vf controls how “fast” the MA tries to be before stepping:
Higher vf makes the MA respond faster to new price information.
Lower vf makes the MA smoother and more conservative.
The step filter then decides whether that change is meaningful enough to matter.
Practical use cases
Trend filter for entries
Only take longs when direction is bullish.
Only take shorts when direction is bearish.
Avoid trades when StepGMA is flat for long periods, market is not repricing meaningfully.
Dynamic support and resistance
Because the line holds levels, it often behaves like structure:
In uptrends it can act as a rising support reference.
In downtrends it can act as falling resistance.
Signal quality layer
The step-based flip signals tend to be higher quality than basic MA crossovers because they require:
A meaningful volatility-adjusted move.
A confirmed direction change in the stepped trend structure.
Trade management
Use StepGMA as a trailing invalidation reference.
Use direction flips as “hard” regime exits.
Use separation vs slow MA as a “pressure” gauge for scaling decisions.
Tuning guidelines
MA Type
Pick based on the character you want:
T3, ALMA, KAMA are usually good defaults for clean trend representation.
HMA/LSMA are faster but may need larger stepMult to avoid twitch.
SMA is slow and stable but can be too laggy unless vf is increased.
MA Period
Sets the base smoothing horizon. Longer periods give “macro trend,” shorter periods give “tactical trend.”
Volume Factor (vf)
Sets responsiveness compensation:
0.05–0.25 is usually sensible.
Higher than that can get aggressive, step filter will save you, but your steps may fire more often.
ATR Period and StepMult
These define your structure sensitivity:
ATR Period controls how stable the volatility estimate is.
StepMult controls how large a move must be to change structure.
If you want fewer flips, increase StepMult or ATR Period. If you want quicker reaction, lower StepMult or ATR Period.
What this indicator is and is not
It is:
A trend structure MA that ignores sub-threshold noise.
A regime tool that uses volatility-adjusted repricing logic.
A configurable framework that works across assets and timeframes.
It is not:
A predictive reversal tool.
A scalping signal machine.
A replacement for risk management.
Summary
Step Generalized Moving Average combines a lag-compensated moving average (generalization via MA1/MA2 blending) with a volatility-scaled step filter (ATR-based quantization). The result is a stable, structure-like trend line that updates only when price movement is meaningful relative to volatility, producing cleaner regimes, fewer chop flips, and clearer trend bias than conventional moving averages.
Pine Script®指標