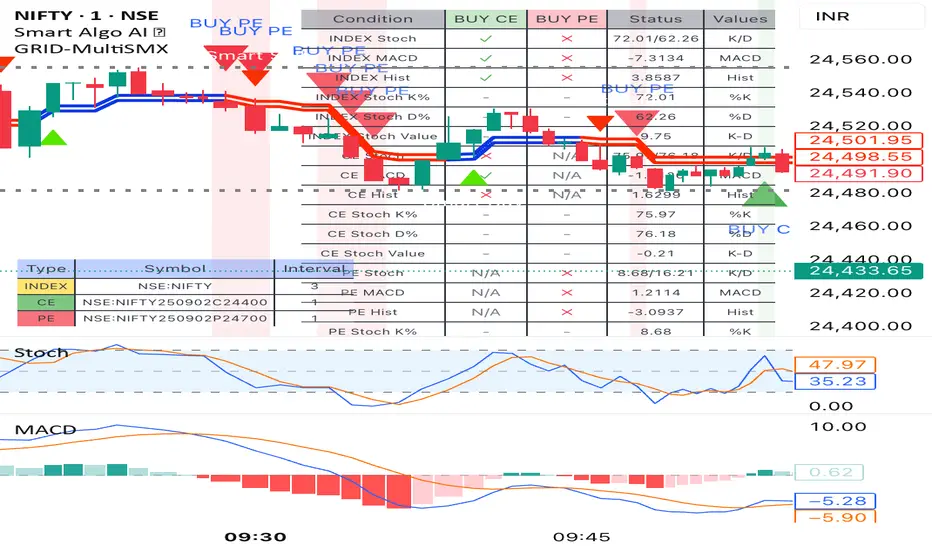
Multi-Symbol Options Trading IndicatorSymbol Configuration: User can input three different symbols (INDEX, CE, PE) with individual timeframes
Customizable Settings: Fully editable MACD and Stochastic parameters
Signal Generation:
BUY CE: When INDEX shows bullish signals AND CE option shows bullish signals
BUY PE: When INDEX shows bearish signals AND PE option shows bullish signals
Signal Conditions:
BUY CE Signal (all must be true):
INDEX: Stochastic %K > %D
INDEX: MACD line > Signal line
INDEX: Histogram shows bullish trend over specified bars
CE: Stochastic %K > %D
CE: MACD line > Signal line
CE: Histogram shows bullish trend over specified bars
BUY PE Signal (all must be true):
INDEX: Stochastic %K < %D
INDEX: MACD line < Signal line
INDEX: Histogram shows bearish trend over specified bars
PE: Stochastic %K > %D
PE: MACD line > Signal line
PE: Histogram shows bullish trend over specified bars
Visual Elements:
Green triangle up with "BUY CE" text when CE signal triggers
Red triangle down with "BUY PE" text when PE signal triggers
Background coloring on signal candles
Conditions table showing real-time status of all conditions
Alerts for both signal types
Usage Instructions:
Add the indicator to your chart
Configure your three symbols (INDEX, CE option, PE option)
Set timeframes for each symbol
Adjust MACD and Stochastic parameters as needed
Set the number of histogram bars for trend analysis
Enable/disable the conditions table and choose its position
The table will show you exactly which conditions are met (✓) or not met (✗) for both signal types, making it easy to monitor the setup in real-time.
Stocastic
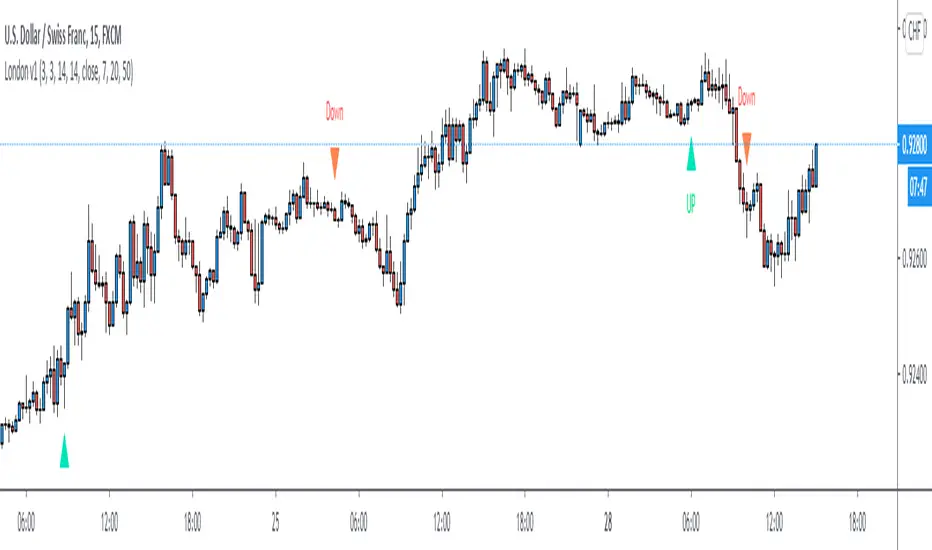
Mayfair Reversal Change✅ Mayfair Reversal Change — By EastWave Capital
Description:
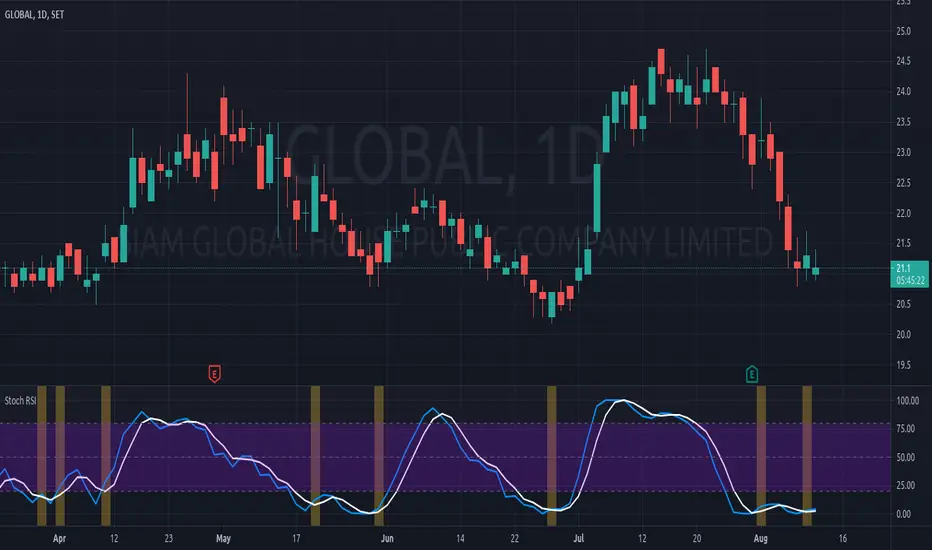
The Mayfair Reversal Change indicator is a tool designed to help traders identify potential market turning points using Stochastic Oscillator behavior and filtered price action logic. It acts as a reversal signal filter and is particularly effective when the market is overextended (overbought/oversold) and about to revert from exhaustion zones.
🔍 How It Works:
This script monitors the Stochastic %K and %D crossovers and adds a custom logic layer to filter only high-quality reversal points:
Stochastic Filter Conditions:
Uses smoothed stochastic settings:
%K smoothing = 3
%D smoothing = 3
Only shows signals after %K crosses back below 80 (for Sell) or above 20 (for Buy)
This prevents signals from appearing too early during an active overbought or oversold phase.
Directional Confirmation Logic:
Bullish signal is printed only when %K re-enters below 20 after a confirmed stochastic crossover.
Bearish signal appears only when %K re-enters above 80.
This reduces false signals that occur during continued trending moves.
Toggle Switch:
A user-toggle input is included to enable or disable the reversal filter logic.
This gives flexibility for traders who want to test signals with or without the stochastic condition.
📈 How to Use:
Timeframes: Recommended for 5M, 15M, and 30M
Markets: Compatible with any market — FX, Gold, Indices, Crypto
Entry Approach:
Wait for signal after price has reached a potential extreme area.
Confirm with chart structure, support/resistance, or SMC zone.
Enter on confirmation, placing stop loss beyond the swing high/low.
Combine with trendline breaks or price imbalances (FVG) for extra confluence.
Can be used in combination with the Mayfair FX Scalper script for dual-layer confirmation.
⚠️ Important Notes:
Signals are visual only and should be confirmed with proper strategy.
This indicator does not execute or manage trades automatically.
Designed to assist with reversal setups but should not be used in isolation.
Always manage risk, use SL/TP, and avoid over-leveraging.

Dual Stochastic Enhanced (with Presets giua64)Script Title: Dual Stochastic Enhanced (with Presets giua64)
Overview:
This indicator enhances the traditional Dual Stochastic strategy, aiming to provide more filtered and potentially reliable trading signals. By integrating dynamic overbought/oversold levels via Bollinger Bands on the slow stochastic, a trend filter based on a moving average, momentum confirmation via RSI, and user-friendly selectable presets, "Dual Stochastic Enhanced" seeks to offer a more robust approach to identifying potential entry points.
Key Features:
Dual Stochastics: Utilizes a slow stochastic (configurable, e.g., 14 periods) as a context filter and a fast stochastic (configurable, e.g., 5 periods) as a signal trigger.
Bollinger Bands on Slow Stochastic: Instead of fixed overbought/oversold levels (80/20), Bollinger Bands are applied to the %K line of the slow stochastic. This creates dynamic zones that adapt to the stochastic's own volatility.
Trend Filter: A moving average (configurable type and length, e.g., EMA 100 as seen in the example chart for general context) on the price helps filter signals, allowing only trades aligned with the prevailing trend.
RSI Confirmation: An RSI oscillator (configurable length, e.g., 14 periods) is used to confirm momentum. Signals require the RSI to cross certain thresholds to validate the strength of the move.
User Presets: Includes presets for "Scalping," "Intraday," and "Swing trading," which quickly set all key parameters to suit different styles and timeframes. A "Custom" option is also available for full manual configuration.
Clear Visual Signals: Long (green) and Short (red) arrows appear on the chart when all entry conditions are met.
Active Zone Highlighting: The background of the indicator panel changes color (green or red) when "active zone" conditions (a combination of stochastics, trend, and RSI) are favorable.
Information Panel: A table in the top-right corner of the indicator panel displays the current status of the selected preset, trend filter, RSI value, and stochastic levels.
Signal Logic:
A LONG signal is generated when:
The fast stochastic %K crosses above its %D line.
The slow stochastic %K line is below its lower Bollinger Band (dynamic oversold condition).
The fast stochastic %K line is also in a low area (e.g., <25) to confirm the trigger is not premature.
The closing price is above the trend moving average (uptrend).
The RSI is above its long confirmation level (e.g., >40), indicating sufficient bullish momentum.
A SHORT signal is generated when:
The fast stochastic %K crosses below its %D line.
The slow stochastic %K line is above its upper Bollinger Band (dynamic overbought condition).
The fast stochastic %K line is also in a high area (e.g., >75).
The closing price is below the trend moving average (downtrend).
The RSI is below its short confirmation level (e.g., <60), indicating sufficient bearish momentum.
How to Use:
Select a Preset suitable for your trading style and the timeframe you are analyzing (e.g., Scalping for M1-M15, Intraday for M5-H1, Swing for H4-D1).
Alternatively, choose "Custom" and manually adjust all parameters (stochastic lengths, smoothing, Bollinger Bands, Moving Average, RSI, confirmation thresholds).
Observe the Information Panel for a quick understanding of the current conditions.
Evaluate the arrow signals, always considering the broader market context, price action, and any other confluences (supports/resistances, chart patterns).
The background highlighting can help quickly identify periods where conditions are aligned for potential trades.
Disclaimer:
This script is provided for educational and informational purposes only. Trading involves significant risk, and past performance is not indicative of future results. Always thoroughly test any strategy or indicator on historical data and on a demo account before risking real capital. The author assumes no responsibility for any losses incurred from the use of this script.
Author: giua64

Stocashi + CaffeineCrush Momentum Indicator by CoffeeShopCryptoThis is just a fun script to give a different representation to the ever popular Stochastic RSI
Even for me over the years the stochastic has been a difficult one to use in trading merely because of its choppy look.
Since Heikin-Ashi Candles do such a powerful job in smoothing out the look of choppy markets,
I decided to test it out on the look of the Stochastic RSI.
From an initial visual standpoint it worked out WAY better than I thought but it seemed to need something more.
I decided to use the PineScript "Color.From_Gradient" feature to give the Stochastic a more 3 dimensional look, which really brought the "old-school" indicator to life.
Description:
The CaffeineCrush Momentum Indicator is your ultimate trading companion, blending the invigorating world of coffee with the excitement of market momentum. Just like a finely brewed cup of joe,
This indicator provides you with a powerful insight into market dynamics, helping you stay in the trading groove.
As you sip on this caffeinated delight, CaffeineCrush monitors the velocity and strength of price movements,
measuring the momentum of the market. But here's where it gets even more enticing – it goes a step further by incorporating a pressure indication, adding a stimulating twist to your trading experience.
Imagine yourself in a bustling coffee shop, surrounded by the aroma of freshly roasted beans and the energetic buzz of conversations.
CaffeineCrush mimics that atmosphere, keeping you on your toes, always aware of market forces at play.
With CaffeineCrush, you'll never miss a beat. It identifies and highlights moments of heightened momentum and increased pressure,
giving you an edge in capturing profitable opportunities. Just like a perfectly extracted espresso shot, this indicator helps you maintain your trading momentum and navigate the market with confidence.
So, grab your favorite cup of joe, fire up your trading charts, and let CaffeineCrush awaken your trading prowess.
Stay in the groove, embrace the buzz, and master the momentum with this flavorful indicator by your side.
Divergence -
Regular Divergence shows when there is a conflict between the strength of the trend and the swing of the price movement.
Hidden Divergence -
Are to be traded using the same methods as hidden divergences of the MACD or the RSI. A hidden divergence is commonly a trend CONTINUATION move.
Pink Pause -
This shows a ranging area where price is taking a pause. It can be a single candle or a string of candles. But histogram with continue with its RED / GREEN colors once the pause is over.
Stocashi + CaffeineCrush is not an entry / exit indicator. It's designed to help you understand:
1. Weather your trend is continuing
2. When it pauses
3. Has your pullback started / ended
Its best used near area of conflict. For example:
1. If you have a breakout to the low side of support zone, and you get a BULLISH divergence, this can be viewed as a false breakout.
2. If you trading towards the opposite area of a range or key level and you get conflicting movement in the Stocashi + CaffeineCrush, then you should take ur profits and wait for the next move.
3. If you are following through with example 2 above, but get NO conflicts, you can immediately look for a secondary take profit area and split / hedge your take profits.

JCipher Stochastic RSI Crossover AlertsCustom indicator to plot the stochastic RSI and print a highlighting bar to indicate when the fast signal curve crosses the slower one from underneath (crossover), to indicate a bullish trend change.
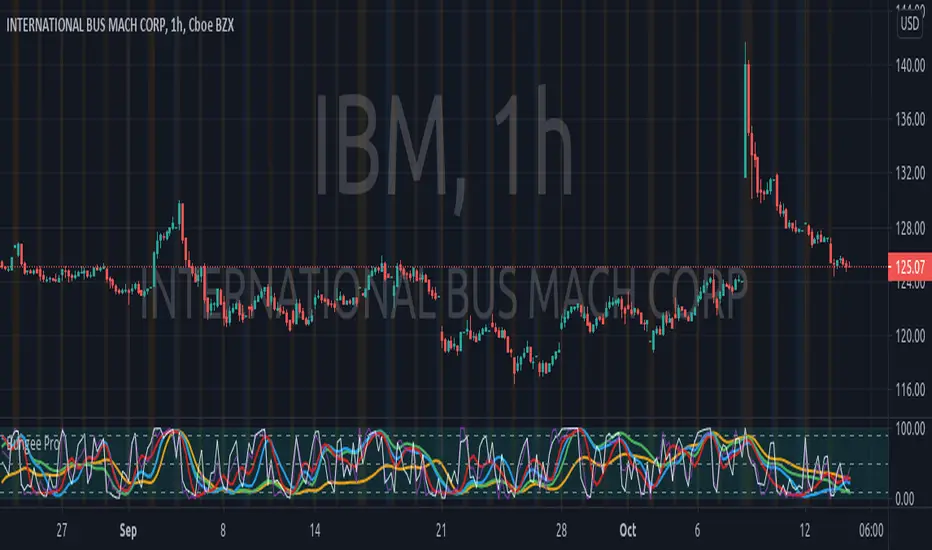
Bungee Pro OscillatorThe Bungee lines have different strength levels, where the weakest ones move faster with the price and the strongest ones move slower.
The yellow and green lines move from the bottom to the top of the channel while the price moves from the start thru the finish of a trend.
The colors and values of the Bungee Pro can be customized , also the background color.
Note: In the original setup by default the RSI line is white, ideal for dark backgrounds. If you are using white background you can change the default settings to adjust the color and thickness of the RSI line.
Ninja Heiken Ashi Flip on PSARThis indicator demonstrates Heiken Ashi Candles (HA) and PSAR settings that have flipped in sequence.
It will show a BUY/SELL signal for the First Flat Bottom/Top HK candle that has flipped on the PSAR.
It will show a BUY 20 Alert for the First Flat BOTTOM HA Candle that has flipped on the PSAR + When the stochastic is AT or BELOW the 20 marker.
It will show a SELL 80 Alert for the First Flat TOP HA Candle that has flipped on the PSAR + When the stochastic is AT or ABOVE the 80 marker.
It is designed to provide a visual demonstration that selected indicators have met certain criteria and is NOT meant to be a trading system or offer trading advice. The indicator offers alert possibilities when the above criteria are met.
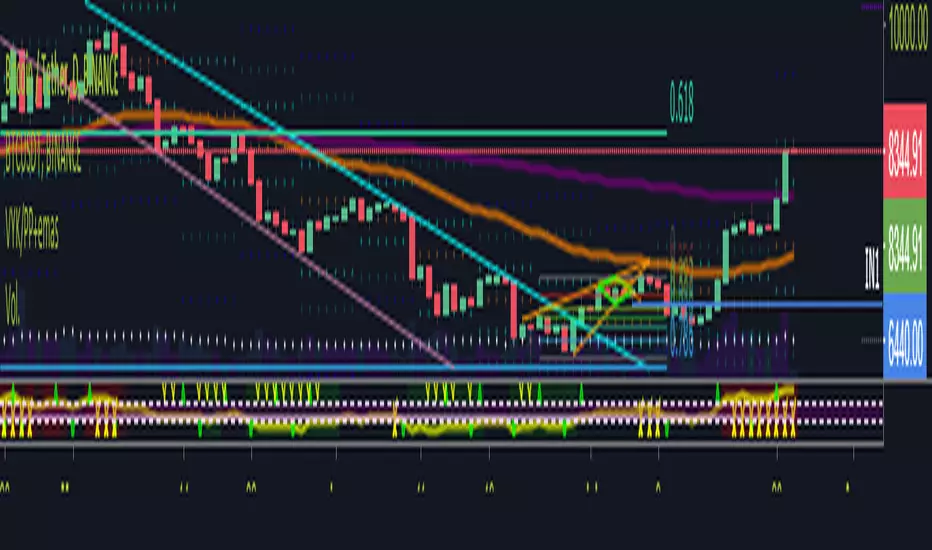
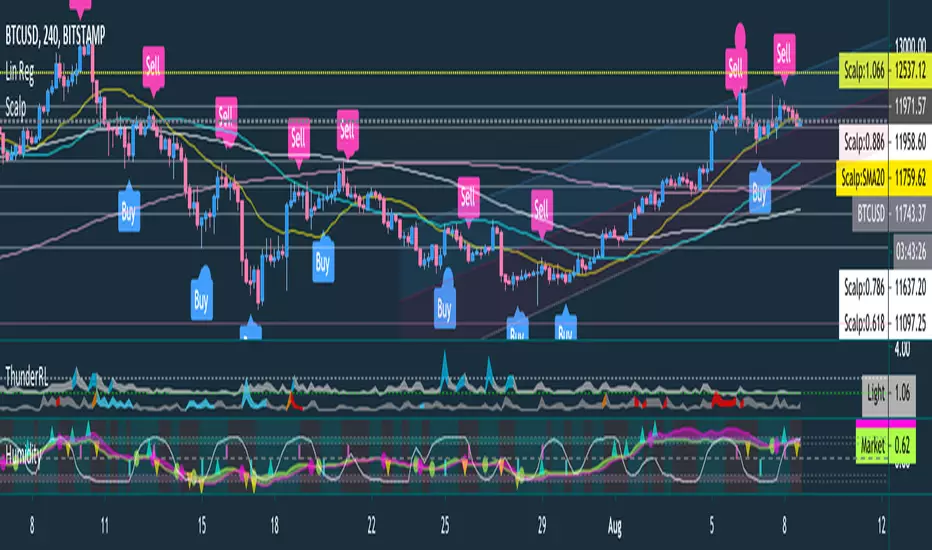
Buy and Sell scanner by ThunderTraderHumidity contains indicators:
Stocashtic RSI : is provided as background color, where the green is uptrend and the orange is downtrend
Buy/Sell Pole : the red line from top is signal for sell and green line from bottom is signal for buy
Humidity Ribbon : is price trend ribbon, if the ribbon touch or cross-down the bottom area (the red zone), means accumulation is started and best area to buy, but when ribbon touch cross up the top area (blue zone), means the uptrend is very strong. Ribbon cross down from top area can be used as breakout to sell and also ribbon cross up from bottom area can be used as breakout to buy.
Market Wave : is market circulation where 1 top and 1 bottom are equal to 1 circulation, if 1 circulation is ended then it will be best position to buy or if line touches the bottom, it can be used to buy and vice versa
RSI/Stocastic VykorowskyRsi and stochastic in one indicaroe, it shpw oversold/overbought areas and indicates with a triangle when sto cruces up or down. Also there's a tick when sto in oversold and an X when overbought.