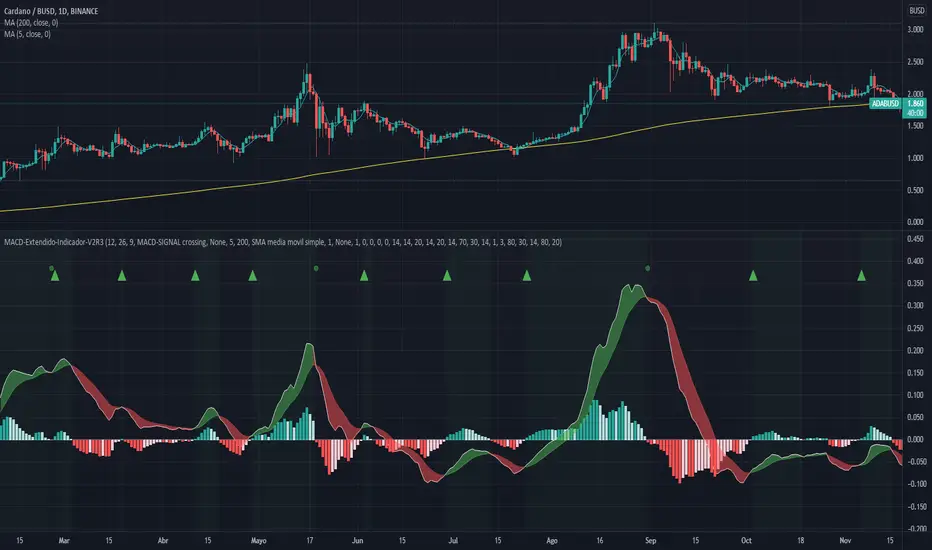
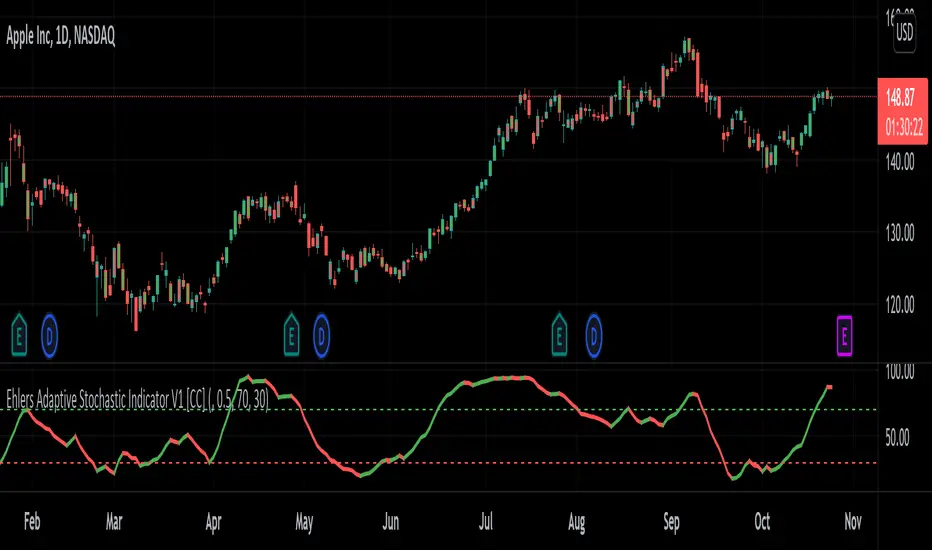
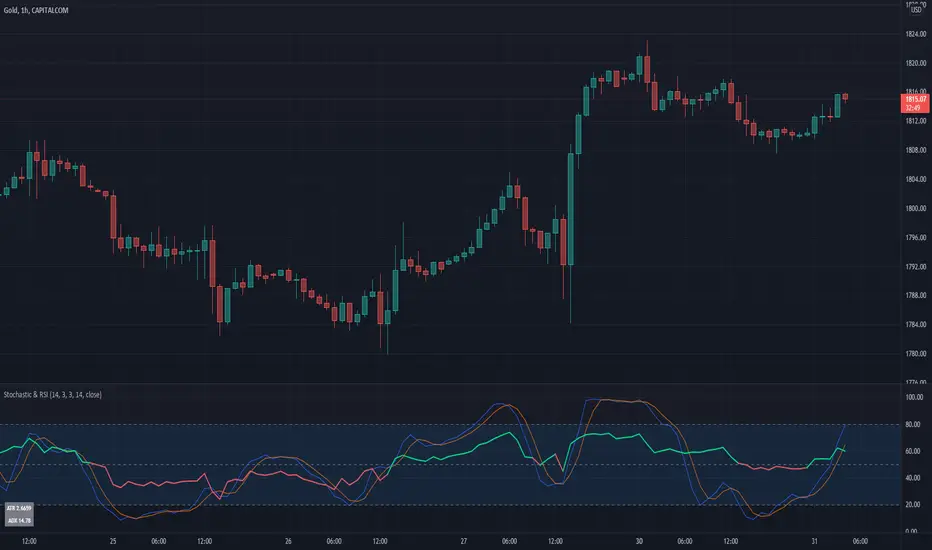
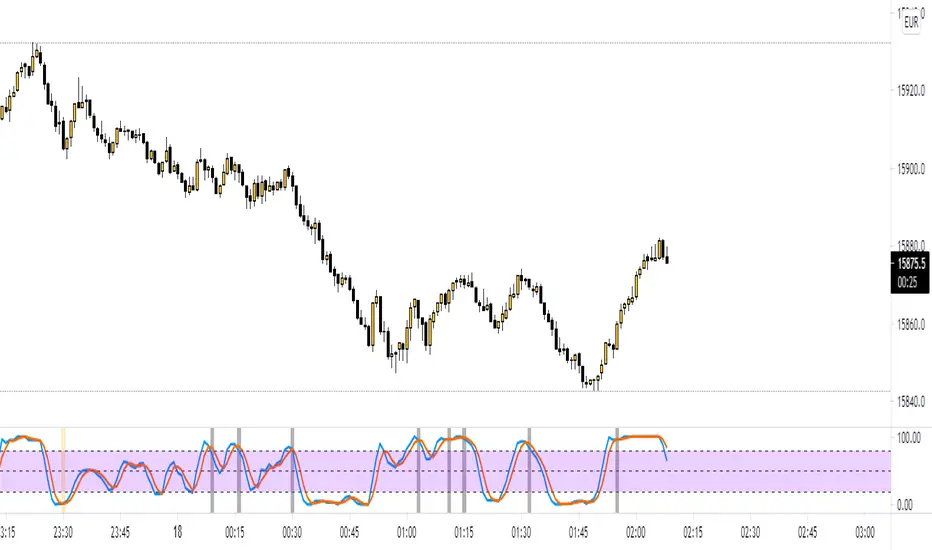
CashTrap Oscilator |HFX|CashTrap oscillator, this oscillator occupies the RSI oscillator and the Stochastic.
When the oscillator turns green, look for purchases.
When the oscillator turns red, look for sales.
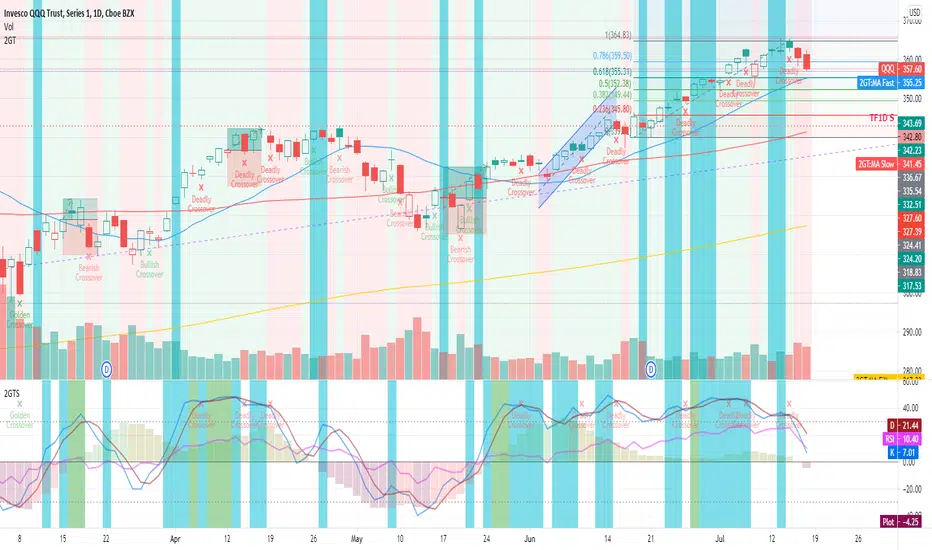
For best results, use in conjunction with the CashTrap indicator.
Pine Script®指標