RSI + STOCH RSI - Marx_CapitalSimple RSI + STOCH RSI indicator in one pane. In addition to the standard 30/70 and 20/80 RSI levels you have three adjustable levels (eg. 0, 50, 100) to indicate STOCH RSI overbought/oversold scenarios.Pine Script®指標由Marx_Capital提供已更新 275
Rahul Prakash's BUY/SELL signal for momentum tradeBuy or Sell signal with just on one confirmation candle. Show a Buy singal then wait for the confirmation candle, is a strong Buy signal. Show a Sell singal then wait for the confirmation candle, is a strong Sell signal. You can use as a free version and earn money. Please are taking lots of price for this type of indicator.Pine Script®指標由rahulmanariya2010提供已更新 28
VCAI Stochastic RSI+VCAI Stoch RSI+ is a cleaned-up Stochastic RSI built with V-Core colours for faster, clearer momentum reads and more reliable OB/OS signals. What it shows: Purple %K line → bearish momentum strengthening Yellow %D line → bullish momentum building and smoothing Soft purple/yellow background bands → OB/OS exhaustion zones, not just raw 80/20 triggers Midline at 50 → balance point where momentum shifts between bull- and bear-side control Optional HTF mode → run Stoch RSI from any timeframe while viewing it on your current chart How to read it: Both lines rising out of OS → early bullish shift; pullbacks that hold direction favour continuation Both lines falling from OB → early bearish shift; bounces into the purple OB zone can become fade setups Lines stacked and moving together → strong, cleaner momentum Lines crossing repeatedly → low-conviction, choppy conditions OB/OS shading highlights exhaustion so you focus on moves with context, not every 80/20 tick Why it’s different: Classic Stoch RSI is hyper-sensitive and mostly noise. VCAI Stoch RSI+ applies V-Core’s colour-driven regime logic, controlled OB/OS shading, and optional HTF smoothing so you see momentum structure instead of clutter — making it easier to judge when momentum is genuinely shifting and when it’s just another wiggle.Pine Script®指標由Vectorcoresai提供20
DSS Bressert (Double Smoothed Stochastic) Mid point (H+L)/2Changed source to midpoint (High+Low)/2 instead of Close for a cleaner average.Pine Script®指標由dRends35提供1123
Bli-Rik : Trend + HTF 34 + HTF RSI Rel + Stoch Filtersprovides you accurate buy and sell signals on 5 mins and 15 mins chart, mainly foe sensexPine Script®指標由bvdatar8提供2
4x Stochastic Combo - %K only4x Stochastic Combo in one indicator. Default parameters: (9, 3, 3), (14, 3, 3), (40, 4, 4), (60, 10, 10) Only %K is shown. Possibility to set alerts "all above 80" or "all below 20". How to use: Look for divergence after getting an alert for good quality signals. Connect the stochastic signals with multi-timeframe analysis.Pine Script®指標由The_stopless_trader提供5
hell double stoc double stoc with alerts set to 5.3.3. / 20.9.3 .. great for riding the waves Pine Script®指標由gman4提供17
RSI ProThis indicator displays multiple RSIs with candle color changes.Pine Script®指標由tradethisway提供2
REMS - Deep SynergyThis is a more flexible version of the REMS Synergy indicator. Like other indicators in the REMS family, it builds upon the foundations assessing the relationships between RSI, EMAs, MACDs, and Stochastic RSI across multiple timeframes. Designed to help traders identify less frequent, but high probability entries across 2 time frames. Uses 3 levels of confluence indicators for both long and short moves. Features 3 levels of confluence across 2 timeframes. All 3 levels allow filtering of any combination of REMS filters. Features more options and customization than previous REMS Synergy. Includes VWAP and 4 EMAs as optional visual representations. Includes 'Enhanced Candles' than can colour code candlesticks for better visual identification. (off by default) Originally designed with 5 minute and 2 minute timeframes in mind, and pairs well with REMS First Strike and/or REMS Snap Shot indicators. This version features no hard-coded inputs and allows for more freedom than previous version. With the added flexibility comes the ability for the indicator to be more easily stacked.Pine Script®指標由KodiakMarket提供已更新 28
Momentum Market Structure ProThis first indicator in the Beyond Market Structure Suite gives you clear market structure at a glance, with adaptive support & resistance zones. It's the only SMC-style indicator built from momentum highs & lows, as far as I know. It creates dynamic support & resistance zones that change strength and resize intelligently, and gives you timely alerts when price bounces from support/rejects from resistance. You’re free to use the provided entry and exit signals as a ready-to-use, self-contained strategy, or plug its structure into your existing system to sharpen your edge : • Market structure bias may help improve a compatible system's win rate by taking longs only in bullish bias and shorts in bearish structure. • Support/resistance can help trend traders identify inflection points, and help range traders define ranges. 🟩 HIGHLIGHTS ⭐ Unique market structure with different characteristics than purely price-based models. ⭐ Support and resistance created from only the extreme levels. ⭐ Support & resistance zones adapt to remain relevant. Zones are deactivated when they become too weak. ⭐ Long and short signals for a bounce from support/rejection from resistance. 🟩 WHY "MARKET STRUCTURE FIRST, ALWAYS"? "There is only one side to the stock market; and it is not the bull side or the bear side, but the right side." — Jesse Livermore, Reminiscences of a Stock Operator (1923) If the market is structurally against your trade, you're gonna have a bad time. So you must know what the market structure is before you plan your trade. The more precise and relevant your definition of market structure, the better. 🟩 HOW TO TRADE USING THIS INDICATOR (SIMPLE) • Directional filter : The prevailing bias background can be used for any kind of trades you want to take. For example, you can long a bounce from support in a bullish market structure bias, or short a rejection from resistance in bearish bias. • Entries : For more conservative entries, you could wait for a Candle Trend flip after a reaction from your chosen zone (see below for more about Candle Trend). • Stops : The included running stop-loss level based on Average True Range (ATR) can be used for a stop-loss — set the desired multiplier, and use the level from the bar where you enter your trade. • Take-profit : Similarly, you can set a Risk:Return-based take-profit target. Support and resistance zones can also be used as full or partial take-profit targets. See the Advanced section below for more ideas. 🟩 SIGNALS ⭐ ENTRIES You can enable signals and alerts for bounces from support and rejections from resistance (you'll get more signals using Adaptive mode). You can filter these by requiring corresponding market structure bias (it uses the bias you've already set for the background), and by requiring that Candle Trend confirm the move. I've slipped in my all-time favourite creation to this indicator: Candle Trend. When price makes a Simple Low pivot, the trend flips bullish. When price then makes a Simple High pivot, the trend flips bearish (see my Market Structure library for a full explanation). This tool is so simple, yet I haven't noticed it anywhere else. It shows short-term trends beautifully. I use it mainly as confirmation of a move. You can use it to confirm ANY kind of move, but here we use it for bounces from support/rejections from resistance. Note that the pivots and Zigzags are structure, not signals. ⭐ STOPS You can use the supplied running ATR-based stop level to find a stop-loss level that suits your trading style. Set the desired multiplier, and use the level from the bar where you enter your trade. ⭐ TAKE-PROFIT Similarly, you can set a take-profit target based on Risk:Return (R:R). If this setting is enabled, the indicator calculates the distance between the closing price and your configured stop, then multiplies that by the configured R:R factor to calculate an appropriate take-profit level. Note that while the stop line is reasonably smooth, the take-profit line varies much more, reflecting the fact that if price has moved away from your stop, the trade requires a greater move in order to hit a given R:R ratio. Since the indicator doesn't know where you were actually able to enter a position, add a ray using the drawing tool and set an alert if you want to be notified when price reaches your stop or target. 🟩 WHAT'S UNIQUE ABOUT THIS INDICATOR ⭐ MOMENTUM PIVOTS Almost all market structure indicators use simple Williams fractals. A very small number incorporate momentum, either as a filter or to actually derive the highs and lows. However, of those that derive pivots from momentum, I'm not aware of any that then create full market structure from it. ⭐ SUPPORT & RESISTANCE Some other indicators also adjust S/R zones after creation, some use volume in zone creation, some increase strength for overlap, a few merge zones together, and many use price interactions to classify zones. But my implementation differs from others, as far as I can tell after looking at many many indicators, in seven specific ways: + Zones are *created* from purely high-momentum pivots, not derived or filtered from simple Williams pivots (e.g. `ta.pivothigh()`). + Zones are *weakened* dynamically as well as strengthened. Many people know that S/R gets stronger if price rejects from it, but this is only half the story. Different price patterns strengthen *or weaken* zones. + We use *conviction-weighted candle patterns* to adjust strength. Not simply +1 for price touching the zone, but a set of single-bar and multi-bar patterns which all have different effects. + The rolling strength adjustments are all *moderated by volume*. The *relative volume* forms a part of each adjustment pattern. Some of our patterns reward strong volume, some punish it. + We do our own candle modelling, and the adjustment patterns take this into account. + We *resize* zones as a result of certain candle patterns ("indecision erodes, conviction defends"). + We shrink overlapping zones to their sum *and* add their strengths. 🟩 HOW TO TRADE USING THIS INDICATOR (ADVANCED) In addition to the ideas in the How to Trade Using This indicator (Simple) section above, here are some more ideas. You can use the market structure: • As a bias for entries given by more reactive momentum resets, or indeed other indicators and systems. • You could use a change in market structure to close a long-running trend-following position. You can use the distance from a potential entry to the CHoCH line as a filter to choose higher-potential trades in ranging assets. Confluence between market structure and your favourite trend indicator can be powerful. Multi timeframe analysis This is a bit of a rabbit hole, but you could use a split screen with this indicator on a higher timeframe (HTF) view of the same asset: • If the 1D structure turns bullish, the next time that the 1H structure also flips bullish might be a good entry. • Rejection from a HTF zone, confirmed by lower timeframe (LTF) structure, could be a good entry. None of this is advice. You need to master your own system, and especially know your own strengths and weaknesses, in order to be a successful trader. An indicator, no matter how cool, is not going to one-shot that process for you. In Adaptive mode, a skillful trader will be able to spot more opportunities to classify and use support and resistance than any algorithm, including mine, now that they've been automatically drawn for you. If you are doing historical analysis, note that the "Calculated bars" setting is set to a reasonably small number by default, which helps performance. Either increase this number (setting to zero means "use all the bars"), or use Bar Replay to examine further back in the chart's history. If you encounter errors or slow loading, reduce this number. 🟩 SUPPORT & RESISTANCE A support zone is an area where price is more likely to bounce, and a resistance zone is an area where price is more likely to reject. Marking these zones up on the chart is extremely helpful, but time-consuming. We create them automatically from only high-momentum areas, to cut noise and highlight the zones we consider most important. In Simple mode, we simply mark S/R zones from momentum and Implied pivots. We don't update them, just deactivate them if price closes beyond them. Use this mode if you're interested in only recent levels. In Adaptive mode, zones persist after they're traversed. Once the zones are created, we adjust them based on how price and volume interact with them. We display stronger zones with more opaque fills, and weaker zones with more transparent fills. To calculate strength, we first preprocess candles to take into account gaps between candles, because price movement after market is just as important in its own way. The preprocessing also redefines what constitutes upper and lower wicks, so as to better account for order flow and commitment. We use these modelled candle values, as well as their relative amplitude historically, rather than the raw OHLC for all calculations for interactions of price and zones. It's important to understand, when trying to figure out why the indicator strengthened or weakened a zone, that it sees fundamental price action in a different way to what is shown on standard chart candles (and in a way that can't easily be represented accurately on chart candles). Then, we strengthen or weaken , and resize support and resistance zones dynamically using different formulas for different events, based on principles including these: • The close is the market's "vote", the momentum shift anchor. • Defended penetrations reveal validated liquidity clusters. • Markets contract to defended levels. • "The wick is the fakeout, but the close tells you if institutions held the level." — ICT (Inner Circle Trader) Adaptive mode is more powerful, but you might need to tweak some of the Advanced Support & Resistance settings to get a comfortable number of zones on the chart. 🟩 MOMENTUM PIVOTS The building blocks of market structure are Highs and Lows — places where price hits a temporary extreme and reverses. All the indicators I could find that create full market structure do so from basic price pivots — Williams fractals, being the highest/lowest candle wick for N candles backwards and forwards (there are some notable first attempts on TradingView to use momentum to define pivots, but no full structure). "Highest/lowest out of N bars" is the almost universal method, but it also picks up somewhat arbitrary price movements. Recognising this, programmers and traders often use longer lookbacks to focus on the more significant Highs and Lows. This removes some noise, but can also remove detail. My indicator uses a completely different way of thinking about High and Low pivots. A High is where *momentum* peaks and falls back, and a low is where it dips and then recovers. While this is happening, we record the extremes in price, and use those prices as the High or Low pivot zones. This deliberately picks out different, more meaningful pivots than any purely price-based approach, helping you focus on the swings that matter. By design, it also ignores some stray wicks and other price action that doesn't reflect significant momentum. Price action "purists" might not like this at first, but remember, ultimately we want to trade this. Check and see which levels the market later respects. It's very often not simply the numerically higher/lower local maxima and minima, but the levels that held meaning, interpreted here through momentum. The first-release version uses the humble Stochastic as the structural momentum metric. Yes, I know — it's overlooked by most people, but that's because they're using it wrong. Stochastic is a full-range oscillator with medium excursions, unlike RSI, say, which is a creeping oscillator with reluctant resets. This makes Stoch (at the default period of 14) not quite reactive enough for on-the-ball momentum reset entry signals, but close to perfect (no metric is 100%) for structural pivots. Stochastic is also a solid choice for structure because divergences are rare and not usually very far away in terms of price. More reactive momentum metrics such as Stochastic RSI produce very noisy structure that would take a whole extra layer of interpreting (see Further Research, below). For these reasons, I may or may not add other options for momentum. In the initial release, I've added smoothed RSI as an alternative just to show it's possible, which takes even longer than Stochastic to migrate from one extreme to another, creating an interesting, longer-term structure. 🟩 IMPLIED PIVOTS We want pivots to mark important price levels so that we can compute market direction and support & resistance zones from them. In this context, we see that some momentum metrics, and Stochastic in particular, tend to give multiple consecutive resets in the same direction. In other words, we get High followed by High, or Low followed by Low, which does not give us the chance to create properly detailed structure. To remedy this, we simply take the most extreme price action between two same-direction pivots, and create an Implied pivot out of it, after the second same-direction pivot is created. Obviously these pivots are created very late. Recalling why we wanted them, we realise that this is fine. By definition , price has not exceeded the Implied Pivot level when they're created. So they show us an interesting level that is yet untested. Implied Pivots are thus created indirectly by momentum but defined directly by price. They are for structure only. We choose not to give them a Dow type (HH, HL, LH, LL) and not to include them in the Main Zigzag to emphasise their secondary nature. However, Implied Pivots are not "internal" or "minor" pivots. There is no such concept in the current Momentum Market Structure model. If you want less responsive, more long-term structure, you can turn Implied Pivots off. 🟩 DOW STRUCTURE Dow structure is the simplest form of market structure — Higher Highs (HHs) and Higher Lows (HLs) is an uptrend (showing buyer dominance), and vice-versa for a downtrend. We label all Momentum (not Implied) Pivots with their Dow qualifier. You can also choose to display the background bias according to the Dow trend. There is an input option to enable a "Ranging" Dow state, which happens when you get Lower Highs in an uptrend or Higher Lows in a downtrend. 🟩 SMC-STYLE STRUCTURE (BOS, CHOCH) The ideas of trend continuation after taking out prior highs/lows and looking for early signs of possible reversal go back to Dow and Wyckoff, but have been popularised by SMC as Break Of Structure (BOS) and Change of Character (CHoCH). BOS can be used as a trigger: for example: • Wait for a bullish break of structure • Then attempt to buy the pullback • Cancel if structure breaks bearish (meaning, we get a bearish CHoCH break) How to buy the pullback? This is the trillion-dollar question. First, you need solid structure. Without structure, you got nothin'. Then, you want some identified levels where price might bounce from. If only we incorporated intelligent support and resistance into this very indicator 😍 Creating and maintaining correct BOS and CHoCH continuously , without resetting arbitrarily when conditions get difficult, is technically challenging. I believe I've created an implementation of this structure that is at least as solid as any other available. In general, BOS is fully momentum‑pivot‑driven; CHoCH is anchored to momentum pivots but maintained mainly by raw price extremes relative to those anchors (breaks are obviously pure price). This means that the exact levels will sometimes differ from your previous favourite market structure indicator. We have made some assumptions here which may or may not match any one person's understanding of the "correct" way to do things, including: BOS is not reset on wicks because, for us, if price cannot close beyond the BOS there is no BOS break, therefore the previous wick level is still important. The candidate for CHoCH on opposing CHoCH break *is* reset on a wick, because we want to be sure to overcome the leftover liquidity at that new extreme before calling a Change of Character. The CHoCH is moved on a BOS break. For a bullish BOS break, the new CHoCH is the lowest price *since the last momentum pivot was confirmed, creating the BOS that just broke*, and vice-versa for bearish. If there's a stray wick before that, which doesn't shift momentum, we don't care about it. 🟩 ZIGZAG The Major Swing Zigzag dynamically connects momentum highs and lows (e.g., from a Higher Low to the latest Higher High), adjusting as new extremes form to reveal the overall trend leg. The Implied Structure Zigzag joins momentum pivots and Implied pivots, if enabled. 🟩 REPAINTING It's really important to understand two things before asking "Does it repaint?": 1. ALL structure indicators repaint, in the sense of drawing things into the past or notifying you of things that happened in past bars, because by definition, structure needs some kind of confirmation, which takes at least one bar, usually several. This is normal. 2. Almost all indicators of ANY kind repaint in that they display unconfirmed values until the current bar closes. This is also normal. Most features of this indicator repaint in the ordinary, intended ways described above: the pivots (Implied doubly so), BOS and CHoCH lines, and formation of S/R zones. The Zigzags, by design, adjust themselves to new pivots. The active lines often change and attach themselves to new anchors. This is a form of repainting. It's important to note that the Zigzags are not signals. They're there to help visualise market structure, and structure does change. Therefore, I prioritised clearly explaining what price did rather than preserving its history. One of the "bad" kinds of repainting is if a signal is printed when the bar closes, but then on a later bar that "confirmed" signal changes. This is a fundamental issue with some high timeframe implementations. It's bad because you might already have entered a trade and now the indicator is pretending that it never signalled it for you. My indicators do not do this (in fact I wrote an entire library to help other authors avoid this). If you are ever in any doubt, play with an indicator in Bar Replay mode to see exactly what it does. To understand repainting, see the official docs: www.tradingview.com 🟩 FURTHER RESEARCH I've attempted to answer two of the tricky problems in technical analysis in Pine: how to do robust and responsive market structure, and how to maintain support and resistance zones once created. However, this just opens up more possibilities. Which momentum metrics are suitable for structure? Can more reactive metrics be used, and how do we account for divergences in a structural model based on key horizontal levels? Which sets of rules give the best results for maintaining support and resistance? Does the market have a long or a short memory? Is bar decay a natural law or a coping mechanism? 🟩 CREDITS ❤️ I'd like to thank my humble trading mentor, whose brilliant ideas inspire me to garble out code. Thanks are also due to @Timeframe_Titans for guidance on the finer points of market structure (all mistakes and distortions are my own), and to @NJPorthos for feedback and encouragement during the months in the wilderness.Pine Script®指標付費腳本由SimpleCryptoLife提供1111124
ZENADX Momentum FlowZENADX Momentum Flow คืออินดิเคเตอร์ที่ออกแบบมาเพื่อช่วยเทรดเดอร์จับ “ทิศทาง + จังหวะ” ของตลาดด้วยความเรียบง่ายแบบเซน แต่ทรงพลังด้วยแกนวิเคราะห์จาก ADX, DI และ Stochastic Momentum อินดิเคเตอร์นี้ผสมผสาน โครงสร้างเทรนด์ (Trend Structure) ด้วย ADX/DI และ โมเมนตัม (Momentum Timing) ด้วย Stochastic เพื่อค้นหาจุดเข้าออกที่ “นิ่ง คม และมีสติ” ตามหลัก Zen Flow Trading สิ่งที่ ZENADX Momentum Flow ทำให้คุณ: 1.จับเทรนด์หลักด้วย ADX ที่ผ่านเกณฑ์ความแข็งแรง 2.ฟิลเตอร์จังหวะด้วย Stochastic เพื่อหลีกเลี่ยงสัญญาณหลอก 3.แสดงสัญญาณ BUY/SELL เฉพาะเมื่อน้ำหนักเทรนด์ + โมเมนตัมสอดคล้องกัน เหมาะทั้งสาย Trend Following และ Swing Entry ที่ต้องการ Flow ที่เป็นระบบ เหมาะกับใคร? สายเทรนด์, เทรดเดอร์แบบ Flow, คนที่ชอบระบบที่เรียบง่ายแต่ให้ “ความมั่นใจ” เวลาเข้าออก หลักการ Zen: ไม่ใช่แค่การตามเทรนด์… แต่คือการ ไหลไปตามตลาด อย่างมีสติและไม่ฝืนตลาด ------------------------------------------------------------------------- ZENADX Momentum Flow is a trend–momentum hybrid indicator designed for traders who want clarity, simplicity, and precision. Inspired by Zen principles, this tool helps you align with the market’s natural flow—without noise or over-complication. This indicator blends trend strength from ADX/DI with momentum confirmation from Stochastic, producing clean BUY/SELL signals only when both market structure and momentum agree. What ZENADX Momentum Flow provides: Detects strong trend directions using ADX threshold logic Filters noise with Stochastic momentum alignment Generates precise BUY/SELL signals based on DI crossovers + momentum confirmation Ideal for Trend Following and Swing Entry traders who want a smooth, systematic flow Perfect for: Traders who seek a calm, disciplined, and structured way to follow the market’s movement—without forcing trades. Zen Philosophy: You don’t fight the trend… You flow with it.Pine Script®指標由togethertrader4提供已更新 3
Stochastic Average (2 TFs)“Stoch (2 TFs)” plots two separate Stochastic oscillators from two different timeframes in a single pane and adds an average line of all four values (%K and %D from each timeframe). It is designed to quickly compare short-term vs higher-timeframe momentum and see whether they are aligned or diverging. The script is an overlay-off oscillator, so it appears in its own window under the price chart. How it works The indicator calculates a classic Stochastic (%K and %D) on two user-selectable timeframes: tf1 (default 30 minutes) tf2 (default 60 minutes) For each timeframe it: Requests the high, low and close series from that timeframe using request.security. Computes %K as the smoothed position of the close within the lookback high/low range. Computes %D as a moving average of %K. So you get four lines in total: K1 and D1 from timeframe 1 K2 and D2 from timeframe 2 A small table in the top-right of the pane shows which timeframes are currently selected for TF1 and TF2, so you always know what you are looking at even if you change the chart timeframe. Inputs %K Length – lookback period used to find highest high and lowest low. %K Smoothing – smoothing length for the %K line. %D Smoothing – smoothing length for the %D line. 30 (tf1) – first Stochastic timeframe (default 30m). %K Color (1) / %D Color (1) – colors for K1 and D1. 60 (tf2) – second Stochastic timeframe (default 60m). %K Color (2) / %D Color (2) – colors for K2 and D2. Average Color – color for the current bar average line. Average Prev Color – color for the previous-bar average line. You can put this indicator on any chart timeframe; the internals always use the two selected timeframes via request.security. Visual elements The pane shows: Four Stochastic lines: K1 and D1 (for tf1), K2 and D2 (for tf2), using the input colors. Three horizontal reference levels: 80 (upper band), 50 (middle), 20 (lower band). A light blue background band between 80 and 20 to make the overbought/oversold zone easier to see visually. A 2-cell table in the top-right with the current values of tf1 and tf2. These elements make it easy to see when each timeframe is overbought, oversold, or in the middle zone, and whether the two timeframes are synchronized or showing divergence. Average and previous-average lines At the bottom of the script there is a simple composite measure: Sum KD adds K1 + D1 + K2 + D2 and divides by 4. Prev Sum KD does the same for the previous bar ( ). Both are plotted as separate lines: Sum KD – current bar average of all four Stochastic values (main composite). Prev Sum KD – previous bar average (for comparison). This makes it easy to see whether overall multi-timeframe Stochastic momentum is increasing or decreasing from bar to bar without having to visually average four separate curves. How to use Typical uses: See short- vs higher-timeframe Stochastic at a glance and trade only when they agree. Look for divergence between TF1 and TF2 (e.g., lower timeframe overbought while higher timeframe still neutral). Use the average lines (Sum KD and Prev Sum KD) as a simple “multi-TF momentum gauge” for confirmations or filters.Pine Script®指標由alejandroscotti提供2
SMI 30m With Built-in Divergence AlertsStochastic Momentum Index SMI 30m is a simplified, single-timeframe Stochastic Momentum Index (SMI) designed for traders who want a clean momentum oscillator with clear crossover signals and automatic higher-timeframe filtering. This version is locked to a 30-minute timeframe, making it consistent across any chart you place it on. The script plots: SMI Blue Line – the main momentum line SMI Orange Line – the signal line (EMA-smoothed) Overbought / Oversold regions Optional colored background zones that highlight strong momentum extremes Both the Blue and Orange plots are fully exposed, allowing users to manually create TradingView alerts for crossovers. Additionally, the script includes two built-in alert conditions for traders who prefer automatic signals. How the SMI is calculated This script uses a double-EMA smoothing method to stabilize momentum: Highest and lowest price ranges are calculated over the selected %K period. Relative position of price inside that range is computed. A double EMA is applied to both the range and the midpoint offset. The SMI result is scaled to ±200 for clarity. The Signal Line is a single-EMA applied to the SMI. These parameters can be adjusted: %K Length %D Length EMA Length The default values match traditional 13-3-3 SMI settings. Visual Components 1. SMI Blue Line Represents the primary momentum movement. Values above 40 indicate positive momentum; values below −40 indicate negative momentum. 2. SMI Orange Line Acts as a smoothing signal line. Crossovers between Blue and Orange often indicate momentum shifts. 3. Overbought / Oversold Zones +40 = overbought boundary −40 = oversold boundary These levels help identify exhaustion points. 4. Gradient High/Low Zones The script includes colored fill zones above +40 and below −40 to visually highlight extreme momentum regions. Built-In Alerts The indicator includes two pre-configured alert conditions: 1. Bearish Cross (Overbought) Triggers when: The Blue SMI crosses below the Orange SMI AND the Blue SMI value is above 80 This represents a potential bearish divergence or momentum reversal from extreme highs. Alert title: SMI Bearish Cross 2. Bullish Cross (Oversold) Triggers when: The Blue SMI crosses above the Orange SMI AND the Blue SMI value is below −80 This represents a potential bullish divergence or reversal from extreme lows. Alert title: SMI Bullish Cross How to Use Alerts After adding the indicator to your chart: Open the Alerts panel Select Condition → SMI (1 TF) 30m Choose either: SMI Bearish Cross SMI Bullish Cross Set your preferred trigger method: Once per bar close Once per bar Once per minute Create the alert Traders can also manually create alerts for: Blue crossing above Orange Blue crossing below Orange Because both plots are fully exposed. Purpose This indicator is intended for traders who want a stable, single-timeframe SMI with: Clear structure Extreme-zone highlighting Exposed plots for custom alerts Built-in reversal alerts Consistent 30-minute TF regardless of chart It can be used for: Identifying trend reversals Detecting momentum exhaustion Confirming entries/exits Spotting early divergence signalsPine Script®指標由alejandroscotti提供已更新 3
Stochastic BTC OptimizedEnhanced Stochastic for Bitcoin (BTC) – Optimized for Daily Timeframe This enhanced Stochastic oscillator is specifically fine-tuned for BTC/USD on the 1D timeframe, leveraging historical data from Bitstamp (2011–2025) to minimize false signals and maximize reliability in Bitcoin's volatile swings. Unlike the classic Stochastic (14, 3, 3), this version uses optimized parameters: - K Period = 21 – smoother reaction, better suited for BTC’s macro cycles - D Period = 3, Smooth K = 3 – reduces noise while preserving responsiveness - Overbought = 85, Oversold = 15 – accounts for BTC’s tendency to trend strongly within extreme zones without immediate reversal ✅ Smart Signal Logic: Buy/sell signals appear only when %K crosses %D inside the oversold (≤15) or overbought (≥85) zones, and only the first signal is shown to avoid whipsaws. Visual Enhancements: - Thick lines when %K/%D are in overbought/oversold zones - Green/red background highlights on valid signals - Optional up/down arrows for clear entry visualization - Customizable colors, line widths, and transparency 🔒 No alerts included – clean, focused on price action and momentum. 💡 Pro Tip: For even higher accuracy, use this indicator in combination with a long-term trend filter (e.g., EMA 200). The oscillator excels in ranging or retracement phases but should not be used alone in strong parabolic moves. Based on Mozilla Public License v2.0 – feel free to use, modify, and share. Perfect for swing traders and long-term Bitcoin analysts seeking high-probability reversal zones. перевод на русский Улучшенный Stochastic для Bitcoin (BTC) — оптимизирован для дневного таймфрейма Этот улучшенный осциллятор Stochastic специально настроен под BTC/USD на дневном графике, с учётом исторических данных Bitstamp (2011–2025), чтобы минимизировать ложные сигналы и повысить надёжность в условиях высокой волатильности биткоина. В отличие от классического Stochastic (14, 3, 3), эта версия использует оптимизированные параметры: - Период K = 21 — более плавная реакция, лучше соответствует макроциклам BTC - Период D = 3, Сглаживание K = 3 — снижает шум, сохраняя отзывчивость - Уровень перекупленности = 85, перепроданности = 15 — учитывает склонность BTC к сильным трендам в экстремальных зонах без немедленного разворота ✅ Интеллектуальная логика сигналов: Покупка/продажа отображается только при пересечении %K и %D внутри зоны перепроданности (≤15) или перекупленности (≥85), и только первый сигнал фиксируется, чтобы избежать «хлыстов». Улучшенная визуализация: - Жирные линии, когда %K/%D находятся в экстремальных зонах - Зелёный/красный фон при появлении сигналов - Опциональные стрелки для чёткого отображения точек входа - Настройка цветов, толщины линий и прозрачности 🔒 Без алертов — чистый инструмент, сфокусированный на цене и импульсе. 💡 Совет профессионала: для ещё большей точности используйте этот индикатор вместе с трендовым фильтром (например, EMA 200). Осциллятор лучше всего работает в фазах консолидации или отката, но не стоит применять его в одиночку во время сильных параболических движений. На основе Mozilla Public License v2.0 — свободно используйте, модифицируйте и делитесь. Идеален для свинг-трейдеров и аналитиков Bitcoin, ищущих зоны с высокой вероятностью разворота. Pine Script®指標由indexrate提供12
hell stoc supper trend 1stoc set to 5.3.3 and supper trend dynamic ob and os lines Pine Script®指標由gman4提供6
stochastic supper trendstocastic supper trend channel based on sk trading system with dynamic od os lines changing colorPine Script®指標由gman4提供9
Stochastic Pro+ Suite📚 What Is the Stochastic Oscillator? The stochastic oscillator is a momentum indicator comparing a security's closing price to its price range over a set number of periods. The %K line represents the raw stochastic value, while the %D line is a smoothed moving average of %K. Stochastic helps identify: Overbought and oversold conditions Bullish and bearish crossovers Momentum shifts before price reversals It is widely used in both trending and ranging markets. 💡 What Makes This Suite Different? This script supercharges the traditional stochastic with a multi-timeframe engine , divergence detection , and a highly customizable visual suite , including: ✅ Core Features: - Multi-Timeframe (%K, %D, Spread): Pulls stochastic data from any higher timeframe for improved signal quality. - Custom Overbought/Oversold Levels: Fully adjustable OB/OS thresholds (default: 80/20). - %K-%D Spread Histogram: View the difference between %K and %D visually as a histogram. - Color-coded Cross Highlights: Optional background shading for key crossover events in OB/OS zones (high probability reversal areas). 🔍 Divergence Detection (Optional): - Bullish Divergence: Price makes lower lows while %K makes higher lows. - Bearish Divergence: Price makes higher highs while %K makes lower highs. - Customizable pivot lookbacks and range filters to control divergence strictness. - Visual divergence labels plotted directly on the oscillator. 🎛️ Fully Toggleable Visuals: Show/hide %K, %D, OB/OS lines, spread histogram, background highlight, and divergence — all via simple checkboxes. 🔔 Alerts: Set alerts for both bullish and bearish divergences — ideal for swing, day, or trend reversal strategies. ⚙️ Use Cases - Spot exhaustion in overbought/oversold zones - Confirm or filter entries with divergence signals - Monitor multiple timeframes without switching charts - Use as a signal tool in confluence with price action or volume indicators ⚠️ Disclaimer This tool is for educational and informational purposes only. It does not constitute financial advice, trading advice, or investment guidance. Always do your own research and consult a qualified financial advisor before making trading decisions.Pine Script®指標由RWCS_LTD提供63
SMI Color Red/Green📌 TradingView Description – SMI Red/Green Momentum Line 🔥 Stochastics Momentum Index (SMI) – Dynamic Red/Green Version This indicator is an enhanced and modernized version of the Stochastic Momentum Index (SMI), designed to deliver a more visual, intuitive, and responsive view of trend momentum. It includes: ✔️ Smoothed SMI ✔️ Dynamic Red/Green momentum coloring ✔️ Signal EMA line ✔️ Overbought/Oversold zones with shading 🎨 Dynamic Red/Green SMI Line The main SMI line automatically changes color based on momentum direction: Green → Bullish momentum (SMI rising) Red → Bearish momentum (SMI falling) This provides instant visual feedback and highlights early momentum changes even before traditional signal-line crossovers. 📉 Indicator Structure 1️⃣ Smoothed SMI The SMI is calculated using the price’s position inside its range and then smoothed with an SMA to reduce noise. 2️⃣ EMA Signal Line A customizable EMA acts as a signal line, providing: Clear bullish/bearish crossovers Trend confirmation Cleaner entry/exit signals 3️⃣ Overbought / Oversold Zones Extreme levels are highlighted using color-filled zones: Red Zone (Overbought) → potential bearish reversal Green Zone (Oversold) → potential bullish reversal Levels are fully adjustable. 💡 How to Use It The indicator works exceptionally well across all timeframes. The most powerful signals are: ✔️ SMI crossing above/below the EMA SMI crosses above EMA → bullish signal SMI crosses below EMA → bearish signal ✔️ Leaving Overbought/Oversold zones SMI exits the oversold zone → potential long setup SMI exits the overbought zone → potential short setup ✔️ Color shifts (momentum direction) Red → Green : early bullish momentum Green → Red : early bearish momentum Perfect for scalping, day trading, and swing trading. 🚀 Why This Version Is Better Extremely visual momentum reading Noise reduction through smoothing Instantly readable color-coded trend Strong OB/OS zone visualization Works on any market and timeframe Great in combination with RSI, MACD, HMA, ALMA, and trend filters If you'd like, I can also write: 🔹 a SEO-optimized title, 🔹 recommended TradingView tags, 🔹 or a shorter promotional description.Pine Script®指標由maxime15提供42
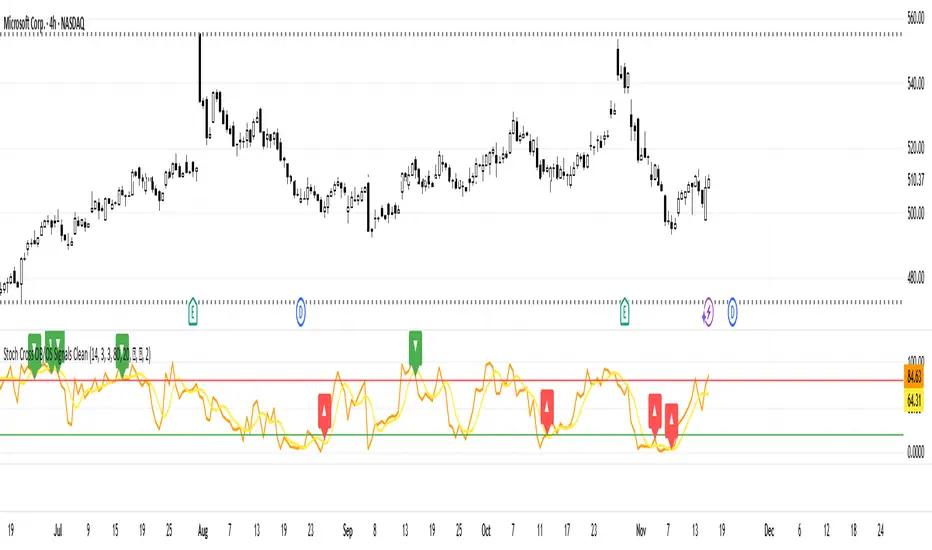
Stoch Cross OB/OS Signals CleanStoch Cross OB/OS Signals Displays fast (%K) and slow (%D) Stochastic lines with visual signals for overbought and oversold conditions. Alerts when the fast line crosses the slow line in OB/OS zones using customizable symbols. Ideal for spotting short-term reversals and timing entries/exits. Features adjustable periods, OB/OS levels, and symbol sizes for clear chart visualization.Pine Script®指標由Joda_Fib_69提供已更新 15
Stoch-Candles SMAStochastik-kerzen auf basis von Stochastik Zeigen den Trend an. Pine Script®指標由ashpi82提供11
Range Oascilator + LessDivergences + MACD+StochRSIRange Oscillator + EMA Filter Calculates a custom oscillator based on the highest high and lowest low over a chosen period. Generates BUY signals when the oscillator crosses up from the oversold zone and price is above the EMA. Generates SELL signals when the oscillator crosses down from the overbought zone and price is below the EMA. MACD (3‑10‑16 EMA Settings) Uses fast EMA = 3, slow EMA = 10, signal EMA = 16. Detects bullish and bearish crossovers. These crossovers only trigger a single unified buy/sell signal if they coincide with Stochastic RSI being in oversold (for buy) or overbought (for sell) zones. Stochastic RSI Standard calculation with %K and %D smoothing. Defines oversold (<20) and overbought (>80) zones. Used both for divergence detection and as a filter for MACD signals. Divergence Detection RSI Divergence: Price makes a lower low but RSI makes a higher low (bullish), or price makes a higher high but RSI makes a lower high (bearish). MACD Histogram Divergence: Price makes a lower low but MACD histogram makes a higher low (bullish), or price makes a higher high but MACD histogram makes a lower high (bearish). Stochastic RSI Divergence: Similar logic applied to %K line. Divergences are flagged only once per pivot to avoid repetitive signals. Visuals EMA plotted on chart. BUY/SELL signals shown as triangles above/below bars. Divergences shown as labels (e.g., “RSI BullDiv”, “MACD BearDiv”). Unified MACD+Stoch RSI signals shown in distinct colors (lime for buy, orange for sell).Pine Script®指標由hakantugurlu77提供10
Stochastic Triple Momentum by SidHemA precision-tuned Stochastic system combining MTF (Multi Time Frame) momentum, Divergence detection, and market pressure scoring. Full Description: Stochastic Triple Momentum by SidHem is a performance-focused oscillator designed for traders who want deeper momentum insight without chart clutter. It enhances the classic Stochastic with three high-value features: The "Triple Momentum" refers to: Stochastic slope momentum RSI momentum zone MFI money flow bias 1) Multi-Timeframe Stochastic Compare local swings against higher timeframe momentum. Turn it on when you want trend confirmation across intraday → swing → positional context. 2) Full Divergence Engine (Regular + Hidden) Automatically detects: Regular Bullish / Regular Bearish Divergence Hidden Bullish / Hidden Bearish Divergence Visual style options: Labels on the stochastic panel Swing-to-swing Divergence Lines Each divergence category has independent color, width, and label size controls. 3) Trend Strength Meter + Heat Strip Momentum pressure is scored using: Stochastic slope direction RSI position relative to 50 MFI (Money Flow Index) position relative to 50 This produces a clear bias/sentiment reading: Strong Bear → Bearish → Weak Bear → Neutral → Weak Bull → Bullish → Strong Bull Displayed as: A Trend Strength Label (movable to multiple panel positions) A Heat Strip at the bottom of the panel for quick visual bias Additional Customization: Adjustable %K / %D smoothing Selectable line style, width, opacity Overbought / Oversold bands with independent styling Classic / Modern / Heatmap background shading modes Optional RSI and MFI overlays Panel locked to 0-100 for consistent scaling Ideal Usage: Use higher timeframes (e.g., 4H / Daily) for trend bias. Use divergences + %K/%D crossovers for precise entry timing. Use Trend Meter and Heat Strip to filter out weak signals. This indicator works on: Stocks Index Futures Crypto Forex Commodities Any timeframe Pine Script®指標由sidhem提供17
MACD + StochasticMACD + Stochastic 14 Scenarios - Complete Signal Analysis Combines MACD and Stochastic Oscillator to identify 14 different market scenarios based on crossover timing and indicator positioning. 🎯 Signal Strength Classification: • STRONG (⭐⭐⭐⭐⭐): Both indicators cross together - highest confidence • MODERATE (⭐⭐⭐⭐): One crosses while other confirms - good confidence • WEAK (⭐⭐): Conflicting signals - low confidence 📊 Visual Features: ✓ Color-coded shapes on chart (triangles, circles, X marks) ✓ Scenario labels (1-16, excluding 12 & 14) ✓ Real-time info table showing current status ✓ Customizable signal display (show/hide by strength) ✓ Built-in alerts for all signal types Perfect for swing traders and position traders looking for high-probability entries with dual indicator confirmation. Use on daily timeframe for best results. Includes toggleable display options for strong, moderate, and weak signals.Pine Script®指標由Sakett_Guptaa提供28