Absolute Strength Histogram | jhOriginal ASH code from alexgrover Some changes: - Change the price to SMA with Period of 1 with reference to the original MT4 code - Added a few more MAs Pine Script®指標由jiehonglim提供已更新 22359
CRSI & StochRSI ESHMAN v3This indicator was created to back a strategy. uses CRSI and StochRSI. Indicator may not be useful without the underlying strategy. Publisher take no responsibility for your loss. Use at your own risk. Added crossover and crossunder.Pine Script®指標由aamirmajeed1提供1139
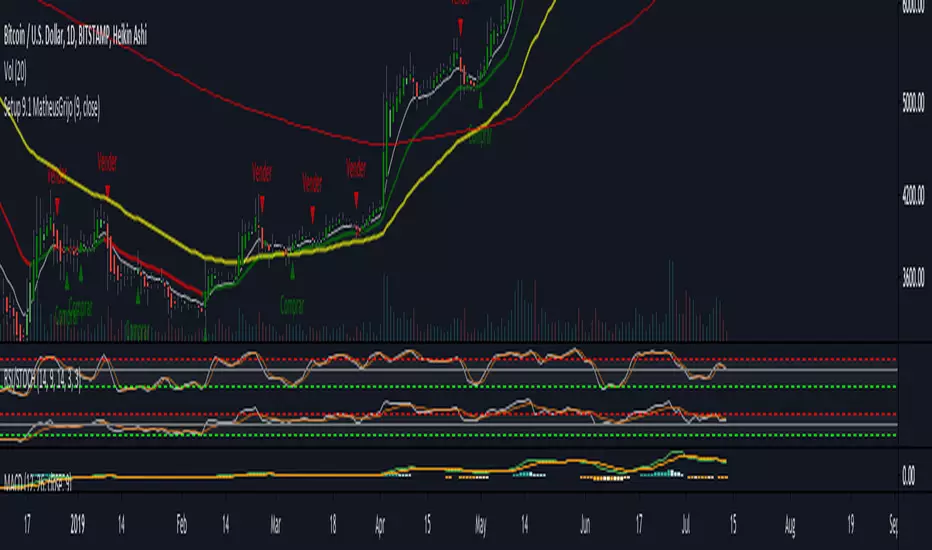
CRSI & Stoch RSI EshmanThis indicator is combination of CRSI and Stoch RSI. This indicator is created to back a strategy to catch all Long and Short rallies. There are additional confirmations required for trade which are only mentioned in the underlying strategy. The publisher take no responsibility of your loss. Use at your own risk.Pine Script®指標由aamirmajeed1提供28
True Strength V2True strength using two stochastic's and a VWMA , can use for cycle indication as well Pine Script®指標由Wayne-o提供已更新 192
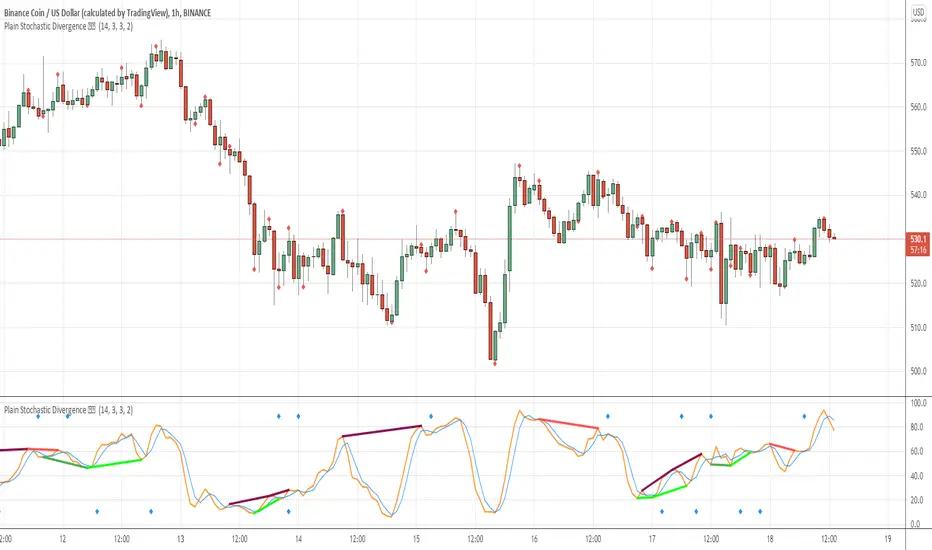
Plain Stochastic Divergence Stochastic Divergence Plain simple way of calculating divergences We all have times when we want to see just the divergences and nothning else This script is minimalised to visualize that references : // stochastic // divergence // stoch // Pine Script®指標由DevLucem提供已更新 1818 1.2 K
Function StochRSI Stochastic Relative Strength Index developed by Tushar Chande and Stanley Kroll. This script has been written to eliminate the period variable.(Integer) Thus, it can be used comfortably in adaptive period scripts ! (For example : Adaptive Moving Average , KAMA , FAMA .. etc. ) All efforts goes to ChaosTrader () , RicardoSantos () , Hpotter for barcolor codes (iff) () I hope it will help your new ideas . Best regards ! Noldo . Pine Script®指標由Noldo提供已更新 22237
Stochastic RSI (with alerts)This is a modification of original Stochastic RSI oscillator, but with addition of highlighted death and golden crosses. It also allows you to receive alerts: "Stochastic RSI: Death cross on 4hours"Pine Script®指標由pikusfikus2提供33197
Hashem Extended Stochastic (V2)Extended Stochastic with All Zones. From Neutral to Danger Zones. The Most Complete and Extended Stochastic Indicator.Pine Script®指標由rhawshemi提供已更新 33188
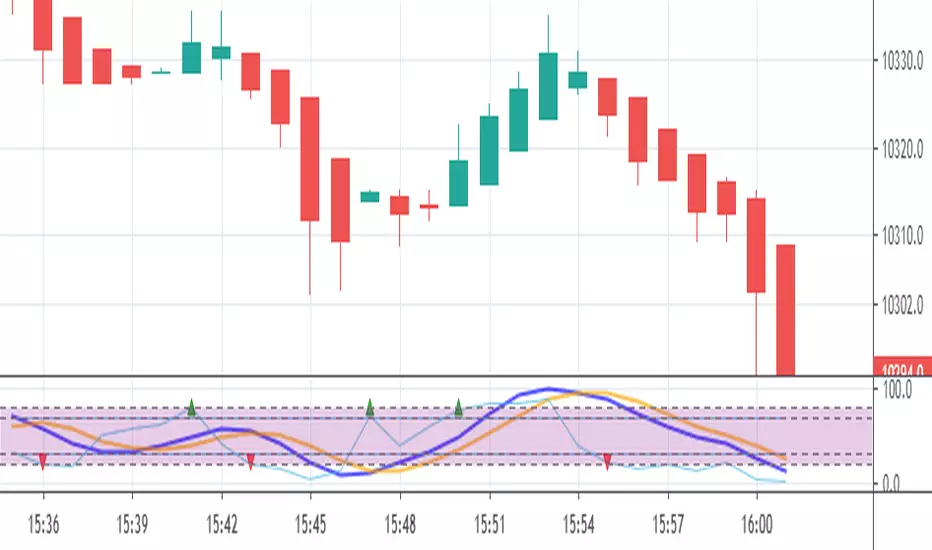
Market Cycle & Scalping entry / exitCycle indicator is an oscillator commonly used to identify market trends and provide buy and sell signals to traders. The Cyle indicator is based on the assumption that currency trends accelerate and decelerate in cyclical patterns that may reflect the dominant price cycle of any stock, during any time frame. It works best on a 1 min chart for quick scalp plays. Pine Script®指標由DarkSideTrader提供44237
Options - StochasticThis is a simple stochastic oscillator with predefined settings for short, mid, and long time. These settings are specially fabricated for options trading.Pine Script®指標由CAB_Member提供39
Hashem Extended StochasticExtended Stochastic with All Zones. From Neutral to Danger Zones. The Most Complete and Extended Stochastic Indicator.Pine Script®指標由rhawshemi提供已更新 49
Scott's MTF: RSI with ema and stochasticI made this for backtesting the 1 hour TF where I am more interested in 4 hour stochastic and RSI than the default 1 hour stoch and RSI.Pine Script®指標由SpaghettiScott提供101
Profit Runner Study v2.0Updated version of our Profit Runner indicator. All of our invite-only scripts are available through our website profitprogrammers.com. All studies come together with their strategy equivalent!Pine Script®指標由ProfitProgrammers提供29
Scott's RSI with ema and stochsRSI with ema of RSI with regular stochastic overlaid into the same panel with control zones. Pine Script®指標由SpaghettiScott提供1154
TA-Money Flow-Version3This is the MACD of a stochastic OBV movement indicator. It is good (right) to work with both price and volume. I've included highlighting based on price divergence. It works great on any time frame, but you need to have volume data. Not sure where I originally got this (stoch-OBV, somewhere off Tradingview several years ago, thanks to the person who shared), just publishing because of a request. Enjoy. Version 2 - TA-Money-Flow-v2-Stochastic-OBVPine Script®指標由kocurekc提供已更新 404
Stochastic ConfluenceShows 5 stochastic plots with moving average cross marks for different time-frames. Each plot is based on the current interval times the configurable multiplier. E.g.: If you are viewing 1h chart, the settings 1, 2, 3, 4, 6 will get you stochs for the 1h, 2h, 3h, 4h and 6h.Pine Script®指標由SemiQuasi提供已更新 33143
Hedging CryptocurrencyПри написании скрипта автор мотивировался статьей о хэджировании криптовалют . Для работы с данным скрипом необходима установить дневной таймфрейм. Скрипт " Hedging Cryptocurrency ", по своей сути, является стохастическим осциллятором данных спрэда между ценой (годичной давности) на BTC и равноценным количестве выбранного альткоина. Стоит сразу заметить, что для корректного использования данного скрипта необходима выбирать инструмент вида XXX/USD (где XXX - выбранный альткоин, а USD - стабильный альткоин, привязанный к доллару). В настройках можно включать/выключать сигналы на покупку (зеленые точки) и продажу (красные точки) альткоина. Закрывать сделку можно, когда осциллятор перешагнет нулевую отметку. ВАЖНО, что для хэджирования криптовалют, при открытии сделки на альткоин, необходимо также открыть сделку и на BTC, но уже в обратном направлении. Кроме всего перечисленного сам осциллятор имеет градацию зеленых и красных оттенков, которые говорят об условной перекупленности и перепроданности соответственно. Добавлю, что индикатор чаще ошибается при низкой корреляции между инструментами, поэтому в такие моменты он начинает сигнализировать черными крестиками. В этих ситуациях скрипт не гарантирует ту точность, которую может предложить :-) Само собой данный индикатор только инструмент, а его сигналы не являются абсолютно верными, поэтому с большим удовольствием почитаю в комментариях ваши предложения по его усовершенствованию. Pine Script®指標由dacool731提供1197
Stochastic with Crossover ArrowsNormal stochastic with arrows showing when K crosses DPine Script®指標由Tracks提供已更新 33469
StochRSI 𝝙Enhanced version of StochRSI inspired by my premium RSI Delta script. Check my premium advanced indicators: Pine Script®指標由D7R提供已更新 11834
Strategy JonathanThis script is a request from trader Jonathan. We use Bolinger bands to scan for market extremes.Pine Script®指標由DevLucem提供已更新 3395