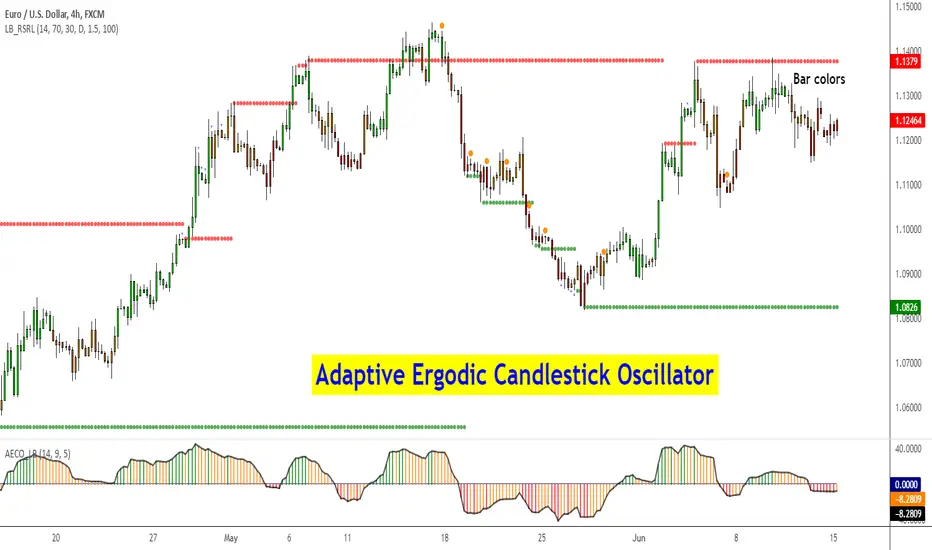
The limitation of max 3 indicators on tradingview is pretty bad for indicators lovers (like me) so i made this script able to contain a rsi, a stochastic and a percent rank and that in only one indicator !! Pretty cool isn't it ? ;) Every parameter is linked to one indicator, you can have all of them with differents period lengths You have the possibility...
Ergodic Oscillator indicator script. Ergodic Oscillator is based on True Strength Index (TSI) by William Blau.
Hey all, Here is my version of the Stochastic RSI Multi-timeframe Grid. I've based the indicator of this one because I loved the idea but never got access. Only one way to go and code my own Stoch RSI ! Grid shows overbought/oversold on multiple timeframes! (D, 4h, 1h, 30m top to bottom) Plots arrows when 30m, 1hour and 4hour are...
Needed an indicator for displaying Stoch RSI's across multiple timeframes. Teal is standard RSI and main graph is Stoch RSI for current timeframe. Cells from top to bottom represent 1D, 2H, 1H, 30min Stoch RSI values, with color code of green for low and black being high. Currently experimenting with different configurations for the arrow indicators at top. The...
Just like the standard Stochastic RSI, this is a MFI(Money Flow) version. The MFI is a Volume Weighted RSI and so this indicator will give that dimension to your technical analysis. It also includes a "midway" line that can be altered if need be. // Created 2018 - by @Squiggles#8806 // LTC Tip Jar: LX4bUBdjiRPsagUbZoAczSGgDC4YqTJL7w
Modification of DMI Stochastic indicator created by USGEARS, as requested by another user. This version just colors columns along with the indicator arrow.
RSI overbought and oversold histogram Just indicator combo of oldschool slow stochastic and rsi, just looking a little bit better for someone. Strategy is simple: 1) RSI is overbought or oversold (above 70, below 30)? 2) Stochastic line crosses its ema? 3) Stochastic and stochastic ema are in overbought = sell, oversold = buy. Works good in volitile stocks/pairs...
This indicator is a combination of the following three slow stochastics commonly used. ⓐ 5 - 3 - 3 ⓑ 10 - 6 - 6 ⓒ 20 - 12 - 12 ( n - %k - %d ) I hope it helps. Thanks. <한국어> 일반적으로 많이 사용하는 다음 3개의 슬로우 스토케스틱을 하나로 합친 지표입니다. ⓐ 5 - 3 - 3 ⓑ 10 - 6 - 6 ⓒ 20 - 12 - 12 ( n - %k - %d ) 도움이 됐으면 좋겠습니다. 감사합니다.
Stochastic Momentum Index indicator script. This indicator was originally developed by William Blau (Stocks & Commodities V. 11:1 (11-18)).
This is a hybrid indicator combining the classic Stochastic Oscillator with the Volume Oscillator.
This is based of a modified stochastic numbers. The settings come from Barry Burn's foundation and advanced courses. There are two stochastic indicators one on top of another. at the same time, you can turn off the lines and show the moving averages of percent D and percent K, this is something I added personally to farther investigate if they can be helpful or...
Standard RSI and Standard Sotchastic in the same study. That's it.
The idea is to create a MACD "Reader" that can tell you when you should buy (yellow candle sticks) and when to Sell (black one) you have also strong signal of with B and S write on graphic automatically. This indicator is set and back tested with BTCUSD and Gold. I used also for french equities and it works really good. Let me know if you want any change or have...
Welcome to my "Plaid" Stochastic / RSI / StochRSI Combo indicator. This shows the Fast and Slow Stochastic (orange and yellow), Relative Strength Index (white), and the Stochastic RSI (purple). As the lines cross the 80/20 and 70/30 lines, the background color changes to make it easy to see at a glance how many of the indicators have crossed their threshold. In...