CoffeeShopCrypto Supertrend Liquidity EngineMost SuperTrend indicators use fixed ATR multipliers that ignore context—forcing traders to constantly tweak settings that rarely adapt well across timeframes or assets.
This Supertrend is a nodd to and a more completion of the work
done by Olivier Seban ( @olivierseban )
This version replaces guesswork with an adaptive factor based on prior session volatility, dynamically adjusting stops to match current conditions. It also introduces liquidity-aware zones, real-time strength histograms, and a visual control panel—making your stoploss smarter, more responsive, and aligned with how the market actually moves.
📏 The Multiplier Problem & Adaptive Factor Solution
Traditional SuperTrend indicators rely on fixed ATR multipliers—often arbitrary numbers like 1.5, 2, or 3. The issue? No logical basis ties these values to actual market conditions. What works on a 5-minute Nasdaq chart fails on a daily EUR/USD chart. Traders spend hours tweaking multipliers per asset, timeframe, or volatility phase—and still end up with stoplosses that are either too tight or too loose. Worse, the market doesn’t care about your setting—it behaves according to underlying volatility, not your parameter.
This version fixes that by automating the multiplier selection entirely. It uses a 4-zone model based on the current ATR relative to the previous session’s ATR, dynamically adjusting the SuperTrend factor to match current volatility. It eliminates guesswork, adapts to the asset and timeframe, and ensures you’re always using a context-aware stoploss—one that evolves with the market instead of fighting it.
ATR EXAMPLE
Let’s say prior session ATR = 2.00
Now suppose current ATR = 0.32
This places us in Zone 1 (Very Low Volatility)
It doesn’t imply "overbought" or "oversold" — it tells you the market is moving very little, which often means:
Lower risk | Smaller stops | Smaller opportunities (and losses)
🔁 Liquidity Zones vs. Arbitrary Pullbacks
The standard SuperTrend stop loss line often looks like price “barely misses it” before continuing its trend. Traders call this "stop hunting," but what’s really happening is liquidity collection—price pulls back into a zone rich in orders before continuing. The problem? The old SuperTrend doesn’t show this zone. It only draws the outer limit, leaving no visual cue for where entries or continuation moves might realistically originate.
This script introduces 2 levels in the Liquidity Zone. One for Support and one for Stophunts, which draw dynamically between the current price and the SuperTrend line. These levels reflect where the market is most likely to revisit before resuming the trend. By visualizing the area just above the Supertrend stop loss, you can anticipate pullbacks, spot ideal re-entries, and avoid premature exits. This bridges the gap between mechanical stoploss logic and real-world liquidity behavior.
⏳ Prior Session ATR vs. Live ATR
Using real-time ATR to determine movement potential is like driving by looking in your rearview mirror. It’s reactive, not predictive. Traders often base decisions on live ATR, unaware that today’s range is still unfolding —creating volatility mismatches between what’s calculated and what actually matters. Since ATR reflects range, calculating it mid-session gives an incomplete and misleading picture of true volatility.
Instead, this system uses the ATR from the previous session , anchoring your volatility assumptions in a fully-formed price structure . It tells you how far price moved in the last full market phase—be it London, New York, or Tokyo—giving you a more reliable gauge of expected range today. This is a smarter way to estimate how far price could move rather than how far it has moved.
The Smoothing function will take the ATR, Support, Resistance, Stophunt Levels, and the Moving Avearage and smooth them by the calculation you choose.
It will also plot a moving average on your chart against closing prices by the smoothing function you choose.
🧭 Scalping vs. Trending Modes
The market moves in at least 4 phases. Trending, Ranging, Consolidation, Distribution.
Every trader has a different style —some scalp low-volatility moves during off-hours, while others ride macro trends across days. The problem with classic SuperTrend? It treats every market condition the same. A fixed system can’t possibly provide proper stoploss spacing for both a fast scalp and a long-term swing. Traders are forced to rebuild their system every time the market changes character or the session shifts.
This version solves that with a simple toggle:
Scalping or Trend Mode . With one switch, it inverts the logic of the adaptive factor to either tighten or loosen your trailing stops. During low-liquidity hours or consolidation phases, Scalping Mode offers snug stoplosses. During expansion or clear directional bias.
Trend Mode lets the trade breathe. This is flexibility built directly into the logic—not something you have to recalibrate manually.
📉 Histogram Oscillator for Move Strength
In legacy indicators, there’s no built-in way to gauge when the move is losing power . Traders rely on price action or momentum indicators to guess if a trend is fading. But this adds clutter, lag, and often contradiction. The classic SuperTrend doesn’t offer insight into how strong or weak the current trend leg is—only whether price has crossed a line.
This version includes a Trending Liquidity Histogram —a histogram that shows whether the liquidity in the SuperTrend zone is expanding or compressing. When the bars weaken or cross toward zero, it signals liquidity exhaustion . This early warning gives you time to prep for reversals or anticipate pullbacks. It even adapts visually depending on your trading mode, showing color-coded signals for scalping vs. trending behavior. It's both a strength gauge and a trade timing tool—built into your stoploss logic.
Histogram in Scalping Mode
Histogram in Trending Mode
📊 Visual Table for Real-Time Clarity
A major issue with custom indicators is opacity —you don’t always know what settings or values are currently being used. Even worse, if your dynamic logic changes mid-trade, you may not notice unless you go digging into the code or logs. This can create confusion, especially for discretionary traders.
This SuperTrend solves it with a clean visual summary table right on your chart. It shows your current ATR value, adaptive multiplier, trailing stop level, and whether a new zone size is active. That means no surprises and no second-guessing—everything important is visible and updated in real-time.
Stophunting

Realtime ATR-Based Stop Loss Numerical OverlayRealtime ATR-Based Stop Loss Numerical Overlay
A simple, effective tool for dynamic risk management based on ATR (Average True Range) without adding cluttered and distracting lines all over your chart.
📌 Description
This script plots a real-time stop loss level using the Average True Range (ATR) on your chart, helping you set consistent, volatility-based stops. It supports both:
✅ Current chart timeframe
✅ Custom fixed timeframe inputs (1m, 5m, 15m, 1h, etc.)
The stop level is calculated as:
Stop = ATR × Multiplier
and updates in real-time. An overlay table displays on the bottom-right of your chart with the calculated stop value in a clean, simple way.
⚙️ Settings
ATR Timeframe Source:
Choose between using the current chart's timeframe or a fixed one (e.g. 5, 15, 60, D, etc).
ATR Length:
Period used to calculate the ATR (default is 14).
Stop Loss Multiplier:
Multiplies the ATR value to define your stop (e.g., 1.5 × ATR).
Wait for Timeframe Closes:
If enabled, the ATR value waits for the selected timeframe’s candle to close before updating. If unselected, it will update in real time.
🛠️ How to Use
Add this script to your chart from your indicators list.
Configure your desired timeframe, ATR length, and multiplier in the settings panel.
Use the value shown in the table overlay as your suggested stop loss distance from entry.
Adjust your position sizing accordingly to fit your risk tolerance.
This tool is especially useful for traders looking for adaptive risk management that evolves with market volatility — whether scalping intraday or swing trading.
💡 Pro Tip
The ATR stop can also be used to dynamically trail your stop behind price movement.

Stophunt WickAcknowledgement
This indicator is dedicated to my friend Alexandru who saved me from one of these liquidation raids which almost liquidated me.
Alexandru is one of the best scalpers out there and he always nails his entries at the tip of these wicks.
This inspired me to create this indicator.
What's a Liquidation Wick?
It's that fast stop-hunting wick that stophunts everyone by triggering their stop-loss and liquidation.
Liquidity is the lifeblood of stock market and liquidation is the process that moves price.
This indicator will identify when a liquidity pool is getting raided to trigger buy or sell stops, they are also know as stop-hunts.
How does it work?
When market consolidates in one direction, it builds up liquidity zones.
Market maker will break out of these consolidation phases by having dramatic price action to either pump or dump to raid these liquidity zones.
This is also called stop-hunts or liquidity raids. After that it will start reversing back to the opposite direction.
This is most noticeable by the length of the wick of a given candle in a very short amount of time and the total size of the candle.
This indicator highlights them accordingly.
Settings
Wick and Candle ratio works with default values but finetune will enhance user experience and usability.
Wick Ratio: Size of the wick compared to body of a candle.
Adjust this to higher ratio on smaller timeframe or smaller ratio on bigger timeframe to your trading style to spot a trend reversal.
Candle Ratio: The size of the candle, by default it is 0.75% of the current price.
For example, if BTC is at 20,000 then the size of the candle has to be minimum 150.
This can be fine tuned to bigger candle size on higher time frames or smaller for shorter timeframe depending on the trade type.
How to use it?
This indicator will identify when a liquidity pool is getting raided to trigger buy or sell stops, they are also know as stop-hunts. It can be used of its own for scalping but there are also a good few indicators which would most definitely help to confluence bigger timeframe trades.
Scalp
This indicator shows the most chaotic moments in price action; therefore it works best on smaller timeframes, ideally 3 or 5 minute candle.
- Wait for the market to start pumping or dumping.
- Current candle will change colour (Bullish/Bearish).
- Enter trade as soon as price starts to reverse back.
- Place the stop-loss outside of the current candle.
- Wait for the Liquidation Wick to appear as confirmation.
Price is very chaotic during a liquidity stop-hunt raid but there is a saying:
"In the midst of chaos, there is also opportunity" - Sun-Tzu
Since this is a very high risk, high reward strategy; it is advised to practice on paper trade first.
Practice until perfection and this indicator would be the perfect bread and butter scalp confirmation.
Fair Value Gap
FVG strategy is the most accurate in conjunction with this indicator.
Normally price would reverse after consuming fair value gaps but often it's difficult to know when and where.
This indicator would identify those crucial entry points for reverse course direction of the price action.
Support and Resistance
This indicator can also be used in conjunction with support and resistance lines.
Generally the stophunt will go deep below the support or spike much further up the resistance lines to liquidate positions.
Bollinger Bands
Bolling Bands strategy would be to wait until the price breaks out of the band.
Once the wick is formed, it would be an ideal entry point.
Script change
This is an open-source script and feel free to modify according to your need and to amplify your existing strategy.

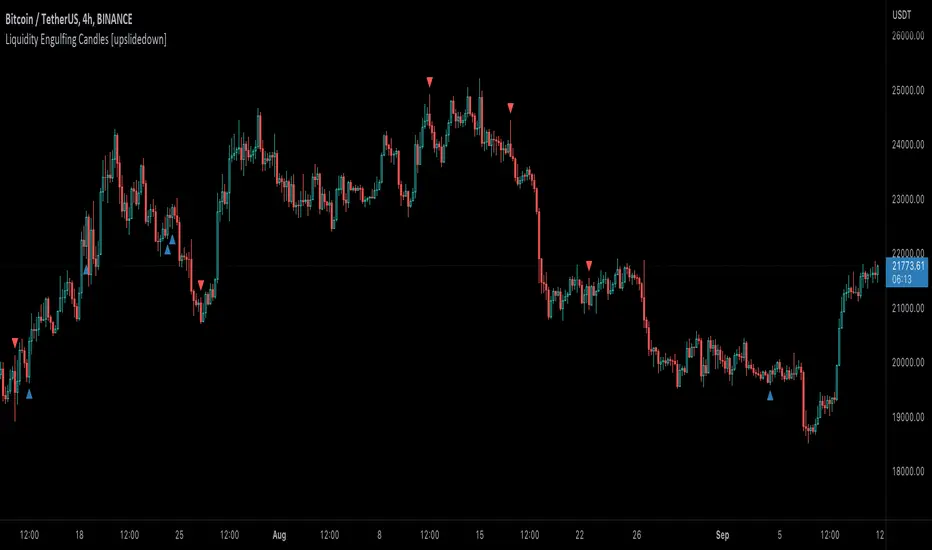
Liquidity Engulfing Candles [upslidedown]Liquidity engulfing candles (LEC) are a variant of a common candlestick pattern: engulfing candles but with a couple extra conditions applied. These conditions expect highs/lows to be taken out in order to show a continuation or reversal signal.
Filter 1: Stop Hunt Wick Filter
This filter requires the candle to wick into the prior candles high or low ( bullish = wick below prior candle lows). This is the stop hunt.
Filter 2: Close Filter
This filter requires the candle to close above or below above the prior candle ( bullish = close above prior candle high). This is the confirmation.
This idea was introduced to me by @attrk632. Thanks, mate!
+ ATR Support and ResistanceThis, a very different script from most of mine, is my attempt at making a useful, and not messy, support and resistance indicator. If you've never looked into trader xkavalis, and his scripts and discord, I would highly recommend it. He talks about "pay attention candles" a lot. It got me thinking about what those are. Best as I can tell all he means by that phrase is large, impulsive candles. Sometimes these lead to break outs of ranges, or they may signal tops, bottoms, or near-tops and bottoms. The only way I could make sense of this in a mathematical way was by using the average true range. Basically, any candle's true range outside of the ATR is considered a "pay attention candle," by my definition.
This script originally began as just a candle coloring exercise with some optional shapes plotted above/below certain candles, but I quickly realized I wanted to draw lines or zones from these candles, so eventually, after many hours spent figuring out and learning 'line.new' and 'box.new' I got things sorted.
Essentially, my line of thinking is that on impulsive candles down, the origin of the impulse is more important than the close (not always of course, as there are no unbreakable rules in what markets can do), and with impulsive candles up, the same theory applies.
So, for upward impulsive candles I've marked out the zone from the open to the low as a support (until broken, in which case it may become resistance). For downward impulsive candles the zone encompasses the open to the high. I've given the option to plot a line from the close for all of these. It's turned off by default as it's just less stuff on the chart, but you may like it.
The line length is customizable in a menu. It does funny things on low timeframes on forex and stock charts (long lines that result in chart compression), but for some reason very rarely on crypto charts. If someone who is smart (not me) and has much experience with pinescript could perhaps help me out with a fix for this, that would be great. I suspect it has something to do with my "bar_index_duration" that I defined using the time function, but I'm not sure how or why.
Line length on time frames of one hour and up it is typically fine.
Use the ATR multiple to change the sensitivity of the indicator. This is basically the determination of when a candle is beyond the ATR. A multiple of two is two times the ATR. With lower volatile pairs you can maybe make this lower. On lower time frames or with more volatile pairs (illiquid alts in particular) a higher multiple might serve better. I find the default 1.75 is mostly acceptable.
As I started this I also thought adding some sort of volume information to the candles might be useful as well, so I added a simple candle coloring feature referencing the OBV and a 21 period EMA. Candles are colored based on the OBV's relation to its moving average.
I added some plot shapes and candle coloring utilizing the RSI as well. Options to turn on or off shapes plotted for overbought and oversold across the top of the chart. The most interesting feature that I implemented here is a support/resistance zone around the centerline of the RSI. If the RSI is between 49 and 51 then you can have optional candle coloring, shapes plotted above the candles, and s/r zones drawn on the chart. In trending markets the centerline of the RSI will frequetly act as support or resistance, so by being alerted of this condition on the chart you can use that with actual levels marked off in order to help make a judgement on a trade. I think it's a nice addition, and an oft overlooked aspect of the usefulness of the RSI.
I've also included a calculation, with candle coloring and/or plot shapes, for something like a stop run on high volume. The calculation for that is in its section below, and should be pretty self explanatory.
Lastly, typing this as I'm posting it, this indicator could also be useful for helping to find placement for trailing a stop. Just a thought!

stop out or margin call price levelsAbstract
This script finds the potential stop out or margin call price levels without considering timeframe.
This script computes stop out or margin call price levels that over leveraged positions buy cheap enough.
You can use this indicator to follow stop hunters.
Introduction
Stop hunting exists because of benefit conflict.
When most of retails traders are in the correct direction, big banks do not want to buy more expensive then retail traders.
Therefore, Big banks create sell pressure to make retail traders misunderstand their trade decisions are wrong.
When retail traders decide to cut loss, it is time big banks buy cheaper.
Many courses recommend average true range as a stop loss reference.
However, in different timeframe, average true ranges are different.
Therefore, we need to have a method to measure potential stop hunting levels which is not relative to timeframe.
There is a method because there are observable levels where over leveraged positions must cut loss.
For example, for a 100 leverage position, its margin call level is 0.005, so 0.005 drawdown is a potential stop hunting level.
Computing
For buy
potential stop out or margin call price level = low * ( 1 - ratio )
For sell
potential stop out or margin call price level = high * ( 1 + ratio )
Parameters
There are 4 levels available for adjusting.
The default values are :
(1) 0.001 : 500 leverage , 50% margin call
(2) 0.0025 : 200 leverage , 50% margin call
(3) 0.005 : 100 leverage , 50% margin call
(4) 0.010 : 50 leverage , 50% margin call
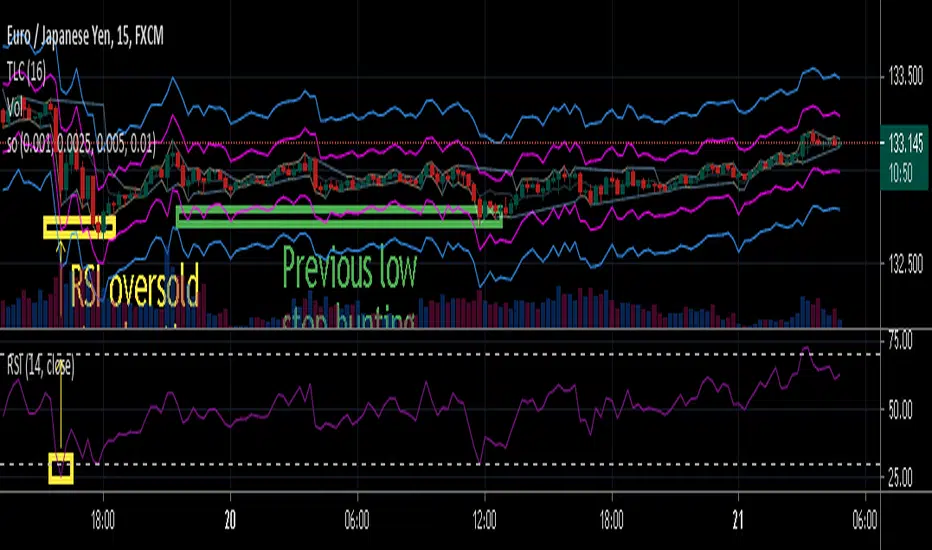
Usage
(1) Find an oversold price level. If you don't want to use an another indicator, you can use previous low.
(2) Memorize their stop out or margin call price levels of that level.
(2) Consider buy near those levels.
(3) If there are quick price rejection near those levels, better entry opportunities.
(4) Take profit and stop loss : you decide.
Conclusion
This script can find potential stop out or margin call price levels that over leveraged positions buy cheap enough.
If you are bored, you can consider find 100 signals you are interested in and share your observation.
Reference
Brokers, leverage and margin call threshold