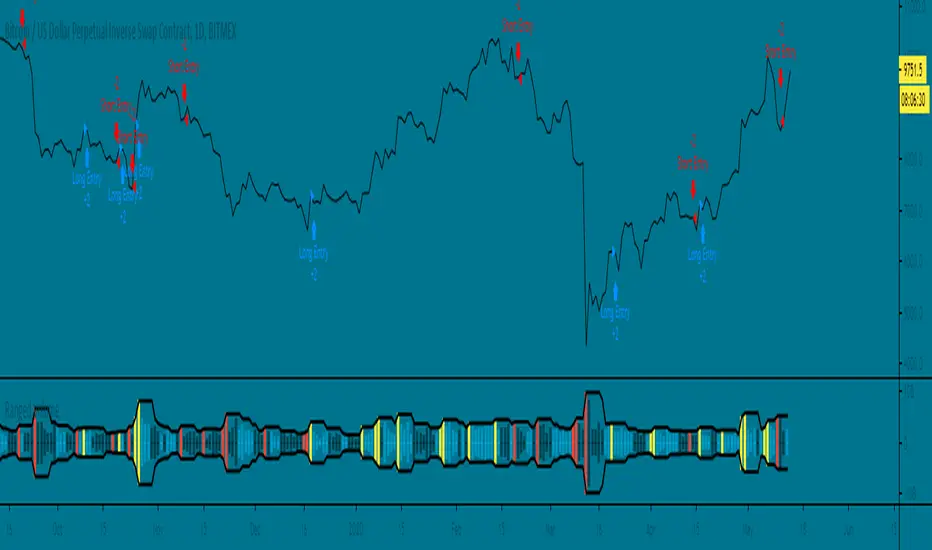
Ranged Volume Strategy - evoThis is the strategy version for the ranged volume indicator I published a few days ago.
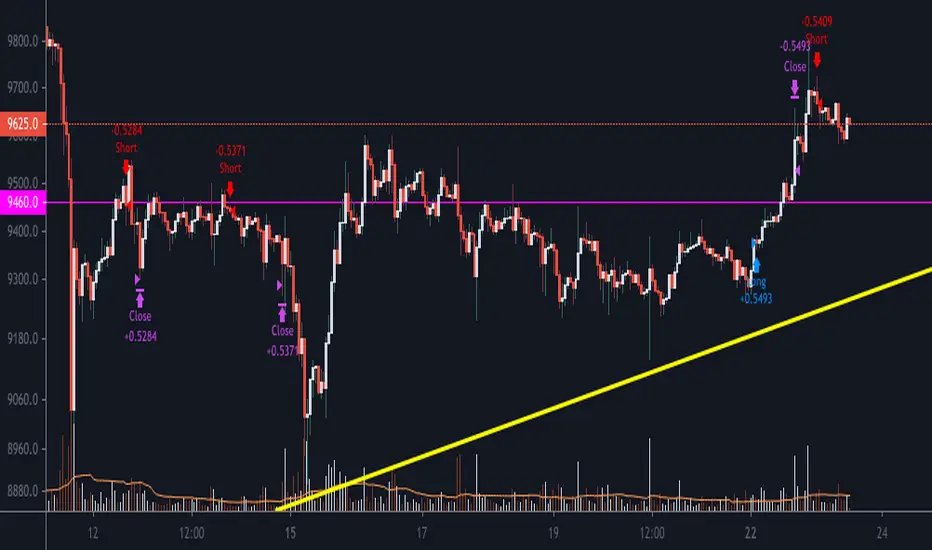
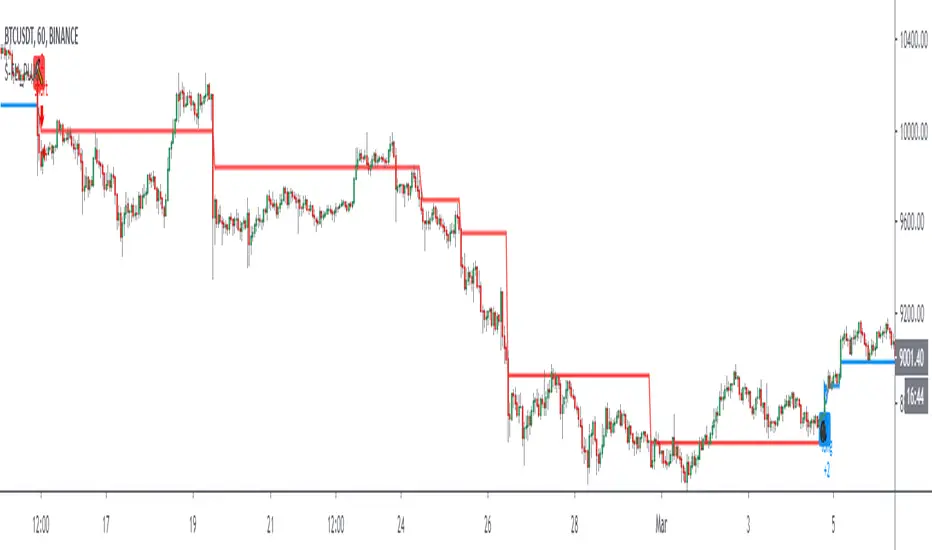
Long : First yellow break-out after red
Short : First red break-out after yellow
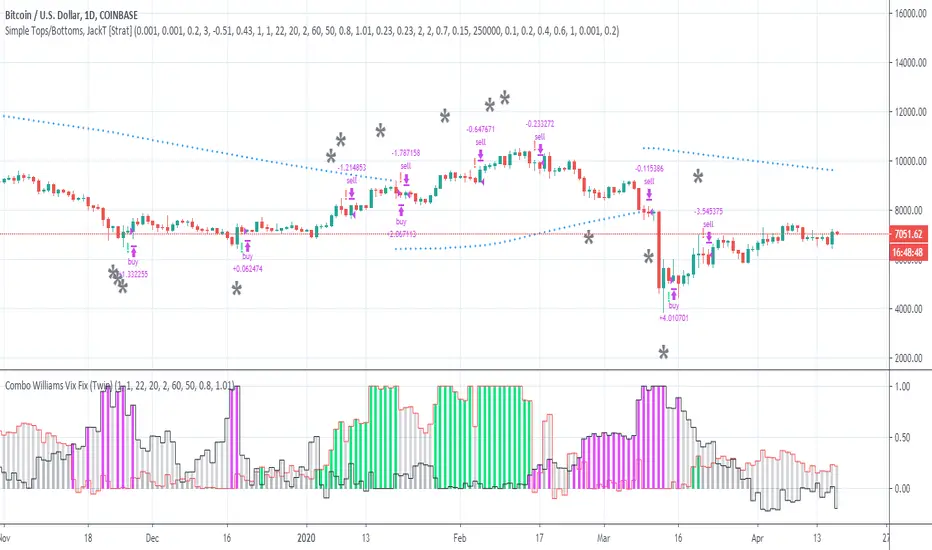
Because this is volume, you want to be using this on an exchange with high volume for the best results. Default settings are not optimized but work great on bitcoins daily chart.
A short explanation of the indicator below:
Pine Script®策略