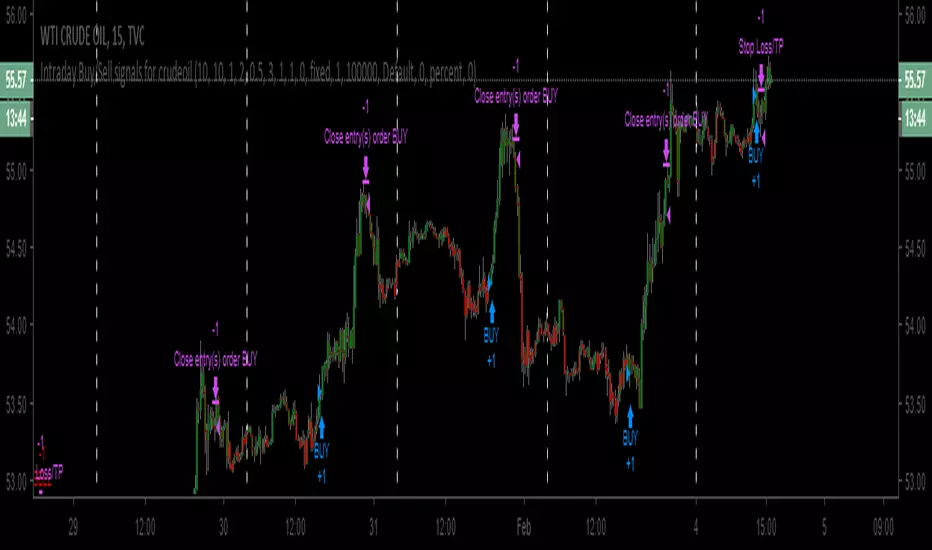
Intraday Buy/Sell signals for CrudeoilHi Everyone,
This is higly tuned intraday Buy/Signal generator for Crudeoil. It works on any time frames below 30 mins. But, the best setting is 15 mins.
How to use:
1. Just, apply this strategy to your crudeoil WTI instrument
2. Set your time frame to 15 mins
3. Buy the instrument whenever buy signal generates / Sell the intrument whenever buy singal generates
4. Strategy itself has 0.5% stop loss generating signals. But, create stop loss of 0.5% after buying/selling the instrument
5. Finally, whenever close signals triggers, just close the trade.
Note: Please try with only one lot at the beginning. If everything goes well after testing, mulitple lot can be used.
Disclaimer:
This strategy is for testing purpose only. Any profit/loss to the user's capitla is subject to market risk. And, the creator of this script is no where responsible.
Strategy!
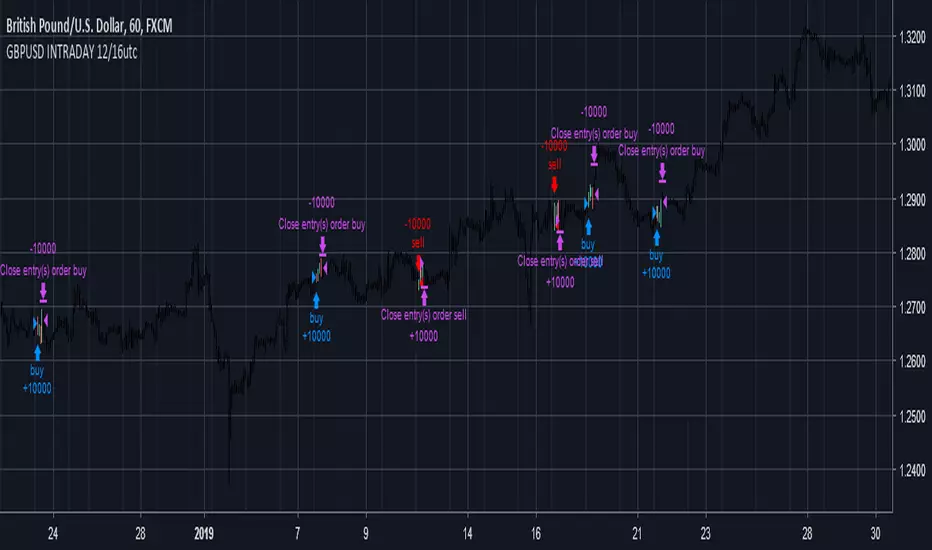
GBPUSD INTRADAY 12/16utcHi guys,
this is my new super easy strategy, on GBPUSD 1 hour chart it gives its best.
12-16utc means: at 12 utc watch the chart to see if to open a position (long or short). If a position has been opened close at 16utc.
So basically you have only to rememeber to check the chart at 12 utc. You can set a SL @50pips, and a TP @100pips, but the strategy runs without them, so feel free to use them or not.
This strategy has an "easy view mode": you can choose wether use it on mobile chart to have a better view. Using "easy view" you will see only the bars in trading session from 12 to 16 utc. Otherwise you can have the reguar chart.
Subscribe for only 20€/month and
Enjoy your Wallet!
Tari
RENKO strategyStandard simple strategy RENKO. Entry on the first reversing bar. No repaints. Caution arrows when price crossing RENKO levels

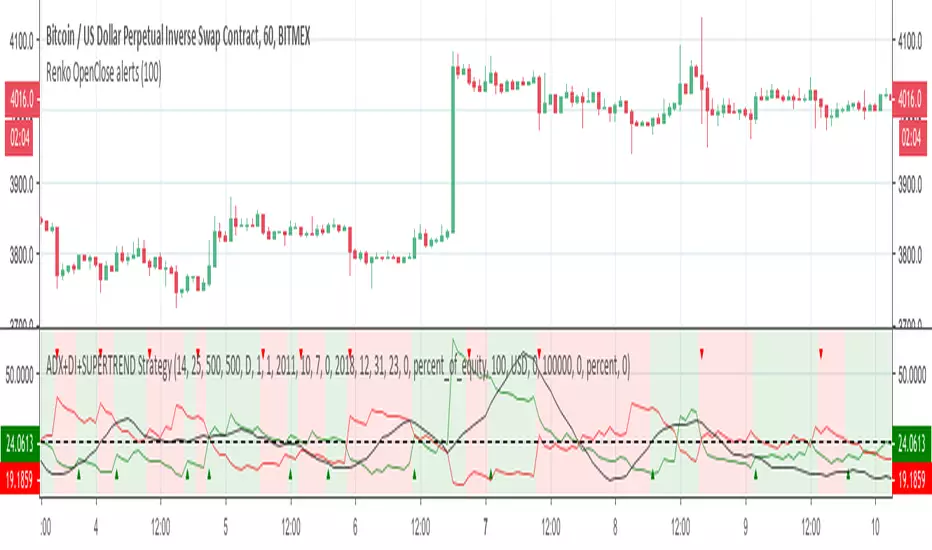
ADX+DI+SUPERTREND StrategyThis strategy is a port of famous script from MasaNakamura ADX and DI.
Here is the exact startegy from original study from MasaNakamura MasaNakamura at
In this version, I added also SUPERTREND as filter!
Scope of this port is to identify corrects inputs to get best results from signals that indicator gives.
I added the possibility to choose stop loss and take profits and to smooth the results also with heikin ashi candles.
Please use comment section for any feedback.
Next improvement (only to whom is interested to this script and follows me): study with alerts on multiple tickers all at one. Leave a comment if you want to have access to study.
********************************** IMPORTANT*******************************
I have developed an expert advisor for metatrader4 (MT4) and for jforex platform: results of expert advisor form 2015-01-01 to 2018-11-25 are very good with low drawdown and good profit.
********************************************************************************
ADX and DI StrategyThis strategy is a port of famous script from MasaNakamura ADX and DI
Original study from MasaNakamura MasaNakamura at
Scope of this port is to identify corrects inputs to get best results from signals that indicator gives.
I added the possibility to choose stop loss and take profits and to smooth the results also with heikin ashi candles.
Please use comment section for any feedback.
Next improvement (only to whom is interested to this script and follows me): study with alerts on multiple tickers all at one. Leave a comment if you want to have access to study.
********************************** IMPORTANT*******************************
I have developed an expert advisor for metatrader4 (MT4) and for jforex platform: results of expert advisor form 2015-01-01 to 2018-11-25 are very good with low drawdown and good profit.
********************************************************************************

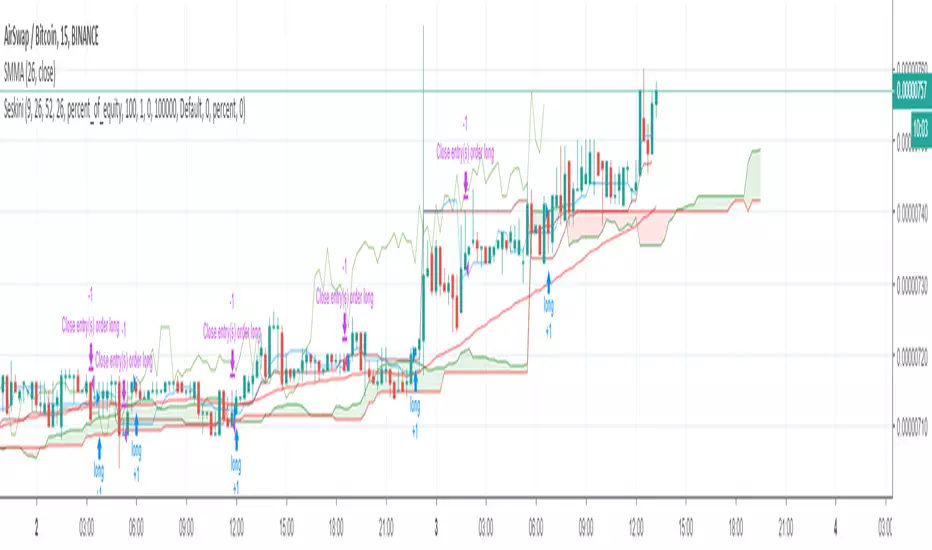
Smooth StrategyThis strategy utilizes a smoothed moving average to identify the current trend on the resolution being viewed. The trend is also the signal for entries and occasional exits. The majority of exits will be determined using an additional smoothed moving average of shorter length. There is much more to come for this one, but it seems to be working fantastically in it's current state. Please let me know if you have any questions or recommendations. Thanks for checking it out! :D
**Donations gladly accepted!**
BTC: 3BD2XayQThb7xpm3oaoatFSaXvGp2eKZKv
ETH: 0x9aEcD18a3d6b2f4b4DE04Bf0d05C587F6512f814
LTC: ltc1q4ens854grkpvgutxgelheju3ug99hjxhg0trxf
KMD: RSgTKS911YA2WbFPkBjho2Y3EntyVzkgcj

Powerfull strategy MACD+RSI+STOCH ATR stop best on Crude OilMy strategy uses a combination of three indicators MACD Stochastic RSI .
The Idea is to buy when ( MACD > Signal and RSI > 50 and Stochastic > 50) occures at the same time the BUY STop we place on previous day HIGH
and sell (short) when the opposite condition occurs we place SELL STOP on previous day LOW
We exit on Take profit or Stop loss which is calculated by ATR (10) or on the opposite signal "Volatility breakout"
This strategy works well on stocks, commodities and cryptos especially during market breaking up after consolidation
The best results are on Daily charts , so its NOT a scalping strategy. But it can work also on 1H charts.
The strategy does not have any stops and profit targets, so we can take all the market can give us at the moment.
The exit point only when MACD goes under Signal
Its Preformance is significantly better with "buy stop on High.1 and sell stop on Low.1" idea and exit on "volatility price breakout"
So, use it, trade it.
If it will help you to imprive your trading results, please donate me
BTC: 12kd1F8buWisUBdq27BBwRkUvzW7Ey3og

Rainbow MA10 with Signal Strategy Version by letsplayantsRainbow MA10 with Signal Strategy Version
Just One for Man.

Powerfull strategy MACD + RSI + Stoch buy on High exit on ATRMy strategy uses a combination of three indicators MACD Stochastic RSI .
The Idea is to buy when ( MACD > Signal and RSI > 50 and Stochastic > 50) occures at the same time the BUY STop we place on previous day HIGH
We exit on Take profit or Stop loss which is calculated by ATR (10) or on the opposite signal "Volatility breakout"
This strategy works well on stocks, commodities and cryptos especially during market breaking up after consolidation
The best results are on Daily charts , so its NOT a scalping strategy. But it can work also on 1H charts.
The strategy does not have any stops and profit targets, so we can take all the market can give us at the moment.
The exit point only when MACD goes under Signal
Its Preformance is significantly better with "buy stop on High.1" idea and exit on "volatility price breakout"
So, use it, trade it.
If it will help you to imprive your trading results, please donate me
BTC: 12kd1F8buWisUBdq27BBwRkUvzW7Ey3og5

Failure Swing Strategy (stop hunting) V1 (Made on XBT/USD 4h Bitmex)
This strategy is a first attempt to countertrade the false break of a key support/resistance.
If a candle breaks the level, but it comes back before close, it will trigger an order.
The Stop Loss is in %, the Take Profit is near the EMA.
There is a "volatility filter" to block orders when the price is near the EMA and a coefficient to adjust a little the Stop Loss and Take Profit according to the chart condition.

BTCUSD PRO STRATEGYThese are the results calculated automatically by the tradingview system within a year. With an initial $ 5,000 investment and always reinvesting 100% of the capital. Taking in count that each open transaction has a cost of 0.2% on the total order placed on the market.
Strategy NO REPAINT.
Write me in private chat on Tradinview to my MaxZanotelli profile for a free 7-day trial period.
Best setup
dema fast 17
dema slow 9
resolution 2h

Oscillator Strategy for Scalping (BITMEX Swaps btc + eth)This is short selling strategy for BITMEX's XBTUSD and ETHUSD swaps scalping.
Made specifically for 3M XBTUSD and 3M-5M ETHUSD timeframe trading.
Not gonna open all the details, but it works mostly on bear divergences and moving averages.
On premium it shows 10000 bars back on 3minute timeframe and over that period(3 weeks aprox) XBTUSD had 28 trades and ETHUSD had 25(+17 on 5M timeframe) trades with that strategy.
How to trade it and setups that i use for manual trading:
1: You can use it to confirm your bias. Sell signal appears + price tries to retake previous resistance = most likely it will fail.
2. Sell signal after wick up suggests that you are likely to get filled at the top.
Your main target should be this moving average. Basically sell signal appears at resistance/near one and moving average represents current line of support. So when you enter short you should be eyeing this MA as your exit/target. Yes, there is a good possibility that support wount hold and this is a bear market we talking about BUT it is 3M bot oriented trading strategy, dont forget about and dont hold for too long to find yourself with price lending on MA and jumping from it.
This strategy does not have a defined stop, rather it suggests you to calculate it based on entry (provided) and target (provided).
Here is what i usually do to calculate my risks. My reward is a move to line of support, my stop is usually 1R, winrate is much higher than 50% so i feel good about it. Entry either at sell signal or at wick. Wicks not always get runned, but they provide incredible r/r setups.
Free trial for 36 hours for this one.

GRID RELOADED 1.0Script for grid trading on Bitmex XBTUSD 5min
A quick description for the input parameters. I can detail privately the ones that are important:
Points between two same dir trades = how much the price must change before a new DCA can happen
Points between SHORTS = same for short trades
Global Take Profit points = take profit for all open positions expressed in the same units as the price
Global Stop Loss points = same as for profit
Take Profit points decrease per bar = this is how much the target global profit decreases each bar toward zero
Trend up to start a trade long = wait for the DEMA to show a long slope before opening new long positions
Max long position = max n. of long positions
Check trend on trade = wait for a positive/negative bar before long/short
Min Stochastic overbought/sold for trade = wait for the stochastic to be below/above this before long/short
Limit Orders long % below close price = place limit orders % before current price. the order could be left pending.
DEMA 1 Length = periods of DEMA for trends
HA Candles = toggle a pattern match to enter trades

Oscillator Based Scalping (Forex Majors)This is a scalping strategy based on oscillator divergences.
Tested on ForexICE market data.
Signal might appear and disappear during candle making since it is based on Moving Average and therefore acts on close, but since candle closed signal is final and does not repaint.
1M timeframes is recommended for bot trading. 5M-15M is more suitable for manual trading.
Full list of tested intraday timeframes below:
EUR-USD - 1M-5M-15M
USD-JPY - 1M-5M
GBP-USD - 1M
AUD-USD - 1M-5M-15M
USD-CHF - 1M-15M
NZD-USD - 1M-5M-15M
USD-CAD - 1M-5M
There is 2 more similar trading strategies that im finishing now, 1 for BITMEX ETHUSD and XBTUSD contracts, and 1 for bitmex alts. Should be ready in a day or two.
Additional notes on executing trades:
-Trade should be entered as close to sell signal as possible. You can enter at market at red circle candle or at limit at top of sell signal candle. In both cases your target is red Moving Average and entering at market just makes overall R/R for a trade is lower yet limit order might not always get filled.
-This strategy doesnt have a defined stop loss by itself, but your target is a moving average and 1-1 risk reward should be enough. Although the win rate is much higher than 50% so you can be less greedy if you feel like playing it safer.
-Strategy itself uses pyramiding, so i would recommend averaging up if you get 2-3 consecutive sell signals above moving average.
-It is assumed that you have OANDA spread rates or better.
-- Free trial for 24 hours. Contact me here or at twitter.com --

Cyatophilum Ichimoku Small TimeFrames [BACKTEST]A script for daytraders trading small timeframes.
Currently in developpement.
If you want to try it send me a PM, and give a like to receive updates.


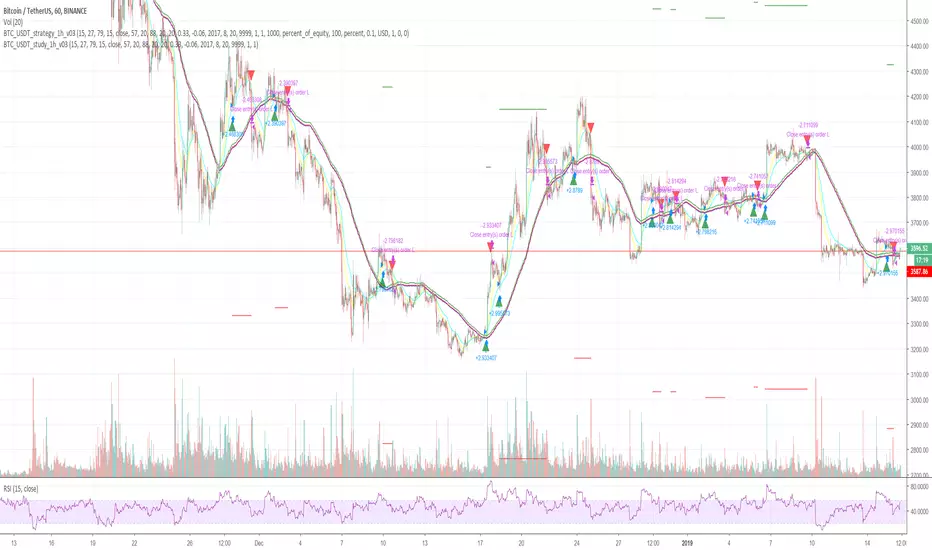
Cryptocurrency trend following LONG only strategyThis strategy uses multiple indicators to find optimal time to enter/exit the trade. The default setting is mainly for trading bitcoin/stable coin pair such as USDT etc on 1h timeframe but it can be applied to any pair/any timeframe with some settings adjustments.
Strategy settings description:
ID Name Descrption
1 FastMA - Value for fast exponencial moving average
2 SlowEMA - Value for slow exponencial moving average
3 SMA - Value for simple moving average
4 RSI Length - Length of RSI identificator
5 RSI Source candle - What price of candle is used for RSI calculation (open, close, high, low)
6 RSI Long condition - When buy, RSI indicator must be below this value to prevent of buying already overbought coin
7 RSI Short condition - When sell, RSI indicator must be above this value to prevent of selling already oversold coin
8 RSI close trade condition - Sell once RSI indicator acquires defined value
9 Take Profit (%) - Take profit value in percent
10 Stop Loss (%) - Stop loss value in percent
11 Long price toleration (%) - Price deviation for filtering bounces of simple moving average - price must close defined percents above SMA to open long trade
12 Short price toleration (%) - Price deviation for filtering bounces of simple moving average - price must close defined percents bellow SMA to close long trade
13 From Year - To run strategy in interval
14 From Month - To run strategy in interval
15 From Day - To run strategy in interval
16 To Year - To run strategy in interval
17 To Month - To run strategy in interval
18 To Day - To run strategy in interval
19 Show every signal? - (Study only) Unchecked shows only first signal based on strategy. But if you use take profit/stoploss settings within your bot, you might want to rebuy on next signal. Checked shows signal on each candle.
Notice that there are also false signals, especially when the coin is not trending or is strongly manipulated. Overall strategy is profitable though. You just take some minor loses and wont miss the big move.
You may also consider to compare buy&hold return vs profit from trading this strategy. In downtrend as we have seen recently, profit may not be as high as you expect but it is still much better than just hold and hope.
You can use the strategy script for fine tunning settings and find best settings for yourself
Study script helps you to automate trading with use of alerts perharps with 3commas bot or even trade manually based on email/sms notification setted by tradingview
Make sure that you keep same settings for strategy and study scripts.
If you need any help with settings do not hesitate to ask. I would also appriciate any feedback and ideas how to improve this script.
Here is backtest result from 23.08.2017:

Heize Signal V3헤이즈 시그널의 버전3인 "채널 전략"입니다. 헤이즈 시그널 버전 1과 같이 사용하면 하루에 진입 기회가 30번정도 나오게 됩니다.
15틱 익절/35틱 손절이였을때 아래의 수익과 승률, 최대손실폭을 확인해주시기 바랍니다.
수수료 전부 포함한 값입니다. (승률이 높기 때문에 리스크:보상 비율이 낮아도 이기는 전략이 됩니다.)
손절틱과 익절틱을 사용해 뇌동을 방지하며 매매할 수 있습니다.
imgur.com
감사합니다.
--------------------------------------------------------------------------------------------------------------------------------------
The version 3 of Heize Signal Strategy is now available. You can use it with version 1 to get more than 30 profitable entries in a day.
It is set to 15 pips for TP, 35 pips for SL. (The win rate is high enough to cover low R:R).
Please check profits/win rate/max drawdowns below. Commission is set to $3 per trades.
Thanks.
지표 체험과 문의는 개인 메세지로 주시면 되겠습니다.
PM me for trials/access.

[New series!] [Consistent Losing Strategies] 34 EMA Scalping//---------------------------INTRO------------------------------
Hi All!
Let me introduce myself as a semi-successful forex trader & lover of automation.
I've taken to algo trading and have been hunting down strategies (that usually use indicators) to automate, backtest, and hopefully implement in MT4.
Unfortunately, most strategies are complete bulls*** and the select cases that are shown to "prove" success are limited.
These strategy sources often do not provide useful analytics either.
I want to change that approach to trading! We can really benefit each other and the community by being methodical about backtesting
as well as evaluating our results with some kind of scoring heuristic.
As for what that standardized process looks like..well I'm still working on it.
I'm pretty much on Tv for multiple hours of the day, screening strategies via Pinescript and I'd like to start sharing my progress!
This is a new series I'd like to start on consistently losing strategies. I'll make all the code public, so if you think I've made a blunder
or approached a problem the wrong way, then drop me a DM or paste your fix into the comments.
//---------------------------STRAT------------------------------
34 EMA Scalping strategy (ref. forextradingstrategies4u )
How you're supposed to trade it:
BUY:
1. Market is in an down trend as shown by the 34 EMA
2. Price breaks above a downwards trend line
3. Price breaks above the 34 EMA
4. Look for a very bullish candlestick or chart pattern
SELL:
1. Look for the 34 EMA to show we are in an uptrend
2. Price breaks below an upwards sloping trend line
3. Price breaks below 34 EMA
4. Look for a bearish candlestick or a chart pattern
//---------------------------CONC------------------------------
Q: Why does it fail?
A: I believe this strategy relies too much on subjective input (aka, trendlines).
Q: Why does it fail as an algo?
A: The 34 EMA is no more predictive than any other EMA, although it does a good job at filtering out noise.
Q: Should I try it out?
A: No, it's trash. This is the proof that it is trash.

Heize Signal--Scalp Trades 안녕하세요 헤이즈입니다.
제 스크립트인 Trend Helper 기반으로 전략을 만들어보고 백테스팅을 했습니다.
스크립트는 5틱 익절로 설정이 되어있고
계약당 수수료 편도 3불로 1000불을 시작금액으로 시작했을때
승률 91.79%, 2주에 45%나 수익이 날 수 있습니다. 1계약으로요. 당연히 리페인팅 없는 지표입니다.
5틱이라도 하루에 10번정도 자리가 나와
5틱=25000원이니 100만원 시작으로 하루에 25만원을 벌 수 있게 됩니다.
더욱 더 재미난것은 이것은 지표 세계에서 가장 백테스팅 승률이 잘 나오기 힘든 1분봉에서 나왔다는 점입니다.
확실히 비트코인(스캠)보다는 차트가 더 잘 맞는다는것을 확인하실 수 있습니다.
차트를 보시다시피 Trend Helper 기반이라(초록색=상승추세 시작, 빨간색=하락추세 시작) 시그널이 나온 후 원웨이로 추세를 따라 올라가고 내려가는 경향이 큽니다. 따라서 5틱 익절만이 아니라 본인 차트대로 저항/지지 구간에서 익절하시면 45%보다 훨씬 크게 익절할 수 있습니다.
imgur.com
(TP 설정을 안하면 1921%--100틱 이상 먹는 자리들이 꽤나 많습니다. 하지만 그만큼 승률이 떨어지고 최대손실폭이 늘어납니다.)
도움이 되었다면 좋겠습니다 :)
___________________________________________________________________
Hello. This is Heize.
I made a strategy and did a back-testing based on my script--"Trend Helper."
The strategy is set to 5 pips for TP , commission as 3$ per trades($3 for going in, $3 for going out), $1000 for starting balance.
The result came out to be 91.79% win rate, and you can have 45% profit in 2 weeks with only 1 contract size.
5pips in NASDAQ is $25, and as the strategy gives about 10 signals per day, you can earn $250 per day with $1000 ideally.
Of course, there is NO REPAINTING.
More interestingly, this result is hard to believe as it came from 1-min chart, which is known to be very difficult to get a good back-testing result.
As you can see, because the strategy is based on "Trend Helper," you don't really have to take profit after 5 pips, as the price tends to continue to follow the "trend" it predicted(green for uptrend, red for downtrend).
imgur.com
(If you don't set TP as 5 pips, the strategy gives you 1921% profit--as it will give you 100+pips trades. However, you'll get lower win rate, and higher max drawdowns.)
I hope this helps :)
-3일 체험/ 사용 원하시면 트레이딩뷰 닉네임과 함께 메세지 주시면 됩니다.
-PM me if you are interested in trial/access.


Ichimoku Cloud - AppachaniSimple Ichimoku Strategy Build for Zenbot - Kumo Breakouts and Tenkan Kijun Crossover for Signals
Thank You - Amal Appachan Abraham for your inspiration