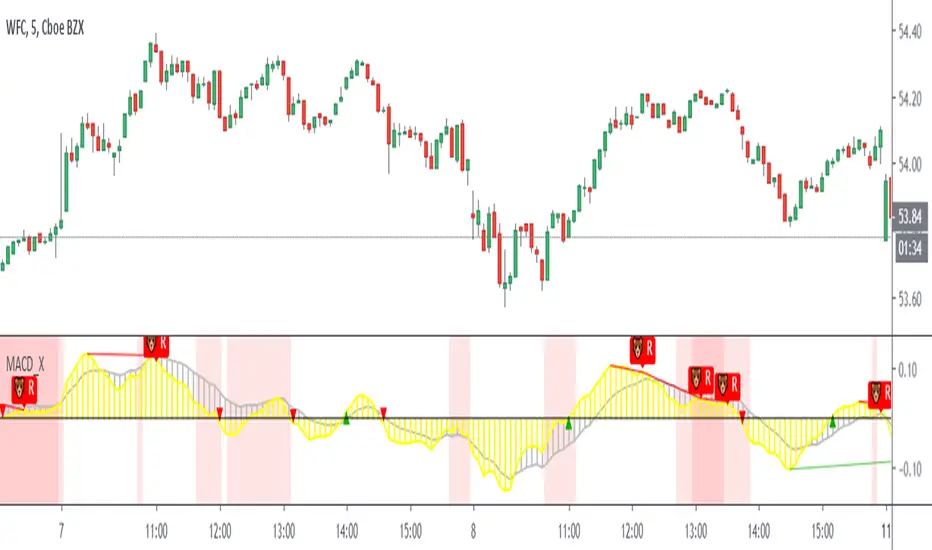
Double MACD Buy and SellIndicator for strategy that was used in a Forex competition and was a winner. Use double MACD with custom settings, search video on YouTube:
Learn Five Powerful MACD Trading Strategies
Add some tools to analyze the market context a little more:
- Detector of regular and hidden divergences.
- Atlas Zone (detects consolidation that is about to generate a movement)
- Choppines zone configurable (detects if the market is stable or not)
Visualization of entries in trend and counter-trend according to the rules described in the video.
Buy and sell alerts.
Note: I do not recommend using only this indicator as an investment strategy, it is another tool that must be complemented with a market study by the trader.
Strategy!
Combo Strategy 123 Reversal & Confluence This is combo strategies for get a cumulative signal.
First strategy
This System was created from the Book "How I Tripled My Money In The
Futures Market" by Ulf Jensen, Page 183. This is reverse type of strategies.
The strategy buys at market, if close price is higher than the previous close
during 2 days and the meaning of 9-days Stochastic Slow Oscillator is lower than 50.
The strategy sells at market, if close price is lower than the previous close price
during 2 days and the meaning of 9-days Stochastic Fast Oscillator is higher than 50.
Second strategy
This is modified version of Dale Legan's "Confluence" indicator written by Gary Fritz.
================================================================
Here is Gary`s commentary:
Since the Confluence indicator returned several "states" (bull, bear, grey, and zero),
he modified the return value a bit:
-9 to -1 = Bearish
-0.9 to 0.9 = "grey" (and zero)
1 to 9 = Bullish
The "grey" range corresponds to the "grey" values plotted by Dale's indicator, but
they're divided by 10.
WARNING:
- For purpose educate only
- This script to change bars colors.
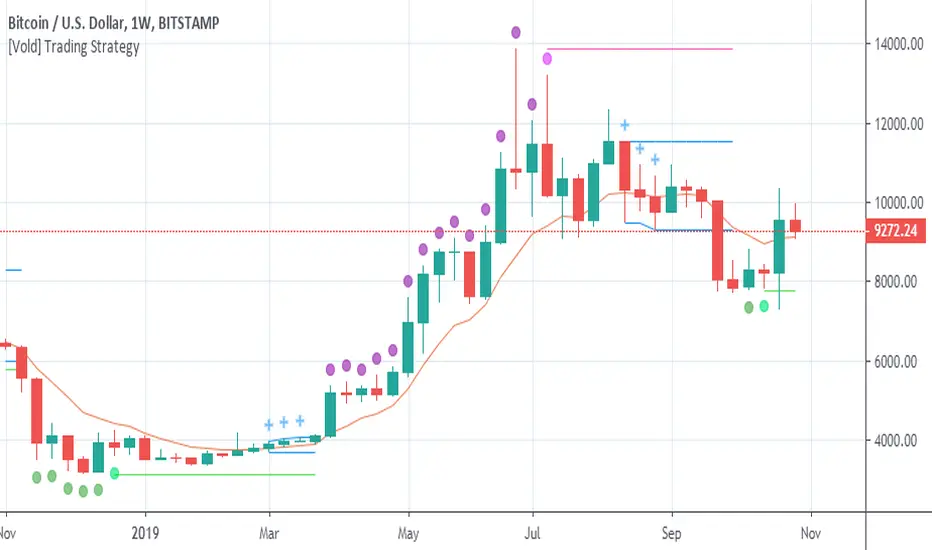
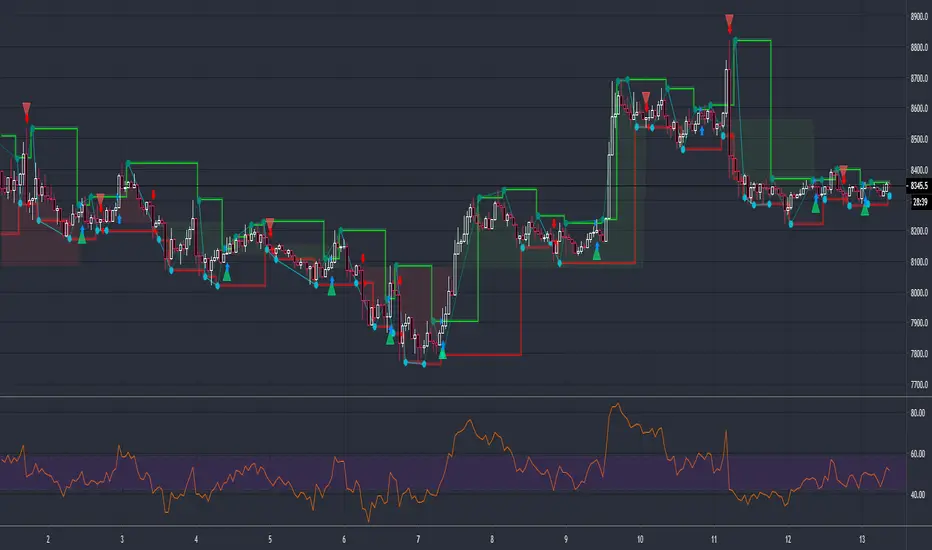
[Vold] Trading StrategyGreen dot = Trending down.
Purple dot = Trending up.
Fuchsia dot = Uptrend ended.
Lime dot = Downtrend ended.
Fuchsia line = The highest value of the last trend (breaking it up means continuation.
Lime line = Idem fuchsia line but to the downside.
Blue crosses = Could be different things: 1. A dip to buy, 2. A rally to sell, 3. Building a range ...
Blue range = Depending on the direction it breaks, is the next direction.
Golden line = Candles above favour uptrends, Candles below favour downtrends, also works as support and resistance .
This trading strategy can be traded very mechanically (see this experiment here: www.tradingview.com)
But I don't advice to do that, use it along with other indicators to make better decisions ( RSI for example) or volume of the trends and the end of them. Also, you can use higher timeframes to understand better the context.
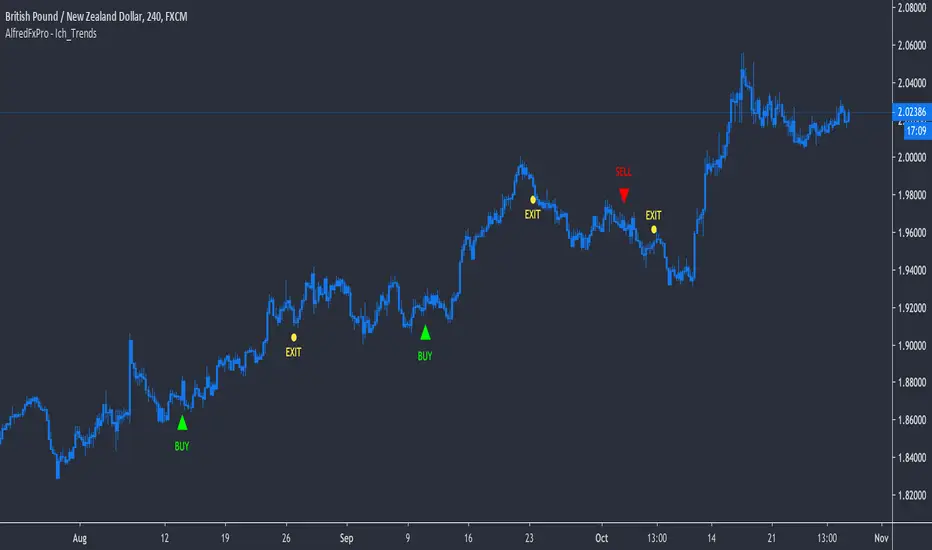
AlfredFxPro - Ichimoku_Trends_AlertsOur powerful Ichimoku Trend Following Scalping Indicator now with LIVE Alerts ( Buy, Sell, Exit Buy, Exit Sell) straight to your PC + Mobile.
*** NO REPAINT *** What you see is what you get. It will fire a signal as soon as the bar close
The (AlfredFxPro - Ich_Trends) uses one element of the famous Ichimoku and combine the signal with two custom volatility indicators to predict potential trends and determine the strength of the trend to keep you in as long as the trend is running or get you out as soon as possible with min loss.
Combine the signal with price action breakout patterns and you have a solid indicator.
It's a very powerful tool to add to your analysis, and make it your own.
**Try on Demo First**
Works best on high volatility instruments
Works on All Assets ( Forex, Crypto, Commodities , Gold , Stocks)
Suggested Timeframes (15min, 30min, 1Hr, 4Hr, D)
*************************
Send us a message for Access!
THIS INDICATOR IS PRIVATE & AVAILABLE FOR MEMBERS ONLY!
**************************
How to Set Alerts :
**Example Buy Signal Alert
-> Go to GBP/NZD 4Hr Timeframe
-> Click Add new Alert
-> Condition -> Select : AlfredFxPro - Ich_Trends
-> Select : Buy Alert
-> Option : Once Per Bar Close
-> Notify on App + POP Up
-> Message: Write: ""Buy 4Hr""
-------------------------------------------
**Example Exit Buy Signal Alert
-> Go to GBP/NZD 4Hr Timeframe
-> Click Add new Alert
-> Condition -> Select : AlfredFxPro - Ich_Trends
-> Select : Long Exit Alert
-> Option : Once Per Bar Close
-> Notify on App + POP Up
-> Message: Write : ""Exit Buy 4Hr""
-------------------------------------------
You repeat the same process for "Sell, and Exit Sell" for any pair on any timeframe you want.
-------------------------------------------
**********Important***********
1) Enter on a Buy and Exit from the same time frame don't mix signals from time frames ( Treat each time frame as an individual trade).
2) Important to set the Alert option: ""Once Per Bar Close"", otherwise you'll get wrong signals.
*************************
Send us a message for Access!
THIS INDICATOR IS PRIVATE & AVAILABLE FOR MEMBERS ONLY!
**************************
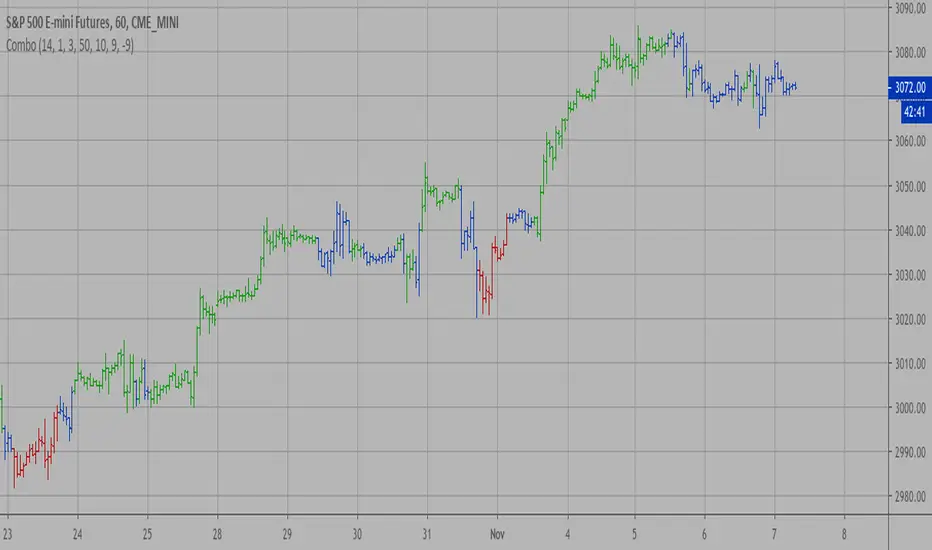
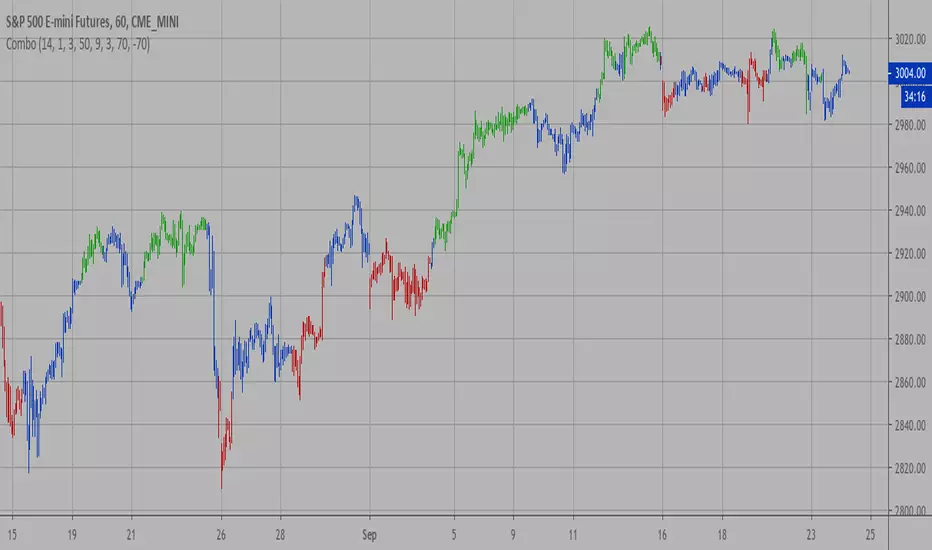
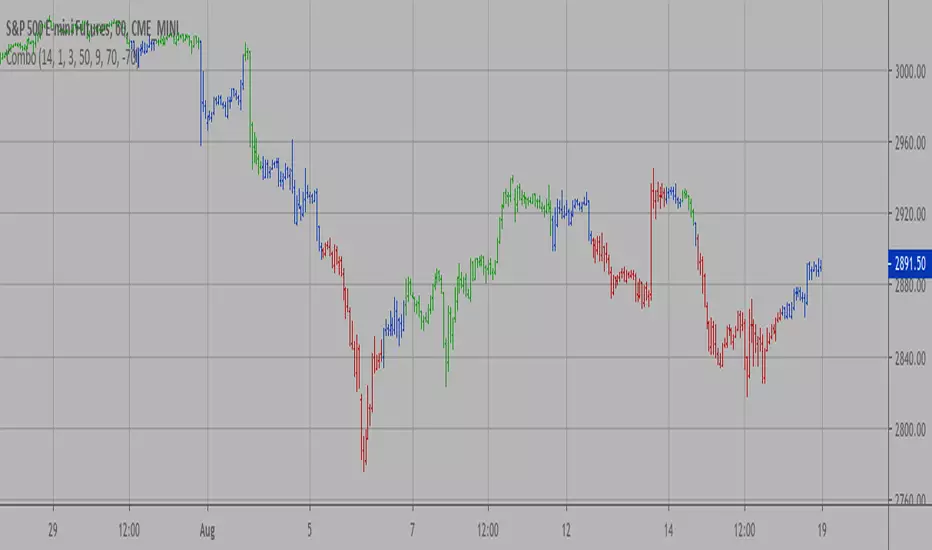
Combo Strategy 123 Reversal & Comparative Relative Strength This is combo strategies for get a cumulative signal.
First strategy
This System was created from the Book "How I Tripled My Money In The
Futures Market" by Ulf Jensen, Page 183. This is reverse type of strategies.
The strategy buys at market, if close price is higher than the previous close
during 2 days and the meaning of 9-days Stochastic Slow Oscillator is lower than 50.
The strategy sells at market, if close price is lower than the previous close price
during 2 days and the meaning of 9-days Stochastic Fast Oscillator is higher than 50.
Second strategy
Comparative Relative Strength Strategy for ES
WARNING:
- For purpose educate only
- This script to change bars colors.

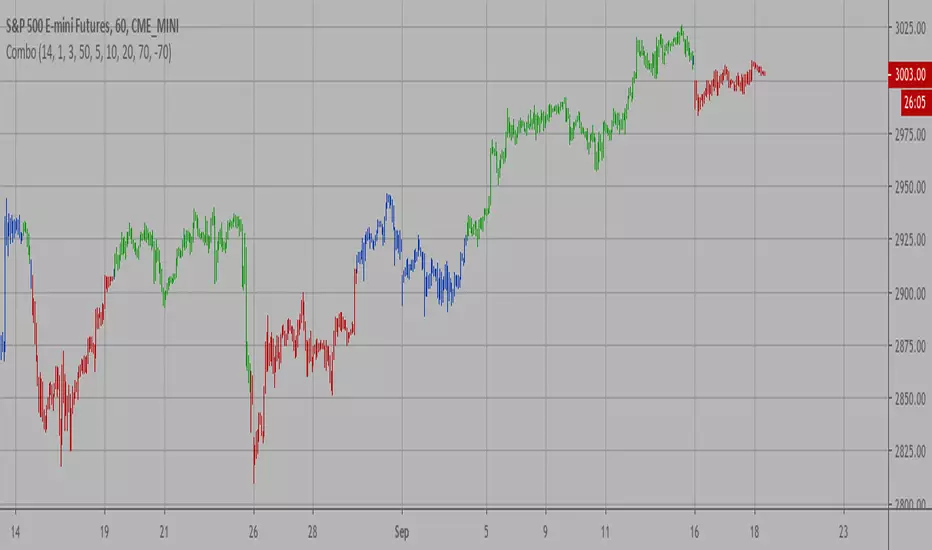
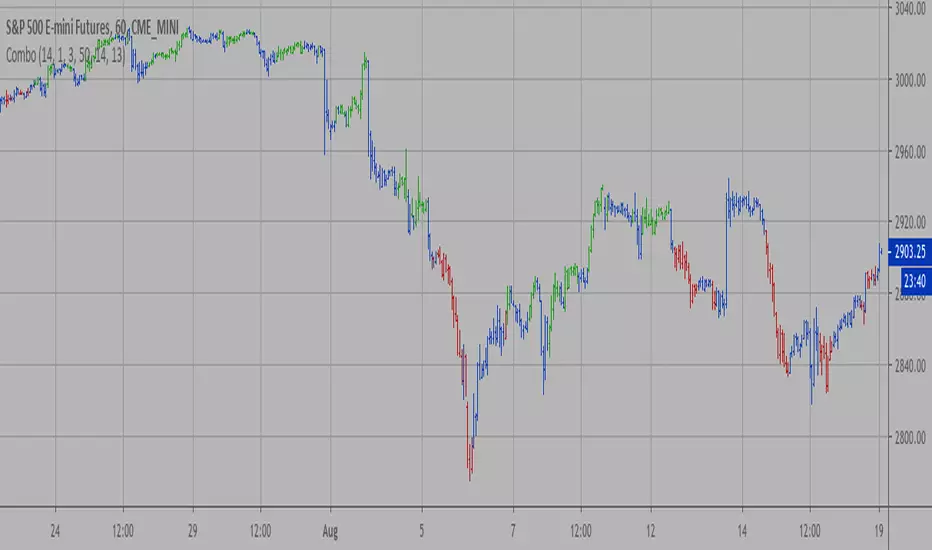
Combo Strategy 123 Reversal & DMI & Moving Average This is combo strategies for get a cumulative signal.
First strategy
This System was created from the Book "How I Tripled My Money In The
Futures Market" by Ulf Jensen, Page 183. This is reverse type of strategies.
The strategy buys at market, if close price is higher than the previous close
during 2 days and the meaning of 9-days Stochastic Slow Oscillator is lower than 50.
The strategy sells at market, if close price is lower than the previous close price
during 2 days and the meaning of 9-days Stochastic Fast Oscillator is higher than 50.
Second strategy
The related article is copyrighted material from Stocks & Commodities Aug 2009
Combining DMI And Moving Average Trading System
WARNING:
- For purpose educate only
- This script to change bars colors.

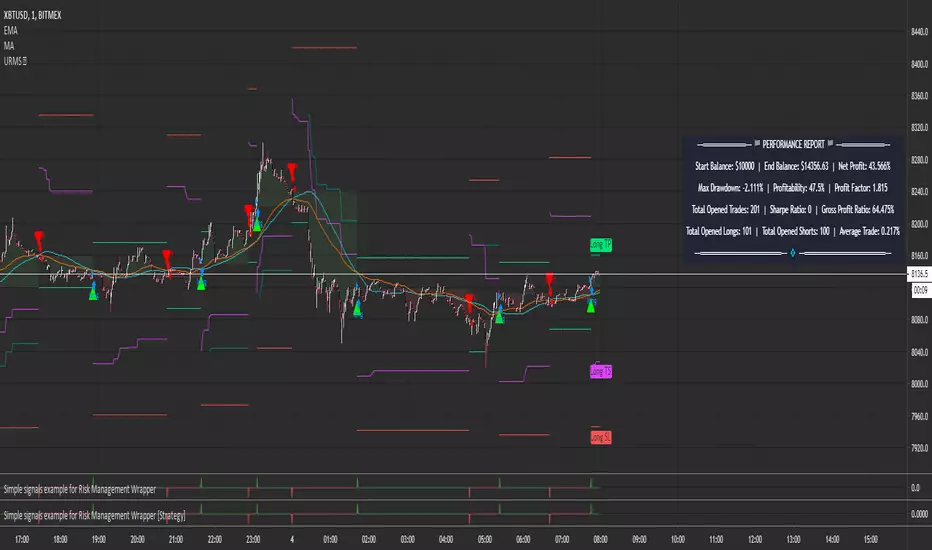
Pivot Reversal Strategy + RSIPivot Reversal Strategy + RSI
A modified version of the standard PRS with an RSI overbought/oversold filter
Comment/uncomment "Study/Strategy" to easily switch to strategy() mode
As long as it is used in the study() version, the indicator is compatible with the Risk Management Wrapper
Separate Alerts for Buy & Sell signals
Single Alert for both Buy & Sell signals - it can also be used by another indicator as a source
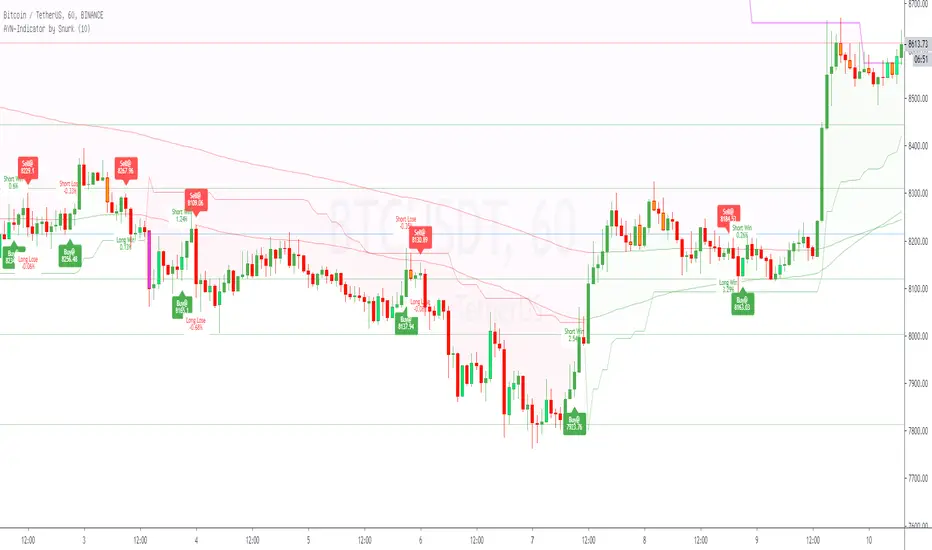
AYN: Buy-, Sell-, Trend- and SwingSignals incl. AutoFibo
Hi,
i want to introduce you to my AllYouNeed-Indicator. I calculate the buy sell signals within different timeframes independent in wich timeframe you are, therefore Pinescript suppose the Signal could be repainted. I was not able to fix this error, but after frequent checks of the result i haven't found a single repaint. Please try it out and let me know me, if you still get caught by a repaint.
Features:
- Short, Mid and Longterm-Trends
- Buy and Sell Signals and Results as well with Labels (Prices, Percentage, Win/Lose)
- Length Multiplier for different Marketsituations
- Trend-Signals with Barcolors (Lime=Uptrend, Fuchsia=Downtrend)
- Swing-Signals with Barcolors (Lime=Upswing, Orange=Downswing)
- Auto-Fibonacci with changing Linecolors as Support(green) / Resistance(red)
Hope you like it, feel free to contact me for further informations.
Please leave a comment on what I can do better, thanks.
Best regards,
snurk
EURUSD Binary Strategy Indicator ALERTS!Good afternoon traders!
The EURUSD Binary Strategy Indicator ALERT, is a continuation of the " EURUSD Binary Strategy 73% Win Ratio " strategy made by my self. This indicator allows you to add alerts in order for you not to miss a trade! Furthermore, for the purchase of the " EURUSD Binary Strategy 73% Win Ratio " strategy, this indicator is also included.
A FREE 5 DAY VERSION of the " EURUSD Binary Strategy 73% Win Ratio " Strategy is available! Go try it now!
Best regards!
Contact:
emilianomesauribe2000@live.com

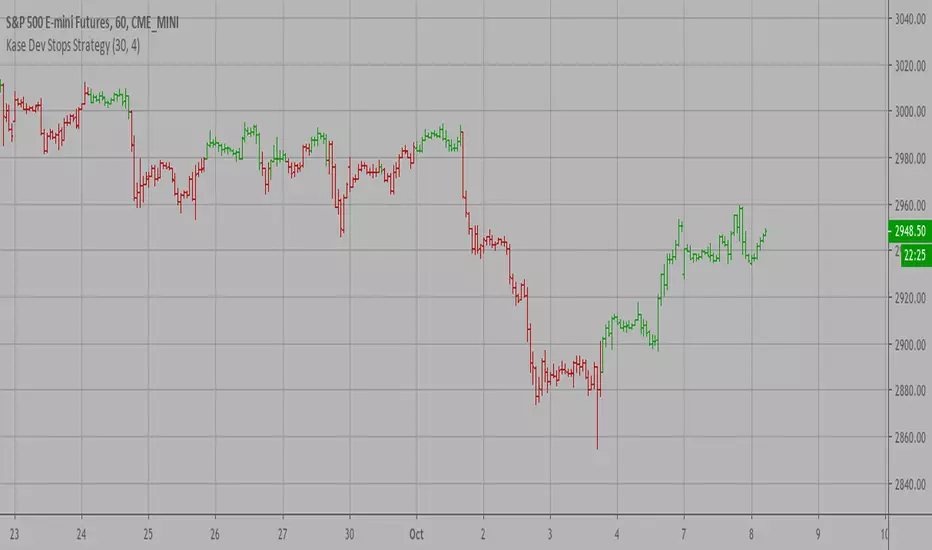
Kase Dev Stops Strategy The Kase Dev Stops system finds the optimal statistical balance between letting profits run,
while cutting losses. Kase DevStop seeks an ideal stop level by accounting for volatility (risk),
the variance in volatility (the change in volatility from bar to bar), and volatility skew
(the propensity for volatility to occasionally spike incorrectly).
Kase Dev Stops are set at points at which there is an increasing probability of reversal against
the trend being statistically significant based on the log normal shape of the range curve.
Setting stops will help you take as much risk as necessary to stay in a good position, but not more.
WARNING:
- For purpose educate only
- This script to change bars colors.
Simple signals example for Risk Management WrapperSimple signals example for Risk Management Wrapper
The unique part is that there is a single variable used for both Buy and Sell conditions.
Technically, a variable can have an infinity of values, so why not use that in our favour.
A value of -1 is used for the SELL alert condition , and a value of +1 is used for the BUY alert condition .
The Risk Management Wrapper can read them and act accordingly.
Any simple indicator on TradingView that gives Sell or Buy signals in a single variable should work.
More complex indicators that give multiple kinds of signals may not work due to TradingView limitations.
Jack's beginner strategyHi everyone,
Using this script on lower time frames 15 min. 30 min. 1 hr . gives you early signals. However for too small time frames, large changes can occur in the price thus affecting the exponential moving averages very fast.
This strategy is explained by CryptoJack, which mentions it is a simple beginner strategy, but an experienced trader can certainly benefit from it because it brings ease. This script plots the EMA's with the periods: 8, 13, 21, 55. Then it looks when the EMA's are alined from smaller period to higher period (representing an uptrend). The moment this happens a green triangle appears at the buy point. When the opposite occurs an exit signal is given by showing a red triangle.
You can also manually create an alert for when the triangles appear.
Always use with cautious, keep an eye out after buy signal whether an uptrend is really forming (confirmation of the uptrend) looking for higher highs and higher lows.
For improvements, ideas or questions, please send me a private message.

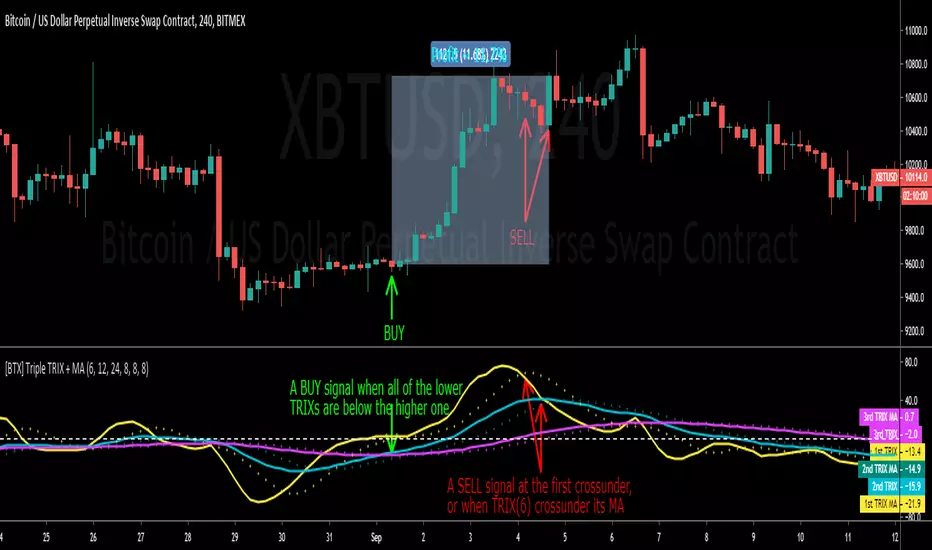
[BTX] Triple TRIX + MAsThis indicator suggest a strategy, which is quite similar to multiple MA or multiple RSI strategies.
This indicator can be used for all timeframes, all markets.
This indicator can help detect the market trend and momentum.
Default values are TRIX - 6, 12, and 24 periods and MA(8) for each TRIX line. You can choose what type of MA to be used (EMA or SMA).
How to exploit this indicator?
- When all of the lower TRIXs are ABOVE the higher one: TRIX(6) is above TRIX(12), and TRIX(12) is above TRIX(24), there is a BULLISH market.
- When all of the lower TRIXs are BELOW the higher one: TRIX(6) is below TRIX(12), and TRIX(12) is below TRIX(24), there is a BEARISH market.
- A crossover of the lower TRIX to the higher one indicates a BUY signal.
- A crossunder of the lower TRIX to the higher one indicates a SELL signal.
- TRIX crossover the Zero line can be considered as a STRONG bullish signal.
- TRIX crossunder the Zero line can be considered as a STRONG bearish signal.
- The MA of TRIX acts as a confirmation, it can be used as SELL signals.
- High slopes of TRIX lines can point out the high momentum of the current trend.
- Divergence patterns can be used with this indicator.
- And many more tricks.
Combo Strategy 123 Reversal & CMOfilt This is combo strategies for get a cumulative signal.
First strategy
This System was created from the Book "How I Tripled My Money In The
Futures Market" by Ulf Jensen, Page 183. This is reverse type of strategies.
The strategy buys at market, if close price is higher than the previous close
during 2 days and the meaning of 9-days Stochastic Slow Oscillator is lower than 50.
The strategy sells at market, if close price is lower than the previous close price
during 2 days and the meaning of 9-days Stochastic Fast Oscillator is higher than 50.
Second strategy
This indicator plots a CMO which ignores price changes which are less
than a threshold value. CMO was developed by Tushar Chande. A scientist,
an inventor, and a respected trading system developer, Mr. Chande developed
the CMO to capture what he calls "pure momentum". For more definitive
information on the CMO and other indicators we recommend the book The New
Technical Trader by Tushar Chande and Stanley Kroll.
The CMO is closely related to, yet unique from, other momentum oriented
indicators such as Relative Strength Index, Stochastic, Rate-of-Change, etc.
It is most closely related to Welles Wilder`s RSI, yet it differs in several ways:
- It uses data for both up days and down days in the numerator, thereby directly
measuring momentum;
- The calculations are applied on unsmoothed data. Therefore, short-term extreme
movements in price are not hidden. Once calculated, smoothing can be applied to the
CMO, if desired;
- The scale is bounded between +100 and -100, thereby allowing you to clearly see
changes in net momentum using the 0 level. The bounded scale also allows you to
conveniently compare values across different securities.
WARNING:
- For purpose educate only
- This script to change bars colors.
Phantom Trader -- BTC -- OnlyPhantom Trader is a "counter-trend" strategy built to take advantage of non-linear trading ranges and heavy chop zones.
Phantom Script is forward-thinking, and will project the next possible reversal zone (PRZ) well head of the move.
This script can be utilized for :
Hedging
Swing trading
Scalping
---------------------------------------------------------------------------------
Most reliable time frames are the 60-30-and 15
Green line indicates hidden support levels
Purple line Hidden resistance levels.
When price comes in contact with our PRZ "Potential Reversal Zone"
It is wise to take up a hedge position.
BITMEX:XBTUSD"
BITMEX:XBT
BITSTAMP:BTCUSD
BITSTAMP:BTCEUR
COINBASE:BTCUSD
COINBASE:BTCUSDC
COINBASE:BTCEUR
COINBASE:BTCGB
BITFINEX:BTCUSD
BITFINEX:BTCEUR
BITFINEX:BTCGBP
BINANCE:BTCUSD
BINANCE:BTCUSDC
BINANCE:BTCUSDT
BINANCE:BTCUSDC
BYBIT:BTCUSD
GEMINI:BTCUSD
KRKN:XBTUSD
----------------Impulse Rejection----------------------
Bullish Impulse
WEAK SELL SIGNAL: If Price is closing above Purple Phantom PRZ during bullish impulse, then likely a bullish impulse continuation is to take place.
STRONG SELL SIGNAL: If Price is failing to close above Purple Phantom PRZ Line after a bullish impulse, then look to hedge the short, or to take up a short position.
Bearish Impulse:
WEAK BUY SIGNAL: If Price is closing below Green Phantom PRZ line, after a bearish impulse, then maintain short position.
STRONG BUY SIGNAL: Once Price starts closing above Green Phantom PRZ line, look to hedge a long against a short, take profit the short, or net long the asset.
-------------------------------------------------------------------
Signal Invalidation
Close and continuation above Purple PRZ would invalidate short signal
Close and continuation below Green PRZ would invalidate the long signal
If the same above PRZ is rung once again, then that was likely a stop hunt.
Another close above, and signal should be retaken.
-----------------------------------------------------------------------
Midline Signals
Rejection at Midlines, during a bullish impulse, is bearish:
-Entering a short position or profit-taking current long is advised.
-A net-long trader not wanting to profit take their long can hedge an equal-sized short there.
Rejection at Midlines, during a bearish impulse, could signal trend change:
-A net-short trader should hedge a long position against their short.
-A net-long trader can add to their long on the second or third bounce
Continued rejection at midline, one should take up a net position in the direction of which the chart is rejecting.
-----------------------------------------------------------------------
For Test Access Please use the following GOOGLE form:
forms.gle
For monthly licensing:
https://coin-observatory.chargifypay.com...
$75/month licensing fee
To obtain a lifetime license
And
For SCRIPT SUPPORT please join our discord:
discord.gg
For ALL ASSET Classes

Combo Strategy 123 Reversal & CMOavThis is combo strategies for get a cumulative signal.
First strategy
This System was created from the Book "How I Tripled My Money In The
Futures Market" by Ulf Jensen, Page 183. This is reverse type of strategies.
The strategy buys at market, if close price is higher than the previous close
during 2 days and the meaning of 9-days Stochastic Slow Oscillator is lower than 50.
The strategy sells at market, if close price is lower than the previous close price
during 2 days and the meaning of 9-days Stochastic Fast Oscillator is higher than 50.
Second strategy
This indicator plots average of three different length CMO's. This indicator
was developed by Tushar Chande. A scientist, an inventor, and a respected
trading system developer, Mr. Chande developed the CMO to capture what he
calls "pure momentum". For more definitive information on the CMO and other
indicators we recommend the book The New Technical Trader by Tushar Chande
and Stanley Kroll.
The CMO is closely related to, yet unique from, other momentum oriented
indicators such as Relative Strength Index, Stochastic, Rate-of-Change, etc.
It is most closely related to Welles Wilder?s RSI, yet it differs in several ways:
- It uses data for both up days and down days in the numerator, thereby directly
measuring momentum;
- The calculations are applied on unsmoothed data. Therefore, short-term extreme
movements in price are not hidden. Once calculated, smoothing can be applied to
the CMO, if desired;
- The scale is bounded between +100 and -100, thereby allowing you to clearly see
changes in net momentum using the 0 level. The bounded scale also allows you to
conveniently compare values across different securities.
WARNING:
- For purpose educate only
- This script to change bars colors.
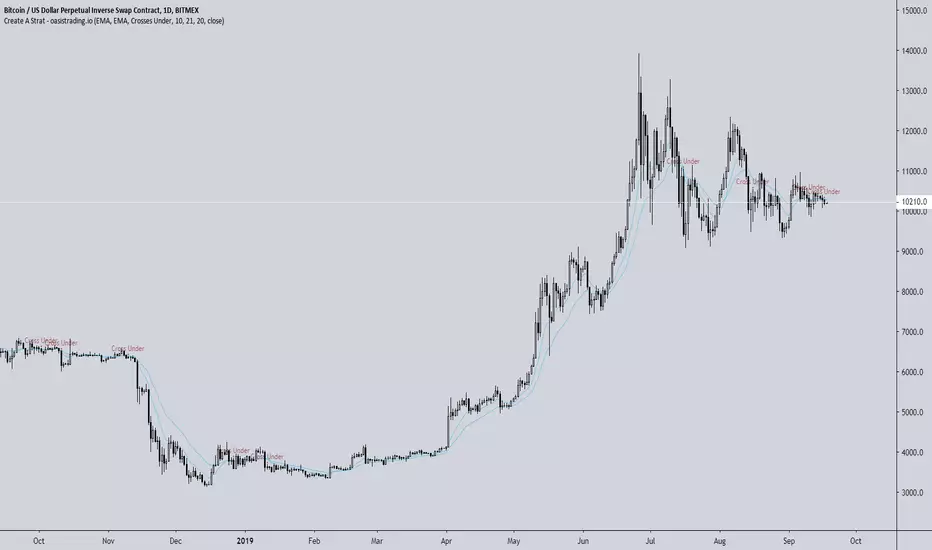
Create A StratThis indicator is free to all Oasis Trading Group members.
Create A Strat is an indicator that allows you to do just that - create your own strategy.
You can select from an EMA, Bollinger Band, VWAP and candle as each source.
You can program it to alert you when the desired condition occurs.
Some possible examples include:
Candle closes above Bollinger band
EMA crosses VWAP
Two EMAs cross
EMA crosses any part of the Bollinger Band (upper/mid/lower - all user selectable)
Visual alerts are given as well as actual alerts you may set.
In addition, Create A Strat is useful because Tradingview's strategy tester is known to repaint and give misinformation when it comes to your strategy. Using Create A Strat will allow you to backtest your chosen strategy without issue.
For Access or Questions: Private message us. Thank you.
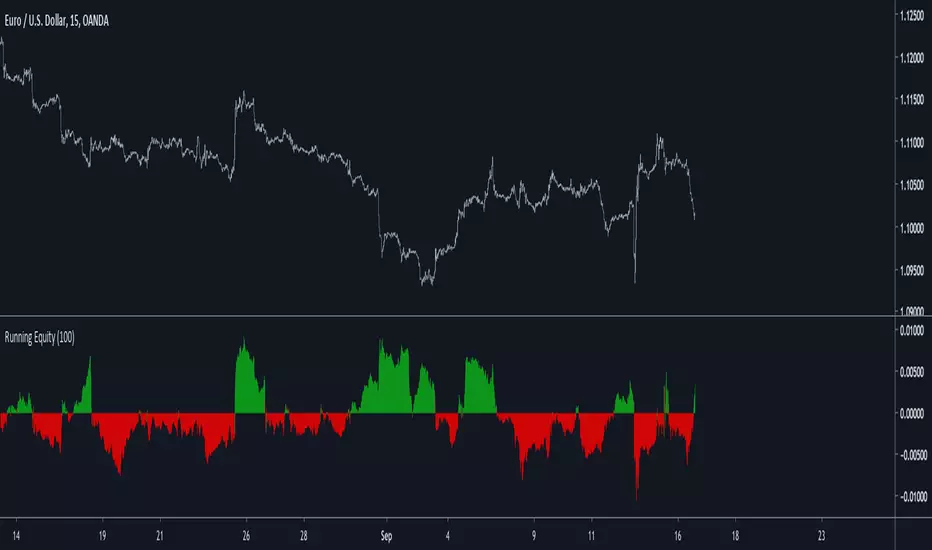
Running Equity - A New Indicator For Optimal Markets DetectionIntroduction
Winning trades and gaining profits in trading is not impossible, however having gross profits superior to gross losses is what make trading challenging, it is logical to think that it is better to open a position when the probability of winning the trade is high, such probability can’t be measured with accuracy but a lot of metrics have been proposed in order to help determining when to open positions, technical analysis support the fact that a trending market is the best market condition for opening a position, which is logical when using a trend following strategy, therefore a long-term positive auto-correlated market is optimal for trading, this is why this paper present a new method for detecting optimal markets conditions in order to open a position.
The Indicator
The proposed indicator is based on the assumption that positive returns using a trend following strategy are a strong indication of trend strength, the proposed indicator is built from the conditions of a simple SMA cross trend following strategy, which are to go long when price > SMA and to go short when price < SMA. Then the equity from those conditions is built, in order to provide a more flexible indicator, length control the period of the sum.
When the indicator is positive it means that the market allow for potential returns, it can thus be considered being trending. Else a negative value of the indicator indicate a ranging market that won't allow for returns.
Filtering Bad Trades
The indicator can be used to filter bad trades entries, in this example a Bollinger band breakout strategy is used, without any changes the strategy return the following equity on EURUSD
The proposed indicator is then applied with the following conditions : buy and sell only if Req > 0
With an indicator period = 100 we filtered unprofitable trades.
Conclusion
I presented a new indicator for the detection of optimal markets based on a running equity. I hope both indicators may find applications in technical analysis and help investors get pertinent outputs from them.
it would mean a lot if you could read the original paper : figshare.com
Combo Strategy 123 Reversal & CMOabs This is combo strategies for get a cumulative signal.
First strategy
This System was created from the Book "How I Tripled My Money In The
Futures Market" by Ulf Jensen, Page 183. This is reverse type of strategies.
The strategy buys at market, if close price is higher than the previous close
during 2 days and the meaning of 9-days Stochastic Slow Oscillator is lower than 50.
The strategy sells at market, if close price is lower than the previous close price
during 2 days and the meaning of 9-days Stochastic Fast Oscillator is higher than 50.
Second strategy
This indicator plots the absolute value of CMO. CMO was developed by Tushar
Chande. A scientist, an inventor, and a respected trading system developer,
Mr. Chande developed the CMO to capture what he calls "pure momentum". For
more definitive information on the CMO and other indicators we recommend the
book The New Technical Trader by Tushar Chande and Stanley Kroll.
The CMO is closely related to, yet unique from, other momentum oriented indicators
such as Relative Strength Index, Stochastic, Rate-of-Change, etc. It is most closely
related to Welles Wilder`s RSI, yet it differs in several ways:
- It uses data for both up days and down days in the numerator, thereby directly
measuring momentum;
- The calculations are applied on unsmoothed data. Therefore, short-term extreme
movements in price are not hidden. Once calculated, smoothing can be applied to
the CMO, if desired;
- The scale is bounded between +100 and -100, thereby allowing you to clearly see
changes in net momentum using the 0 level. The bounded scale also allows you to
conveniently compare values across different securities.
WARNING:
- For purpose educate only
- This script to change bars colors.

Relative Candle Volatility & Directionality IndexThis is an enhanced (closed-source) implementation of the Relative Candle Volatility Index (RCVI), with a Relative Candles Directionality Index (RCDI) added.
When the RCVI switch significantly positive, it indicates a sudden increase in volatility ; whereas, when the RCVI switch significantly negative, it indicates a sudden decrease in volatility -- in relative to the (just prior) market trend.
A positive (green) RCDI indicates a net positive price trend, while a negative (red) RCDI indicates a net negative price trend.
Buy/Sell strategy circle-markers, derived base on the interaction between the RCVI and the RCDI , are also introduced in this edition.
The parameters should be manually "history-matched", for a particular chart and time-frame, for the best result.
RCVI QUICK GUIDE:
~ * ~ * ~ * ~ * ~ * ~ * ~ * ~ * ~ * ~ * ~ * ~ * ~ * ~ * ~ * ~ * ~ * ~ * ~ * ~ * ~
Note:
In no way is this intended as a financial/investment/trading advice. You are responsible for your own investment decisions and trades.
Please exercise your own judgement for your own trades base on your own risk-aversion level and goals as an investor or a trader. The use of OTHER indicators and analysis in conjunction (tailored to your own style of investing/trading) will help improve confidence of your analysis, for you to determine your own trade decisions.
~ * ~ * ~ * ~ * ~ * ~ * ~ * ~ * ~ * ~ * ~ * ~ * ~ * ~ * ~ * ~ * ~ * ~ * ~ * ~ * ~
Please check out my other indicators sets and series, e.g.
LIVIDITIUM (dynamic levels),
AEONDRIFT (multi-levels standard deviation bands),
FUSIONGAPS (MA based oscillators),
MAJESTIC (Momentum/Acceleration/Jerk Oscillators),
PRISM (pSAR based oscillator, with RSI/StochRSI as well as Momentum/Acceleration/Jerk indicators),
PDF (parabolic SAR /w HighLow Trends Indicator/Bar-color-marking + Dynamic Fib Retrace and Extension Level)
and more to come.
Constructive feedback and suggestions are welcome.
~ JuniAiko
(=^~^=)v~

Combo Strategy 123 Reversal & CMO & WMA This is combo strategies for get a cumulative signal.
First strategy
This System was created from the Book "How I Tripled My Money In The
Futures Market" by Ulf Jensen, Page 183. This is reverse type of strategies.
The strategy buys at market, if close price is higher than the previous close
during 2 days and the meaning of 9-days Stochastic Slow Oscillator is lower than 50.
The strategy sells at market, if close price is lower than the previous close price
during 2 days and the meaning of 9-days Stochastic Fast Oscillator is higher than 50.
Second strategy
This indicator plots Chandre Momentum Oscillator and its WMA on the
same chart. This indicator plots the absolute value of CMO.
The CMO is closely related to, yet unique from, other momentum oriented
indicators such as Relative Strength Index, Stochastic, Rate-of-Change,
etc. It is most closely related to Welles Wilder?s RSI, yet it differs
in several ways:
- It uses data for both up days and down days in the numerator, thereby
directly measuring momentum;
- The calculations are applied on unsmoothed data. Therefore, short-term
extreme movements in price are not hidden. Once calculated, smoothing
can be applied to the CMO, if desired;
- The scale is bounded between +100 and -100, thereby allowing you to clearly
see changes in net momentum using the 0 level. The bounded scale also allows
you to conveniently compare values across different securities.
Combo Strategy 123 Reversal & Chande Momentum OscillatorThis is combo strategies for get a cumulative signal.
First strategy
This System was created from the Book "How I Tripled My Money In The
Futures Market" by Ulf Jensen, Page 183. This is reverse type of strategies.
The strategy buys at market, if close price is higher than the previous close
during 2 days and the meaning of 9-days Stochastic Slow Oscillator is lower than 50.
The strategy sells at market, if close price is lower than the previous close price
during 2 days and the meaning of 9-days Stochastic Fast Oscillator is higher than 50.
Second strategy
This indicator plots Chande Momentum Oscillator. This indicator was
developed by Tushar Chande. A scientist, an inventor, and a respected
trading system developer, Mr. Chande developed the CMO to capture what
he calls "pure momentum". For more definitive information on the CMO and
other indicators we recommend the book The New Technical Trader by Tushar
Chande and Stanley Kroll.
The CMO is closely related to, yet unique from, other momentum oriented
indicators such as Relative Strength Index, Stochastic, Rate-of-Change,
etc. It is most closely related to Welles Wilder`s RSI, yet it differs
in several ways:
- It uses data for both up days and down days in the numerator, thereby
directly measuring momentum;
- The calculations are applied on unsmoothed data. Therefore, short-term
extreme movements in price are not hidden. Once calculated, smoothing
can be applied to the CMO, if desired;
- The scale is bounded between +100 and -100, thereby allowing you to
clearly see changes in net momentum using the 0 level. The bounded scale
also allows you to conveniently compare values across different securities.
WARNING:
- For purpose educate only
- This script to change bars colors.
WBCC Scalp StrategyИндикатор для Scalp сделок, использовать рекомендуется исключительно на временных интервалах от 1 часа и ниже.
