Sentimental Cycles with CrossingsThis indicator provides the following options, where you can choose to display:
DEMA TEMA cycles, filtered by default with sentiment.
Sentiment cloud, based on the 200ema area between the 1 minute and 1 hour lines.
One or both ema crossings with their respective timeframes (independent from current chart timeframe) and optional line display.
One or two tickers and their respective crossings based on selected timeframes.
Additional EMA lines supplied with their very own timeframe.
This indicator is intended to be used any way suitable to the user, nearly every aspect is customizable, and the defaults are just enough to get you started on deciding whether it's time to enter calls or puts.
TIPS for optimal results:
- Try using 2 charts: the 1 minute and the 1 hour per symbol. Under the 1 minute chart, use the 3 minute and 5 minute timeframe for crossings.
- Try to start a position when a sentimental DEMA TEMA cloud is beginning to form. The first bar usually pays thicc.
- Tickers SPY and VXX can be of good reference for market direction. If all crossings coincide, it's because there's a strong momentum in a certain direction for the market.
Strategy!

Pro Ecometrics [by @Amu_Arsalan] ✔ Intro
As a day trader, this is one of my main strategies to trade with, I have been developing this strategy last 6 months. this strategy helps me make great trades more confident. I wish this could help you make great trades as well
✔ OVERVIEW
This is a combination of linear regression for trend analysis and auto plot channel and divergences for 9 oscillators and indicators in 5 different candle range lookback.
✔ CONCEPTS
As a trader, you probably know how to trade with channels and trend lines, but we need more confirmation before we dive into a trade, Divergences are one of the most accurate and reliable confirmations for this purpose. So I combine these as a strategy. when I see a confluence in divergence signal and trend line (regression), it has a great chance to see a reversal.
✔ Divergences
Show both Bearish and Bullish Divergences fully detailed for normal and hidden divergences it plots a label with indicator names and its values that make this divergence occur. it could calculate divergences for 9 oscillators and indicators for 5 lookback periods.
✔ Trend Line
It has editable settings such as lookback period, source, and even color changing. by default, it makes a linear regression for the past 100 candles.

MicroStrategy MetricsA script showing all the key MSTR metrics. I will update the script every time degen Saylor sells some more office furniture to buy BTC.
All based around valuing MSTR, aside from its BTC holdings. I.e. the true market cap = enterprise value - BTC holdings. Hence, you're left with the value of the software business + any premium/discount decided by investors.
From this we can derive:
- BTC Holdings % of enterprise value
- Correlation to BTC (in this case we use CME futures...may change this)
- Equivalent Share Price (true market cap divided by shares outstanding)
- P/E Ratio (equivalent share price divided by quarterly EPS estimates x 4)
- Price to FCF Ratio (true market cap divided by FCF (ttm))
- Price to Revenue (^ but with total revenue (ttm))

TT Price/Trend IndicatorThe TT Price/Trend Indicator identifies potential trend changes and advises of safe places to set orders at retracements.
Main Signals:
When a "BUY" signal prints, it is suggested to set a buy order at the Blue trendline and wait until price retraces back.
When a "SELL" signal prints, it is suggested to set a short order at the Blue trendline and wait until price rises up.
Take Profit:
The Reactive Trendline (the thick line that switches from Green to Red, and Red to Green frequently) is good at finding local bottoms.
It is suggested to Take Profit on your Long once you see the first switch from Green to Red. If the Reactive Trendline is already Red when your LONG order is filled, wait until it goes from Red-Green-Red to Take Profit.
It is suggested to Take Profit on your Short once you see the first switch from Red to Green. If the Reactive Trendline is already Green when your SHORT order is filled, wait until it goes from Green-Red-Green to Take Profit.
Stop Loss Suggestions:
If you are LONG (BUY), set your Stop/Loss to slightly below the last Higher Low (HL)
If you are SHORT (SELL), set your Stop/Loss to slightly above the last Lower High (LH)
Alternatively, if you want to maximise your Risk:Reward ratio, you can CLOSE your order once a candle engulfs and closes over both the Blue Line AND the Grey Line. Once these levels are broken and you are underwater, the risk to hold that position is no longer worth it. However, this approach can shake you out of winning trades, so I advise you to use other strategies such as Volume, Fibonnaci and RSI etc to help you make a final decision.
Important: If you are taking this approach, don't panic sell - wait for the close of the current engulfing candle to make this decision, because quite often it will just be a wick up or down in your favour.
What are the best Strategies?
The best timeframes are as follows:
- 1 Hour
- 2 Hour
- 4 Hour
- 1 Day
- 1 Week
My Favourite is 1 Hour.
Scalping for advanced traders:
- 1 minute
- 5 minutes
If you are scalping, it is highly recommended to use the TT Volume Indicator as well, to confirm price with volume (see scripts under my profile). Price on its own will not be good enough.
I also recommend the RSI with a 14 SMA to identify Strength breakouts.
Other Features:
- VWAP (Dotted Red/Green line) - this is common liquidity and can be one of the most important Support/Resistance levels in Crypto, which is why it is included.
Can you FOMO order?
Unless you are using this with a combination of other indicators (such as the TT Volume Indicator), it is not recommended to FOMO orders at the "BUY" or "SELL" signal unless you have a clear volume breakout. Please see this explanation on FOMO ordering for further information:

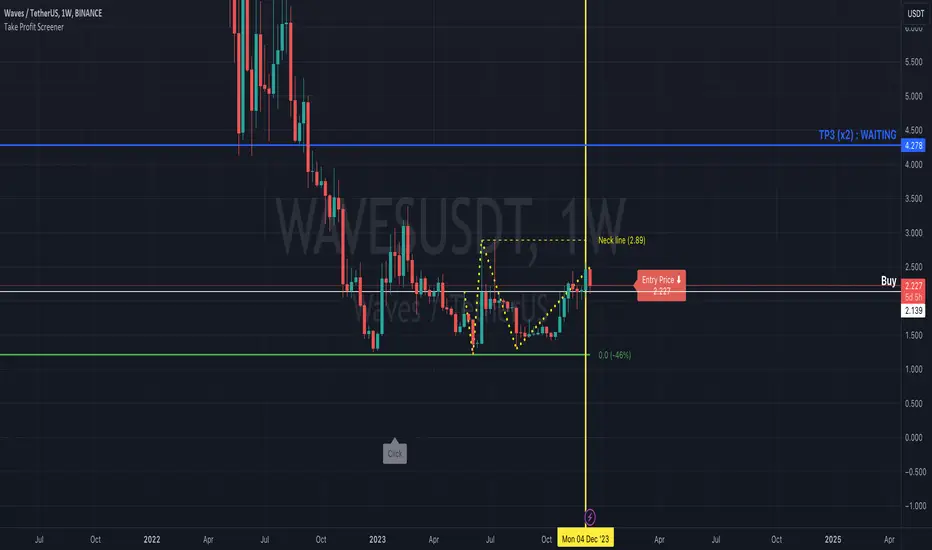
Take Profit ScreenerI'm going to introduce you to the Take Profit Screener tool.
It allows you to manually scan your watchlist to determine at a glance the assets that have the best profitability potential.
It is a 2 in 1 tool that allows you to :
identify where your Take Profit ratios are located whether you are in SHAD or Cycle Strategy
identify the potential reward percentages when approaching the key Fibonacci levels
Before you start using it, you need to:
sort your watchlist according to the price (Last) in order to have price ranges more or less close to each other when jumping from a symbol to another
disable the Auto Scale and Magnet feature
select your first symbol
display the tool (the indicator more exactly)
The settings dialog box is organised in 3 sections:
Strategy : By setting this section, you will answer the question " Where do my Take Profit ratios stand in relation to my entry price, and according to Risk Management Strategy adopted (SHAD or Cycle)? "
Fibonacci : By setting this section, you will answer the question " What percentage gain can I expect as I approach one of the key Fibonacci levels? "
Layout : This is the settings for the look and feel
Strategy Section
Active : This part of the indicator won't display on your chart if unchecked
Type : Choose between SHAD or Cycle Strategy. When choosing SHAD, you can select 2, 4, 8 or 16 SHAD Levels. When choosing Cycle, you can enter whatever ratio value you wish in the Strategy Ratio (Cycle only) input.
SHAD xNN : When choosing SHAD Strategy, you should select at least one level and more if need be.
Strategy Ratio (Cycle only) : When choosing Strategy Type Cycle, you can enter whatever ratio value you wish there.
Freeze Entry Price & Value : Leave it unchecked whenever the current price of the asset is located within your desired area (i.e. Reload Zone) while attempting to estimate its potential reward. Conversely, keep it checked whenever the current price of the asset is outside your desired area, but you need to anticipate the potential reward of this asset if its price reaches a certain level, your Entry price. Enter this price there and check the box.
Show price : If checked, both Take Profit ratio and Price are displayed. If unchecked, then price is hidden.
Extend Line : If checked, then lines showing Take Profit levels extend to the left.
Label Offset : If checked, then the label that displays Take Profit ratio and price shift to the right by a value that ranges from 0 to 100 candles.
Label Style : You can choose between Right or Top. This will determine the orientation of the label.
Fibonacci Section
Active : This part of the indicator won't display on your chart if unchecked
Type : Choose between SHAD or Cycle Strategy. When choosing SHAD, you can select 2, 4, 8 or 16 SHAD Levels. When choosing Cycle, you can enter whatever ratio value you wish in the Strategy Ratio (Cycle only) input.
SHAD xNN : When choosing SHAD Strategy, you should select at least one level and more if need be.
Strategy Ratio (Cycle only) : When choosing Strategy Type Cycle, you can enter whatever ratio value you wish there.
Freeze Entry Price : Leave it unchecked whenever the current price of the asset is located within your desired area (i.e. Reload Zone) while attempting to estimate its potential reward. Conversely, keep it checked whenever the current price of the asset is outside your desired area, but you need to anticipate the potential reward of this asset if its price reaches a certain level, your Entry price. Enter this price there and check the box.
Color : You can define the color of Fibonacci line levels
SHAD helperDisplays lines and labels for prices following the SHAD strategy.
SHAD strategy consists in selling half the position every time price doubles, thus this indicator displays values for x2, x4, x8 and x16 of current closing price.
You can also see "/2" (-50%) and "/4 " (-75%) values.
You can edit display colors and labels text size in the indicator's settings

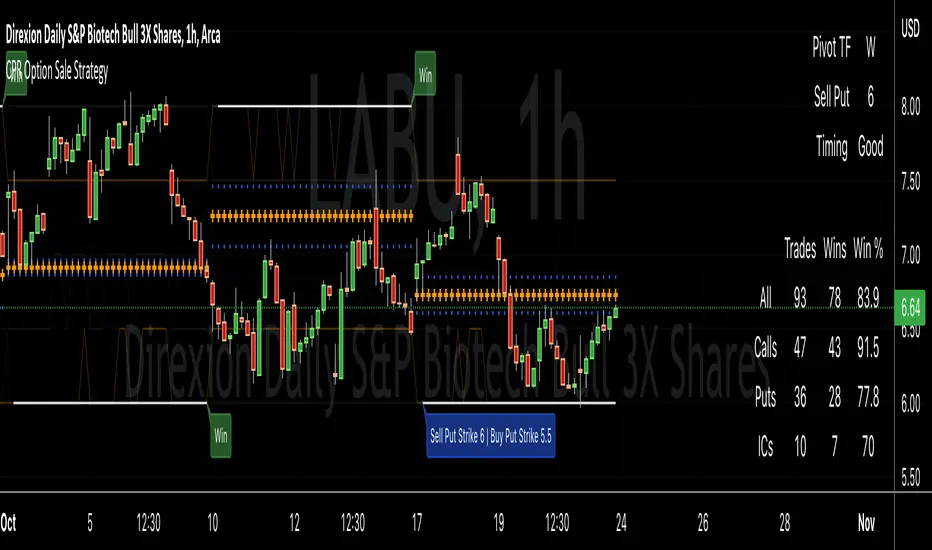
CPR Option Selling StrategyGood afternoon traders,
This is a script I built for option selling, in attempt to have a high success rate.
The gist of how it works:
It uses the opening or close of the current chart's timeframe opening bar when referenced against a designated (higher) timeframe's central pivot range (CPR).
Using that comparison, this script calculates an option to sell: put, call, or iron condor. It will calculate a call value using an average of the CPR central pivot and the max value of the prior higher timeframe's high or R1 (whichever is higher.)
It does the same for the put side, but uses the higher timeframe's low or S1 (whichever is lower.)
It will use the option on the other side of the source (open or close) of the CPR as the "option in play."
Settings:
There are many settings, most are simply "viewable" settings, and probably self explanatory, others, not so much:
"Source for Trigger" - this is the value used on the "opening bar," such as the close. This value is the one compared to the Central Pivot Range in determining whether to sell a call (if the source is lower,) sell a put (if the source is higher,) or an iron condor if it's in the CPR.
"Show Historical Win/Loss Percentages" - this shows a table in the bottom right of the W/L percentages for the current ticker and settings. Used for a quick glance at historical success rates.
"Extend Developing Levels Into the Future" - This will extend the developing values for CPR values, call and put values into the future (good for trying to trade early or setting up pre-market trades, assuming there will not be huge gap in one direction or another.)
"Select Higher Timeframe" - "Auto" will choose the higher timeframe for you. "Manual" will use the next field...
"If Manual, Timeframe for Pivots" - allows you to choose a different higher timeframe.
The next two sections are simply whether to show the plots for different levels of traditional and/or camarilla pivot points.
The last section will allow you to just filter on certain days. Really only useful for "backtesting" certain 0DTE trades on some daily options during the hourly chart.
Example use:
An example use (which I completed last week) on the chart referenced in this share: I sold a put-spread for $0.90, selling a 590 and buying a 570 strike in the middle of the week. I was looking at an hourly timeframe chart with a weekly pivot timeframe for the strategy.
Obviously, making only $0.90 on a $20 spread, there is a lot more to lose than to make, but I did some other analysis to go with it, so I felt safe, and I had a stop set for $1.50. So it worked, along with 3 other plays I did, very similar, and if that "Historical Win/Loss Percentage" is accurate, which I am fairly certain it is, I felt good about it.
The key all comes down to what you sell it for, right? That piece only you can determine. :)
Happy trading and enjoy,
Deuce
Renko Candles OverlayHello All,
For long time I got many request for Renko Candles and now here it's, Renko Candles Overlay . I tried to make almost everything optional, so you can play with the options as you want.
Let see the options:
Method: the option for brick scaling method: ATR, ATR/2, ATR/4, Percent, Traditional
- ATR Period: period for Average True Range and it's valid if the method is ATR
- ATR/2 Period: period for Average True Range and it's valid if the method is ATR/2
- ATR/4 Period: period for Average True Range and it's valid if the method is ATR/4
- Traditional: User-defined brick size, it's valid if the method is Traditional
- Percent: Percent of Close price, it's valid if the method is Percent
if the method is not Traditional (fixed brick size) then Brick size is calculated/updated when new bricks added. so The box sizes may be different because of the calculation is dynamic.
Levels & Lines for new Bricks: if you enable this option then the script shows the levels for new brick
Change Bar Color: optionally the script changes the bar color by using direction of the bricks
and some other options for coloring.
The script shows the bricks for visible area, which is approximately 280 candles. so if you change the width and number of the bricks then number of bricks that is shown is adjusted automatically to fit the screen. you can see the examples below:
The script shows the levels to new brick as a line and label:
Because of real-time bar is not confirmed until the candle close, the script shows the bricks as Unconfirmed , and unconfirmed bricks shown in different color:
You can change the width of the bricks (width is 10 in following example):
Optionally candle colors are changde by the direction of the bricks:
If you have any recommendation then please drop a comment under the script ;)
Enjoy!

Historical Range (Using eStrategy library)⬜ The script is intended to cover few things.
▶ Strategy testing framework based on eStrategy library
▶ Using historicalrange of values for identifying better entry and exits.
This is also built on top of the Systematic Investment Plan script published here
⬜ Strategy testing framework
Strategy testing framework is different from tradingview default strategy testing from few ways to suit the needs of systematic investments.
▶ Supports recurring investment on top of initial investment to emulate adding further funds to the investment bucket on regular basis.
▶ Better calculation of drawdowns based on daily equity rather than drawdown calculated only on close of trade.
▶ Provides better control over how much strategy can reduce and reload
Having said that, this framework is not intended as replacement for tradingview strategy framework. It is not as comprehensive as tradingview strategy framework. But, created to address few specific styles of strategy.
▶ No detailed trade stats on individual trades. But, this can be implemented in future versions
▶ At present only facilitates long positions.
▶ UI features such as plotting trades on chart are not available.
▶ Does not take into consideration of slippage and brokerage - this is not an issue because the framework is not meant for short term trades. It is only made for daily timeframes.
▶ No pyramiding or leverage possible.
And many more...
Framework can be used for similar strategies based on market timing with few small changes.
⬜ Historical Range Strategy
Concept here is, instead of taking indicators such as oscillators as is, use historical percentile to derive better oversold and overbought conditions. Strategy provides different options to base historical range. This can either be based on
▶ Band percent
▶ Oscillator
Different choices of bands and oscillators are also available to chose. However, have not done extensive testing on all the combinations.
⬜ Settings
▶ Initial and recurring investment settings (As confirm inputs)
▶ Buy and hold and strategy specific settings to be used for stat calculation
▶ Band and oscillator parameters
These are straightforward parameters which is used for defining the base of either bands or oscillators.
▶ Percentile moving average parameter
Percentile MA is used with Percentile to find entry and exit signals based on crossover and crossunder.
Feedbacks and suggestions welcome.

SAR+RSI+EMAs SignalsNOTE:
Indicator based strategies may expire and begin to work again. There are various ways to check the expiration of these strategies but I suggest equity curve trading (EC trading) as the best one.
Please check every single indicator based strategy to see if it’s still profitable or it has been expired to avoid losses.
Principles:
I personally believe every profitable indicator-based setup need 3 factors. Actually I analyze indicator-based set up in this way!
1- Trend detector: a tool that detect the “trend”.
2- Oscillators (Discount finder): a tool that detects “discounts” in the direction of the trend.
3- Stimulus: A tool that indicates the Initiation of a movement.
There may be profitable strategies that do not use all three, because other factors are strong enough to lead us to profit, but they are rare and sometimes they hide the other forgotten factor in the main two ones.
Elements:
(Since most of traders here, are familiar with these famous indicators I will not take your time to write about their uses and formula)
SAR: As a Trend detector, regarding position of close and SAR
EMA 7 and EMA 21: As trend detectors, regarding position of EMA 7 as fast “moving average” and EMA 21 as slow one. Also we need another confirmation for trend regarding EMA 7 and closing price of the signal candle.
RSI: In this strategy RSI is used both as a discount finder and a stimulus.
For RSI being over/under 50, regarding the trend, a possible discount may have been occurred. Imagine these conditions: close>EMA7, EMA7>EMA21, close>SAR and simultaneously RSI being under 50 is really a sign of powerful uptrend which it’s RSI decreasing might be a sign of corrective move, which will be following a bullish impulsive move.
The other use of RSI is to stimulate a buy signal by “crossing” over 50 or 30 (50 as balanced point of momentum and 30 as a sign of ending an oversold) or stimulate a sell signal by “crossing” under 50 or 70 (50 as balanced point of momentum and 70 as a sign of ending an overbought).
Entry point: you can use one of the followings.
1- Open of the next candle
2- EMA 7
3- Open of the signal candle
(Totally optional but “open of the next candle” is suggested by me.)
SL: Use one of the followings.
1- SAR or some pips (regarding ATR Or your experience of this trading instrument’s fluctuations in this time frame) below the SAR
2- Fixed amount (regarding ATR Or your experience of this trading instrument’s fluctuations in this time frame)
3- Use EMA21 as dynamic SL (if a candle far enough from the initiative candle close over (for sell) below ( for buy)
Again number 1 is suggested by me.
TP: Use one of the followings.
1- Use static levels or zones of support and resistance as TP.
2- Use dynamic levels for instance band of BB or moving averages (Moving the SL is possible).
3- Use fixed R to R
And I believe static zones of support and resistance work better.
Examples:
I indicate a buy signal on the chart!
Using local level as TP worked just good.
Using EMA was better in this case.
And using a riskier level or a fixed R to R is obvious in the chart!
Since in the range markets, this strategy may not work well and at the same time, TP to SL might be too small to be worth the risk, I prefer to use levels to filter range market conditions!
I convert all those circumstances to a simple buy and sell signs on the chart!
EMA21 and SAR are still visible because it is possible that traders use them for their TP and SL.
This is how it look without EMA21 and SAR!
Another screenshot of this strategy!
I also add a check box to filter signals by another trend detector. MATD created by me to help traders detect trend!
As it’s visible, some profitable signals filtered too, but using a longer-term trend detector as an additional one, alongside the double EMAs is very useful for this strategy.
The other box “use high&low instead of close for fast EMA” makes the “EMA7 and close” trend detector an easygoing one!
Almost everything is editable here!
*** I did not invent this strategy, you can find it for free on net ***
I'll change it to a "strategy" instead of an indicator if reader like to!

Pattern Recognition Pullback Strategy profit calculatorThis script has been designed for use in botting Crypto spot / futures.
The intended use is send signals to a 3commas bot setup for the exchange. The bot uses candle measuring percentile nearest rank filters and range
breakouts to decide if the market is trending. When the market is trending it will look for pullbacks below a moving average and buy in the trend direction on a pullback discount. This is the profit calculator part of the script
With this script you will not be able to send tradingview signals, that is because it is a payed premium service and for security reasons I am the only one with access to making signals from this script.
I provided a user manual:
drive.google.com

Pattern Recognition Pullback StrategyThis script has been designed for use in botting Crypto spot / futures.
The intended use is send signals to a 3commas bot setup for the exchange. The bot uses candle measuring percentile nearest rank filters and range
breakouts to decide if the market is trending. When the market is trending it will look for pullbacks below a moving average and buy in the trend direction on a pullback discount.
With this script you will not be able to send tradingview signals, that is because it is a payed service and for security reasons I am the only one with access to making signals from this script. I will be uploading a second script which is the profit calculator. This way you can toy around to find your preferred settings for the bot and see the results it could have made.
I provided a user manual:
drive.google.com

WhaleCrew VisionVision is an advanced momentum oscillator that visualizes momentum strength with overbought and oversold readings.
Features
Momentum Waves
Divergence Detection (regular and hidden divergences)
Detection for momentum shifts (detects higher lows/lower highs on the oscillator)
Detection for momentum stagnation
Moneyflow
Most important: Our Custom Strategy Builder
Custom Strategy Builder
The custom strategy builder is a framework that allows you to easily create custom strategies.
1. Configure long/short conditions
Pre-defined conditions for custom timeframes, under which you're looking to potentially enter a trade.
2. Configure trigger
Select a trigger (e.g. "Wave Cross" or "Wave Lower High") to generate labels/alerts for potential entries, whenever long/short conditions are met.
3. Configure Take Profit Conditions
Potential Take Profits are triggered by momentum stagnation.
4. Backtest your strategy
By using our open-source backtester script (published on our profile).
5. Trade responsibly
Manually review each signal/alert before taking any actions.
Note: The "Strategy Backtest" input section can also help you develop your strategy.
Usage
You can use this indicator to follow the trend, detect momentum shifts or memorize patterns.
Take a systematic approach by using our strategy builder.
Access to this indicator can be obtained through our website.

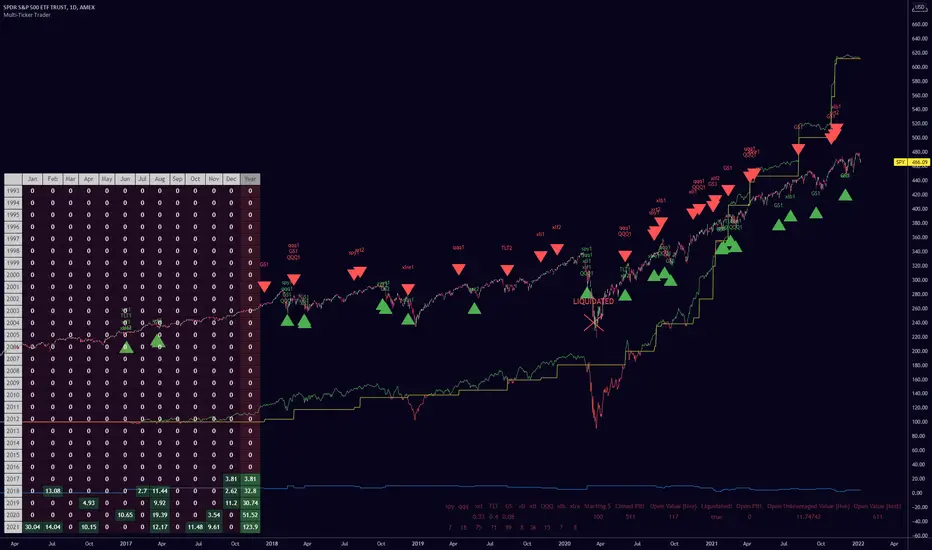
Multiple Ticker TraderThis indicator can be used as an alternative to the built in Strategy Tester for those who want to (back) test a strategy on multiple tickers simultaneously and see it's performance.
Just change the buy and sell conditions in the code to fit your needs.
The strategy I've used here is scaling into up to 10 tickers a maximum of 5 times per ticker every time they retrace (another) 10% from their all time high.
You can set the maximum number of total trades and disable scale ins by setting them to an impossible number (such as, 99% away from the all time high).
Credit to QuantNomad for the monthly/yearly returns table bottom left.
The bottom right table shows the current number of shares the algo is long and also the total all-time returns from each individual ticker, and other data.
The blue line is the number of positions the script is currently long. Each scale into the same ticker represents one position.
The yellow line is the closed P&L.
The green/red line is the live P&L.
I've used leverage for the example image just to showcase the liquidation display.
These particular buy/sell conditions cannot close positions at a loss, so be careful if you're wild enough to use this setup live without understanding the script yourself. I haven't used it live myself yet and you should assume there are serious bugs before thinking about using it live, though I'm using a similar thing on cryptos and it's going fine.
You can edit the leverage, maximum trades and back test range in the settings. The number following the ticker on each label represents which scale in was bought/sold.
Enjoy :) let me know if you find any good results
Cyatophilum Smart rebalance strategyAn indicator to backtest and create automated Smart Rebalance strategies.
The strategy tries to beat holders while keeping your portfolio repartition stable.
Configure the indicator to receive alerts for several pairs at a choosen rebalance time frame.
═════════════════════════════════════════════════════════════════════════
█ HOW IT WORKS
Here is an example:
The user chooses a certain number of pairs, up to 4 pairs for now. An initial capital, a fees % and a rebalance time frame.
The capital is split equally between each pair. (ex. for 2 pairs: 50% on each).
On each rebalance time frame (on the bar it happens), pairs balance who grew bigger than 50% will be redistributed to other pairs, making sure that after the transaction, the total capital is once again split equally through all pairs. This means selling pairs whose price went higher than the others, and buying those who dropped. In other words, selling high and buying low.
On each interval, the strategy will send orders for each pair saying whether to buy or to sell, and the quantity.
█ HOW TO USE
Creating a strategy
When adding the indicator to the chart, you must confirm the pairs you want to use, the rebalance time frame, the initial capital and commission fees.
The inital capital corresponds to the quote currency of all pairs, so each pair must have the same quote currency. (ex: USDT or BTC markets)
It will also be asked to select a "Strategy Start Date", which is the starting point of your strategy. Select the current bar if you want to start a strategy and get accurate order quantities. Otherwise, select a bar in the past for backtesting.
When setting the "Strategy Start Date" to the current day, it will look like this:
The strategy equity is equal to the intial capital, and no order has happened yet, the backtest panel shows 0%.
The first rebalance will happen at the next interval: here the 15th november.
Since this is the first rebalance, the strategy buys each pair with the same quantity in quote currency value.
After 1 rebalance, the strategy equity drops a little, since we only bought and paid fees.
Backtesting
Since the strategy is trading several pairs, the Strategy Tester cannot really be used. This is why the indicator has a backtest panel and a equity line plot that shows the progress of the strategy.
This view can be replicated by disabling the labels in the style tab.
You can also use the Data Window to track the strategy pairs balances on each bar.
Creating Alerts
The indicator is using the alert() calls: it only uses 1 alert slot to send order messages for each pair.
To set your alert messages, open the indicator settings.
You can use the placeholders {pair}, {order_direction} and {quantity} to get their values replaced by respectively the pair ticker (symbol name without the exchange prefix), the order direction "BUY" or "SELL", and the quantity amount in quote currency.
Create your alert after you set the messages in the indicator settings, and make sure "Any alert() function call" is set in the alert option.
█ LIMITATIONS
• Small quantities
An order with a too small quantity might not get executed by the exchange. To increase the quantity of the strategy orders, either increase your strategy capital, increase the rebalance time frame, or reduce the number of pairs.
• Not enough data
The strategy will give an error if one of the pair data does not go back to the strategy start date. Typically if a crypto pair is new and was added to TradingView recently, you will not be able to backtest prior to that.
• Chart and rebalance Time Frame
The strategy will give an error if one of the two conditions are not met:
- The Rebalance time frame must be greater than current chart's time frame.
- The Rebalance time frame must be a multiple of current chart's time frame.
Please read the author instructions below for access and automation.

IDEAL BB with MA (With Alerts)It gives well combination of Moving average and Bollinger bands with signals

EneX SignalEneX is signal that give recommendation signals for entry and exit on spot market. This indicators not suitable for leverage trading in futures market.
EneX signal consider several indicators and has entry and exit rules.
EneX signal is suitable for investors who believe in trend following strategy (disclaimer on).
This script composed by Yohan Naftali for educational purpose only. Reader who will use this signal must do own research.
Indicator and Plot Involved
1. Williams Fractals with default periods = 2
2. William Alligator Indicators with default simple moving average 8, 13, and 21
3. Exponential Moving Averages with default value EMA 50, 100, and 200
4. Relative Strength Index with default overbought level = 80 and oversold level = 20
5. Williams Fractals are joined to create support and resistance line and fill area between support and resistance lines.
Entry signal conditions
1. Entry on Weakness when bullish fractal appear on n/2 period
2. Entry when price break resistance line
All entry condition must above EMA and alligator signal and not in overbought RSI
Exit signal conditions
1. Lowest price is below Exponential Moving Average
2. Lowest price is below William alligator lines
You can easily find entry and exit points by using Entry (E), Exit(X) signals
How to use
1. Monitor chart and wait until E or X signals
2. Entry if Entry Signal (E) appear (green colored label)
3. Exit if Exit Signal (X) appear (red colored label)
4. Change indicators setting when necessary
Best Practice
1. Entry only when entry signal (E) appear
2. Never entry when price below William alligator signal
3. Exit when exit signal (X) appear
4. Not exit when exit signal appear when you believe or you have information that price will be rebound
5. Exit if you believe that current price meet your target price
6. Always wise when use EneX signals
Disclaimer
Do your own research and consider fundamental price of asset.
The indicators provided on this script is for educational purposes only.
Author does not offer advisory or brokerage services, nor does it recommend or advise users to buy or sell particular stocks or securities.
Please examined script and give feedback for further improvement.

ProProfits LongStrategy made ready for automated trading based on Wavetrend/VWAP/RSI.
Whenever a 18 minute timeframe wave reaches below -60 is followed by a 3 minute timeframe VWAP cross up, a long signal will be given.
Once an RSI cross on the 10 minute timeframe above 60 is followed by a red dot on the momentum waves on the 1 minute timeframe, a Take Profit signal will be given.
The timeframes are adjustable in the settings interface, so this automated strategy can be used with any timeframe combination for the Wavetrend/VWAP/RSI.
Always make sure to view the chart from the lowest timeframe you're using.

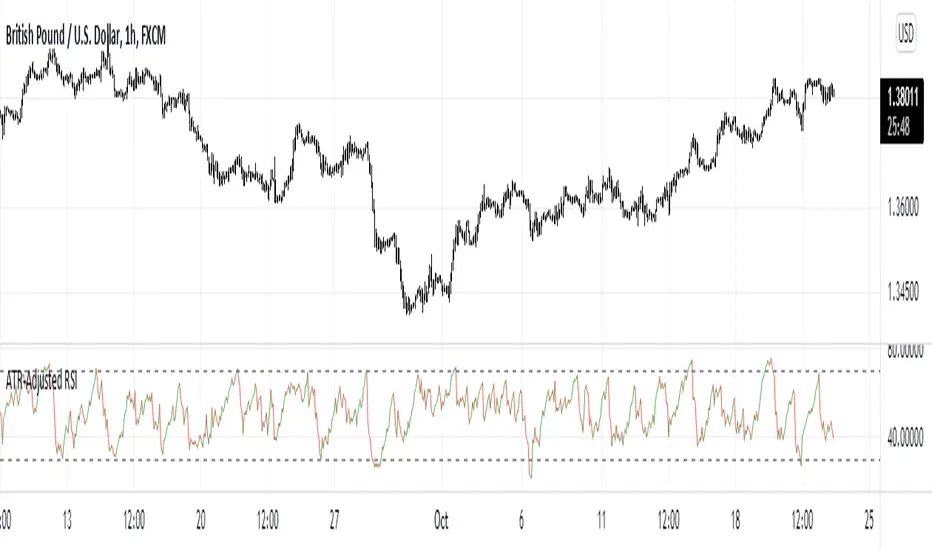
ATR-Adjusted RSIThis indicator adjusts the RSI values using the Average True Range. It is used the same way as a normal RSI.
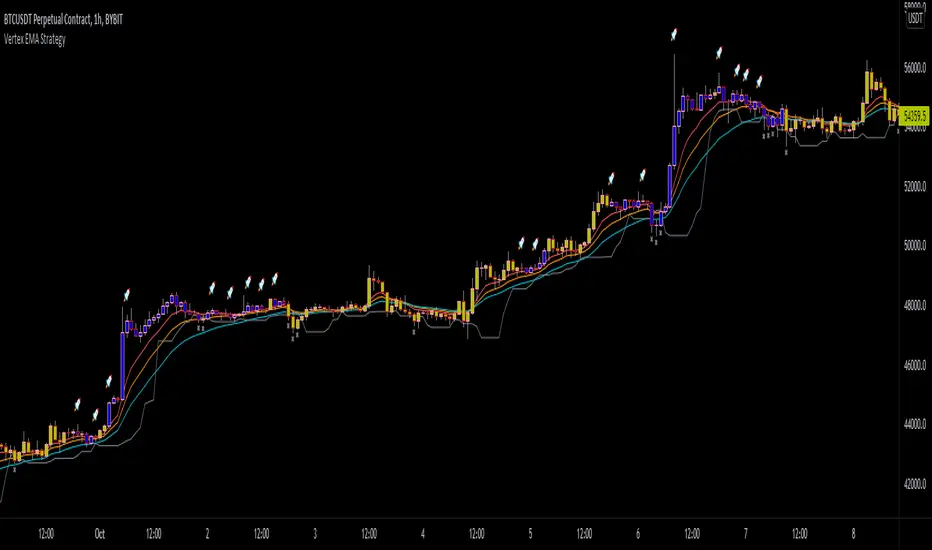
Vertex EMA StrategyRecently found an article sharing an EMA strategy written by Vertex. I copied a majority of the Long conditions into code here with some visual aid.
Essentially, watch for a the 8 EMA to be greater than the 21 EMA, and all the EMA's to be spread apart. Then get your trigger bar from a retracement from the 8 bar EMA. Stop on the lowest low of the past 5 bars, or on EMA 8 crossunder EMA 21.
This is intended to only be used on a 1h chart.
This was made for a friend.
Disclaimer : Please do your own research before making any decisions financially. I am not your financial advisor.
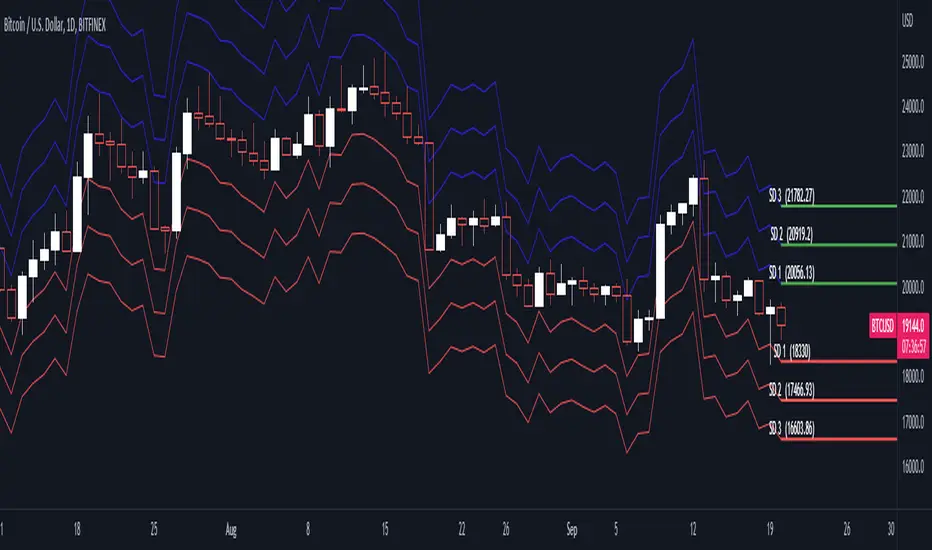
Standard Deviation ModelsBITFINEX:BTCUSD
The standard deviation model can be used for options traders that are selling options contracts to collect a premium to identify a specific range of strike prices which are optimal for selling based on the underlying asset’s historical price fluctuations. Traders will be able to identify the statistical likelihood that their options contract will be in the money (ITM) or out of the money (OTM).
Basic statistics of normal distributions (probability curve):
-1 SD to +1 SD = 68% likelihood
-2 SD to + 2 SD = 95% likelihood
-3 SD to +3 SD = 99% likelihood
Weekly Put SaleWeekly Put Sale
This study is a tool I use for selling weekly puts at the suggested strike prices.
1. The suggested strike prices are based on the weekly high minus an ATR multiple which can be adjusted in the settings
2. You can also adjust the settings to Monthly strike prices if you prefer selling options further out
3. I suggest looking for Put sale premium that is between 0.25% to 0.75% of the strike price for weekly Puts and 1% to 3% of the strike price for monthly Puts
Disclaimers: Selling Puts is an advanced strategy that is risky if you are not prepared to acquire the stock at the strike price you sell at on the expiration date. You must make your own decisions as you will bear the risks associated with any trades you place. To sum it up, trading is risky, and do so at your own risk.
Moses Long-term Index ETF Investing StrategyMoses is a script designed for long-term Index ETF investors.
Moses Goals.
1. Alerts you when a major crash is starting or is underway (Bear Market Signal)
2. Warn you of price events in the market that may lead to increased volatility and downward price pressure (Shock Event Warning)
3. Clearly inform you when the market is in a bull phase (growing) or bear phase (decreasing) (Bull/Bear Signal)
4. Inform you if the market is showing early signs of recovery from a crash
5. Alert you to catastrophic events, which are extreme one bar price drops (typically occurring before or during a major stock market crash)
Moses Logic.
Moses is the product of years of testing, but the application of the logic is simple.
1. Moses is designed specifically to work on a weekly chart (5 days per bar). Do not use the scripts on daily, monthly, or intraday charts
2. Moses Uses 4 Moving Average Indicators
3. Moses uses the position of price and the moving averages to determine the state of the market (Bull/Bear/Recovery)
4. Moses uses price action to determine shock events and catastrophic event warnings
5. The script is hardcoded to start trading in 1997. Why? So that the script's primary goal of avoiding crashes is tested on 3 major crashes, the Dotcom 2000, the Financial Crisis 2008, and the Corona Crash in 2020.
How Moses Works
Being able to exit the market before or during a large market crash enables you to preserve a portion of your equity from decline. Buying back into the market on a Bull Market or Early Recovery Signal enables you to enter the market at a lower price. This goal is achieved during major crashes.
As with all scripts, there are false signals which may incur a losing trade; you can see in the strategy tester results the % of Winning/Losing Trades.
Strategy Setup In Tradingview
Initial Capital $10,000
Order Size 100% of equity (this is because it is a long-term strategy with only one trade in play – you are either long or not invested, using a smaller position size means you cannot meaningfully compare a Moses strategy to a Buy & Hold Strategy)
Commission is $5 per trade (this is negligible because the strategy only trades at most once per year)
Slippage – 10 ticks
This Script Displays the 5 Main MOSES Signals Directly On Your Chart To Help Your Investing Decision Making
1. Bull Market Signal - Green
2. Bear Market Signal - Red
3. Stock Market Recovery Signal - Amber/Yellow
4. Shock Event Warning - Shock Label on Price
5. Catastrophic Event Warning - Red Catastrophe Label
Includes 5 Moses Scripts
• Moses Signals 2.0 (plots all alerts directly on the price chart)
• Moses Buy on Bull - Sell on Bear (Plots a buy on the first Bull Market Signal - Closes All Positions on a Bear Market Signal)
• Moses Buy on Bull - Sell on Catastrophe (Plots a buy on the first Bull Market Signal - Closes All Positions on a Catastrophic event)
• Moses Buy on Recovery - Sell on Catastrophe (Plots a buy on the first Recovery Signal - Closes All Positions on a Catastrophic Event)
• Buy & Hold Script (Used to compare the effectiveness of the strategies versus a Buy and Hold Strategy)
As the script has 3 Moses Strategies, the idea is that you choose the strategy that best fits the ETF you are trading.
Moses is a long-term investing strategy that has historically outperformed the US and European Major Indices for the last 24 years. There is no guarantee of future performance.
Moses has outperformed the market (buy and hold strategy) from 1997 on the:
Nasdaq 100, S&P500, Russell 3000, Nasdaq Composite, EuroStoxx 50, Italian Milano Borsa, German DAX, Paris CAC40
Moses does not outperform the market on:
Nifty 50, BSE Sensex, ASX 200, Chinese Market
Backtested Performance
Test Timeframe Jan 13 1997 - Sept 21 2021
Duration Years 24.75
Initial Investment $10,000
North America Strategy-------------------------------$ Return------------CAGR-------Total %
Nasdaq 100 Buy & Hold----------------------------$176,380-----------12.30%------1664%
Buy Bull - Sell Bear------------------$288,554-----------14.55%------2786%
Buy Bull - Sell Catastrophe---------$202,491-----------12.92%------1925%
Buy Recovery - Sell Catastrophe---$229,866-----------13.50%------2199%
North America Strategy-------------------------------$ Return-----------CAGR------Total %
S&P 500 Buy & Hold----------------------------$58,122-----------7.37%------481%
Buy Bull - Sell Bear------------------$48,544-----------6.59%------385%
Buy Bull - Sell Catastrophe $59,573-----------7.48%------496%
Buy Recovery - Sell Catastrophe $64,579-----------7.83%------546%
North America Strategy-------------------------------$ Return-----------CAGR------Total %
Russell 3000 Buy & Hold----------------------------$61,363-----------7.61%------514%
Buy Bull - Sell Bear------------------$52,957-----------6.97%------430%
Buy Bull - Sell Catastrophe---------$64,027-----------7.79%------540%
Buy Recovery - Sell Catastrophe---$71,565-----------8.28%------616%
North America Strategy-------------------------------$ Return-----------CAGR------Total %
Nasdaq Composite Buy & Hold----------------------------$112,839-----------10.29%------1028%
Buy Bull - Sell Bear------------------$123,308-----------10.68%------1133%
Buy Bull - Sell Catastrophe---------$107,699-----------10.08%------977%
Buy Recovery - Sell Catastrophe---$112,453-----------10.27%------1025%
*CAGR - Compound Annual Growth Rate
From a Declaration of Principles jointly adopted by a Committee of the American Bar Association and a Committee of Publishers
This work is provided to you for informational purposes only and should not be construed as an offer to buy or sell a particular security or a solicitation of offers to buy or sell a particular security. The author may make available certain information related to the potential price movement of particular securities. By reading this report or using the training materials, you acknowledge and agree that any reliance upon the content or data available is at your own sole risk. You are strongly advised to use your own judgment, your own research, and question everything. The information is generic in nature and not targeted to individuals or individual circumstances. The author is an independent investor and is not licensed to give formal Stock advice to the individual, run funds of any type, or accept fees for individual stock advice. The Author accepts no responsibility for loss of money for following any of the lessons or systems created. Trading of securities may not be suitable for all users of this information; if in doubt, seek a professional advisor. All use of this work is at your sole risk.
